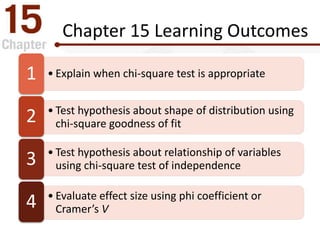
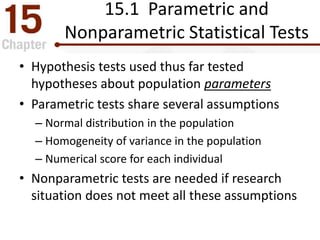
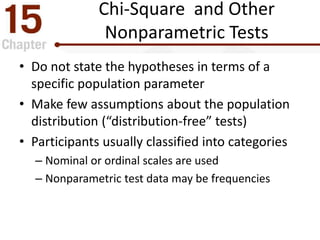
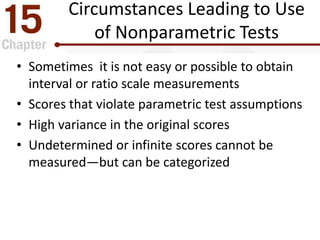
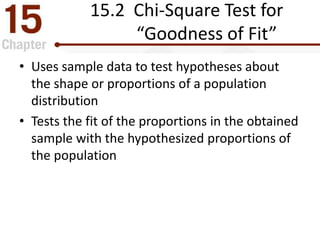
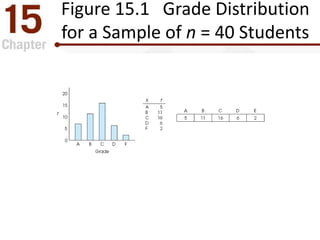
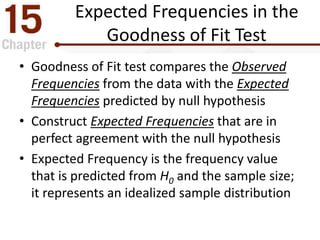
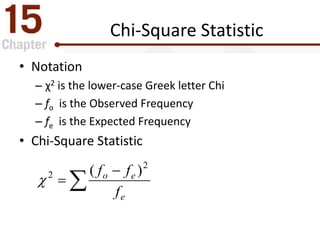
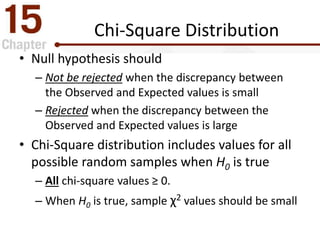
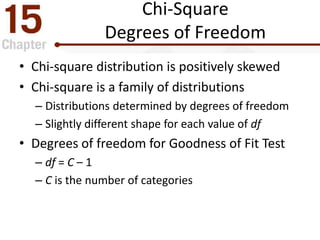
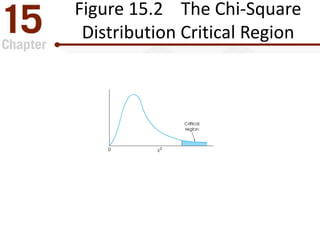
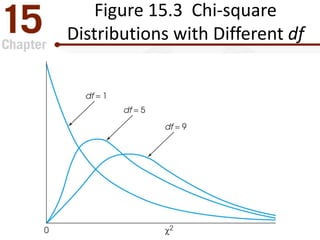
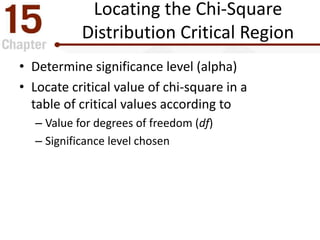
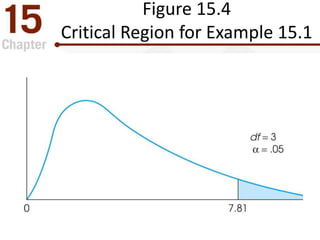
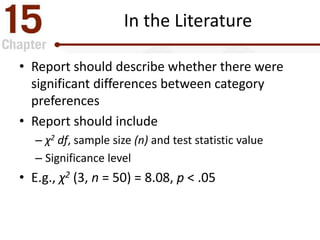
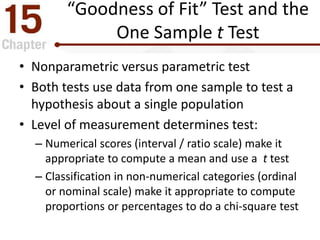
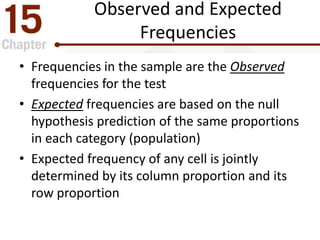
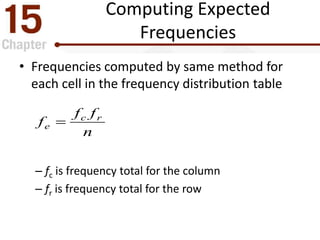
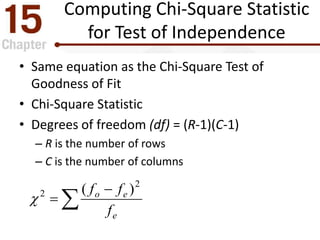
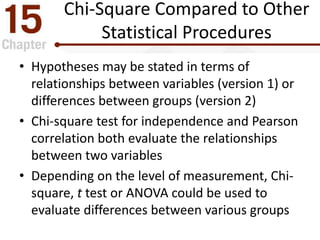
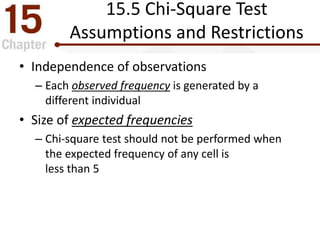
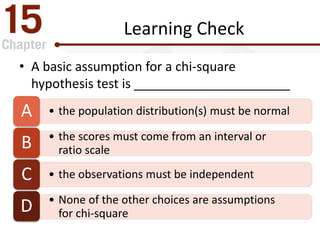
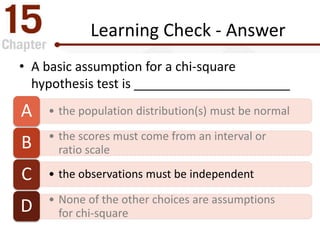
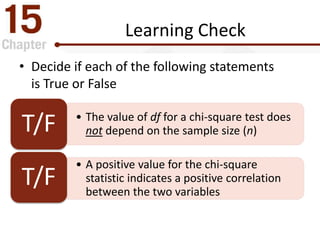
Chapter 15
The Chi-Square Statistic: Tests for
Goodness of Fit and Independence
PowerPoint Lecture Slides
Essentials of Statistics for the
Behavioral Sciences
Eighth Edition
by Frederick J. Gravetter and Larry B. Wallnau
Chapter 15 Learning Outcomes
• Explain when chi-square test is appropriate1
• Test hypothesis about shape of distribution using
chi-square goodness of fit2
• Test hypothesis about relationship of variables
using chi-square test of independence3
• Evaluate effect size using phi coefficient or
Cramer’s V4
Tools You Will Need
• Proportions (math review, Appendix A)
• Frequency distributions (Chapter 2)
15.1 Parametric and
Nonparametric Statistical Tests
• Hypothesis tests used thus far tested
hypotheses about population parameters
• Parametric tests share several assumptions
– Normal distribution in the population
– Homogeneity of variance in the population
– Numerical score for each individual
• Nonparametric tests are needed if research
situation does not meet all these assumptions
Chi-Square and Other
Nonparametric Tests
• Do not state the hypotheses in terms of a
specific population parameter
• Make few assumptions about the population
distribution (“distribution-free” tests)
• Participants usually classified into categories
– Nominal or ordinal scales are used
– Nonparametric test data may be frequencies
Circumstances Leading to Use
of Nonparametric Tests
• Sometimes it is not easy or possible to obtain
interval or ratio scale measurements
• Scores that violate parametric test assumptions
• High variance in the original scores
• Undetermined or infinite scores cannot be
measured—but can be categorized
15.2 Chi-Square Test for
“Goodness of Fit”
• Uses sample data to test hypotheses about
the shape or proportions of a population
distribution
• Tests the fit of the proportions in the obtained
sample with the hypothesized proportions of
the population
Figure 15.1 Grade Distribution
for a Sample of n = 40 Students
Goodness of Fit Null Hypothesis
• Specifies the proportion (or percentage) of the
population in each category
• Rationale for null hypotheses:
– No preference (equal proportions) among
categories, OR
– No difference in specified population from the
proportions in another known population
Goodness of Fit
Alternate Hypothesis
• Could be as terse as “Not H0”
• Often equivalent to “…population proportions
are not equal to the values specified in the
null hypothesis…”
Goodness of Fit Test Data
• Individuals are classified (counted) in each
category, e.g., grades; exercise frequency; etc.
• Observed Frequency is tabulated for each
measurement category (classification)
• Each individual is counted in one and only one
category (classification)
Expected Frequencies in the
Goodness of Fit Test
• Goodness of Fit test compares the Observed
Frequencies from the data with the Expected
Frequencies predicted by null hypothesis
• Construct Expected Frequencies that are in
perfect agreement with the null hypothesis
• Expected Frequency is the frequency value
that is predicted from H0 and the sample size;
it represents an idealized sample distribution



e
eo
f
ff 2
2 )(

Chi-Square Statistic
• Notation
– χ2 is the lower-case Greek letter Chi
– fo is the Observed Frequency
– fe is the Expected Frequency
• Chi-Square Statistic
Chi-Square Distribution
• Null hypothesis should
– Not be rejected when the discrepancy between
the Observed and Expected values is small
– Rejected when the discrepancy between the
Observed and Expected values is large
• Chi-Square distribution includes values for all
possible random samples when H0 is true
– All chi-square values ≥ 0.
– When H0 is true, sample χ2 values should be small
Chi-Square
Degrees of Freedom
• Chi-square distribution is positively skewed
• Chi-square is a family of distributions
– Distributions determined by degrees of freedom
– Slightly different shape for each value of df
• Degrees of freedom for Goodness of Fit Test
– df = C – 1
– C is the number of categories
Figure 15.2 The Chi-Square
Distribution Critical Region
Figure 15.3 Chi-square
Distributions with Different df
Locating the Chi-Square
Distribution Critical Region
• Determine significance level (alpha)
• Locate critical value of chi-square in a
table of critical values according to
– Value for degrees of freedom (df)
– Significance level chosen
Figure 15.4
Critical Region for Example 15.1
In the Literature
• Report should describe whether there were
significant differences between category
preferences
• Report should include
– χ2 df, sample size (n) and test statistic value
– Significance level
• E.g., χ2 (3, n = 50) = 8.08, p < .05
“Goodness of Fit” Test and the
One Sample t Test
• Nonparametric versus parametric test
• Both tests use data from one sample to test a
hypothesis about a single population
• Level of measurement determines test:
– Numerical scores (interval / ratio scale) make it
appropriate to compute a mean and use a t test
– Classification in non-numerical categories (ordinal
or nominal scale) make it appropriate to compute
proportions or percentages to do a chi-square test
Learning Check
• The expected frequencies in a chi-square test
_____________________________________
• are always whole numbersA
• can contain fractions or decimal valuesB
• can contain both positive and negative valuesC
• can contain fractions and negative numbersD
Learning Check - Answer
• The expected frequencies in a chi-square test
_____________________________________
• are always whole numbersA
• can contain fractions or decimal valuesB
• can contain both positive and negative valuesC
• can contain fractions and negative numbersD
Learning Check
• Decide if each of the following statements
is True or False
• In a Chi-Square Test, the Observed
Frequencies are always whole
numbers
T/F
• A large value for Chi-square will
tend to retain the null hypothesisT/F
Learning Check - Answers
• Observed frequencies are just
frequency counts, so there can be
no fractional values
True
• Large values of chi-square indicate
observed frequencies differ a lot
from null hypothesis predictions
False
15.3 Chi-Square Test for
Independence
• Chi-Square Statistic can test for evidence of a
relationship between two variables
– Each individual jointly classified on each variable
– Counts are presented in the cells of a matrix
– Design may be experimental or non-experimental
• Frequency data from a sample is used to test
the evidence of a relationship between the
two variables in the population using a two-
dimensional frequency distribution matrix
Null Hypothesis for
Test of Independence
• Null hypothesis: the two variables are
independent (no relationship exists)
• Two versions
– Single population: No relationship between two
variables in this population.
– Two separate populations: No difference between
distribution of variable in the two populations
• Variables are independent if there is no
consistent predictable relationship
Observed and Expected
Frequencies
• Frequencies in the sample are the Observed
frequencies for the test
• Expected frequencies are based on the null
hypothesis prediction of the same proportions
in each category (population)
• Expected frequency of any cell is jointly
determined by its column proportion and its
row proportion
Computing Expected
Frequencies
• Frequencies computed by same method for
each cell in the frequency distribution table
– fc is frequency total for the column
– fr is frequency total for the row
n
ff
f rc
e 
Computing Chi-Square Statistic
for Test of Independence
• Same equation as the Chi-Square Test of
Goodness of Fit
• Chi-Square Statistic
• Degrees of freedom (df) = (R-1)(C-1)
– R is the number of rows
– C is the number of columns



e
eo
f
ff 2
2 )(

Chi-Square Compared to Other
Statistical Procedures
• Hypotheses may be stated in terms of
relationships between variables (version 1) or
differences between groups (version 2)
• Chi-square test for independence and Pearson
correlation both evaluate the relationships
between two variables
• Depending on the level of measurement, Chi-
square, t test or ANOVA could be used to
evaluate differences between various groups
Chi-Square Compared to Other
Statistical Procedures (cont.)
• Choice of statistical procedure determined
primarily by the level of measurement
• Could choose to test the significance of the
relationship
– Chi-square
– t test
– ANOVA
• Could choose to evaluate the strength of the
relationship with r2
15.4 Measuring Effect Size
for Chi-Square
• A significant Chi-square hypothesis test shows
that the difference did not occur by chance
– Does not indicate the size of the effect
• For a 2x2 matrix, the phi coefficient (Φ)
measures the strength of the relationship
• So Φ2 would provide proportion of
variance accounted for just like r2n
2
φ


Effect size in a larger matrix
• For a larger matrix, a modification of the
phi-coefficient is used: Cramer’s V
• df* is the smaller of (R-1) or (C-1)
*)(
2
dfn
V


Interpreting Cramer’s V
Small
Effect
Medium
Effect
Large
Effect
For df* = 1 0.10 0.30 0.50
For df* = 2 0.07 0.21 0.35
For df* = 3 0.06 0.17 0.29
15.5 Chi-Square Test
Assumptions and Restrictions
• Independence of observations
– Each observed frequency is generated by a
different individual
• Size of expected frequencies
– Chi-square test should not be performed when
the expected frequency of any cell is
less than 5
Learning Check
• A basic assumption for a chi-square
hypothesis test is ______________________
• the population distribution(s) must be normalA
• the scores must come from an interval or
ratio scaleB
• the observations must be independentC
• None of the other choices are assumptions
for chi-squareD
Learning Check - Answer
• A basic assumption for a chi-square
hypothesis test is ______________________
• the population distribution(s) must be normalA
• the scores must come from an interval or
ratio scaleB
• the observations must be independentC
• None of the other choices are assumptions
for chi-squareD
Learning Check
• Decide if each of the following statements
is True or False
• The value of df for a chi-square test does
not depend on the sample size (n)T/F
• A positive value for the chi-square
statistic indicates a positive correlation
between the two variables
T/F
Learning Check - Answers
• The value of df for a chi-square test
depends only on the number of rows
and columns in the observation matrix
True
• Chi-square cannot be a negative number,
so it cannot accurately show the type of
correlation between the two variables
False
Figure 15.5: Example 15.2 SPSS Output—
Chi-square Test for Independence
Any
Questions
?
Concepts
?
Equations?

The Chi-Square Statistic: Tests for Goodness of Fit and Independence

  • 1.
    Chapter 15 The Chi-SquareStatistic: Tests for Goodness of Fit and Independence PowerPoint Lecture Slides Essentials of Statistics for the Behavioral Sciences Eighth Edition by Frederick J. Gravetter and Larry B. Wallnau
  • 2.
    Chapter 15 LearningOutcomes • Explain when chi-square test is appropriate1 • Test hypothesis about shape of distribution using chi-square goodness of fit2 • Test hypothesis about relationship of variables using chi-square test of independence3 • Evaluate effect size using phi coefficient or Cramer’s V4
  • 3.
    Tools You WillNeed • Proportions (math review, Appendix A) • Frequency distributions (Chapter 2)
  • 4.
    15.1 Parametric and NonparametricStatistical Tests • Hypothesis tests used thus far tested hypotheses about population parameters • Parametric tests share several assumptions – Normal distribution in the population – Homogeneity of variance in the population – Numerical score for each individual • Nonparametric tests are needed if research situation does not meet all these assumptions
  • 5.
    Chi-Square and Other NonparametricTests • Do not state the hypotheses in terms of a specific population parameter • Make few assumptions about the population distribution (“distribution-free” tests) • Participants usually classified into categories – Nominal or ordinal scales are used – Nonparametric test data may be frequencies
  • 6.
    Circumstances Leading toUse of Nonparametric Tests • Sometimes it is not easy or possible to obtain interval or ratio scale measurements • Scores that violate parametric test assumptions • High variance in the original scores • Undetermined or infinite scores cannot be measured—but can be categorized
  • 7.
    15.2 Chi-Square Testfor “Goodness of Fit” • Uses sample data to test hypotheses about the shape or proportions of a population distribution • Tests the fit of the proportions in the obtained sample with the hypothesized proportions of the population
  • 8.
    Figure 15.1 GradeDistribution for a Sample of n = 40 Students
  • 9.
    Goodness of FitNull Hypothesis • Specifies the proportion (or percentage) of the population in each category • Rationale for null hypotheses: – No preference (equal proportions) among categories, OR – No difference in specified population from the proportions in another known population
  • 10.
    Goodness of Fit AlternateHypothesis • Could be as terse as “Not H0” • Often equivalent to “…population proportions are not equal to the values specified in the null hypothesis…”
  • 11.
    Goodness of FitTest Data • Individuals are classified (counted) in each category, e.g., grades; exercise frequency; etc. • Observed Frequency is tabulated for each measurement category (classification) • Each individual is counted in one and only one category (classification)
  • 12.
    Expected Frequencies inthe Goodness of Fit Test • Goodness of Fit test compares the Observed Frequencies from the data with the Expected Frequencies predicted by null hypothesis • Construct Expected Frequencies that are in perfect agreement with the null hypothesis • Expected Frequency is the frequency value that is predicted from H0 and the sample size; it represents an idealized sample distribution
  • 13.
       e eo f ff 2 2 )(  Chi-SquareStatistic • Notation – χ2 is the lower-case Greek letter Chi – fo is the Observed Frequency – fe is the Expected Frequency • Chi-Square Statistic
  • 14.
    Chi-Square Distribution • Nullhypothesis should – Not be rejected when the discrepancy between the Observed and Expected values is small – Rejected when the discrepancy between the Observed and Expected values is large • Chi-Square distribution includes values for all possible random samples when H0 is true – All chi-square values ≥ 0. – When H0 is true, sample χ2 values should be small
  • 15.
    Chi-Square Degrees of Freedom •Chi-square distribution is positively skewed • Chi-square is a family of distributions – Distributions determined by degrees of freedom – Slightly different shape for each value of df • Degrees of freedom for Goodness of Fit Test – df = C – 1 – C is the number of categories
  • 16.
    Figure 15.2 TheChi-Square Distribution Critical Region
  • 17.
  • 18.
    Locating the Chi-Square DistributionCritical Region • Determine significance level (alpha) • Locate critical value of chi-square in a table of critical values according to – Value for degrees of freedom (df) – Significance level chosen
  • 19.
  • 20.
    In the Literature •Report should describe whether there were significant differences between category preferences • Report should include – χ2 df, sample size (n) and test statistic value – Significance level • E.g., χ2 (3, n = 50) = 8.08, p < .05
  • 21.
    “Goodness of Fit”Test and the One Sample t Test • Nonparametric versus parametric test • Both tests use data from one sample to test a hypothesis about a single population • Level of measurement determines test: – Numerical scores (interval / ratio scale) make it appropriate to compute a mean and use a t test – Classification in non-numerical categories (ordinal or nominal scale) make it appropriate to compute proportions or percentages to do a chi-square test
  • 22.
    Learning Check • Theexpected frequencies in a chi-square test _____________________________________ • are always whole numbersA • can contain fractions or decimal valuesB • can contain both positive and negative valuesC • can contain fractions and negative numbersD
  • 23.
    Learning Check -Answer • The expected frequencies in a chi-square test _____________________________________ • are always whole numbersA • can contain fractions or decimal valuesB • can contain both positive and negative valuesC • can contain fractions and negative numbersD
  • 24.
    Learning Check • Decideif each of the following statements is True or False • In a Chi-Square Test, the Observed Frequencies are always whole numbers T/F • A large value for Chi-square will tend to retain the null hypothesisT/F
  • 25.
    Learning Check -Answers • Observed frequencies are just frequency counts, so there can be no fractional values True • Large values of chi-square indicate observed frequencies differ a lot from null hypothesis predictions False
  • 26.
    15.3 Chi-Square Testfor Independence • Chi-Square Statistic can test for evidence of a relationship between two variables – Each individual jointly classified on each variable – Counts are presented in the cells of a matrix – Design may be experimental or non-experimental • Frequency data from a sample is used to test the evidence of a relationship between the two variables in the population using a two- dimensional frequency distribution matrix
  • 27.
    Null Hypothesis for Testof Independence • Null hypothesis: the two variables are independent (no relationship exists) • Two versions – Single population: No relationship between two variables in this population. – Two separate populations: No difference between distribution of variable in the two populations • Variables are independent if there is no consistent predictable relationship
  • 28.
    Observed and Expected Frequencies •Frequencies in the sample are the Observed frequencies for the test • Expected frequencies are based on the null hypothesis prediction of the same proportions in each category (population) • Expected frequency of any cell is jointly determined by its column proportion and its row proportion
  • 29.
    Computing Expected Frequencies • Frequenciescomputed by same method for each cell in the frequency distribution table – fc is frequency total for the column – fr is frequency total for the row n ff f rc e 
  • 30.
    Computing Chi-Square Statistic forTest of Independence • Same equation as the Chi-Square Test of Goodness of Fit • Chi-Square Statistic • Degrees of freedom (df) = (R-1)(C-1) – R is the number of rows – C is the number of columns    e eo f ff 2 2 )( 
  • 31.
    Chi-Square Compared toOther Statistical Procedures • Hypotheses may be stated in terms of relationships between variables (version 1) or differences between groups (version 2) • Chi-square test for independence and Pearson correlation both evaluate the relationships between two variables • Depending on the level of measurement, Chi- square, t test or ANOVA could be used to evaluate differences between various groups
  • 32.
    Chi-Square Compared toOther Statistical Procedures (cont.) • Choice of statistical procedure determined primarily by the level of measurement • Could choose to test the significance of the relationship – Chi-square – t test – ANOVA • Could choose to evaluate the strength of the relationship with r2
  • 33.
    15.4 Measuring EffectSize for Chi-Square • A significant Chi-square hypothesis test shows that the difference did not occur by chance – Does not indicate the size of the effect • For a 2x2 matrix, the phi coefficient (Φ) measures the strength of the relationship • So Φ2 would provide proportion of variance accounted for just like r2n 2 φ  
  • 34.
    Effect size ina larger matrix • For a larger matrix, a modification of the phi-coefficient is used: Cramer’s V • df* is the smaller of (R-1) or (C-1) *)( 2 dfn V  
  • 35.
    Interpreting Cramer’s V Small Effect Medium Effect Large Effect Fordf* = 1 0.10 0.30 0.50 For df* = 2 0.07 0.21 0.35 For df* = 3 0.06 0.17 0.29
  • 36.
    15.5 Chi-Square Test Assumptionsand Restrictions • Independence of observations – Each observed frequency is generated by a different individual • Size of expected frequencies – Chi-square test should not be performed when the expected frequency of any cell is less than 5
  • 37.
    Learning Check • Abasic assumption for a chi-square hypothesis test is ______________________ • the population distribution(s) must be normalA • the scores must come from an interval or ratio scaleB • the observations must be independentC • None of the other choices are assumptions for chi-squareD
  • 38.
    Learning Check -Answer • A basic assumption for a chi-square hypothesis test is ______________________ • the population distribution(s) must be normalA • the scores must come from an interval or ratio scaleB • the observations must be independentC • None of the other choices are assumptions for chi-squareD
  • 39.
    Learning Check • Decideif each of the following statements is True or False • The value of df for a chi-square test does not depend on the sample size (n)T/F • A positive value for the chi-square statistic indicates a positive correlation between the two variables T/F
  • 40.
    Learning Check -Answers • The value of df for a chi-square test depends only on the number of rows and columns in the observation matrix True • Chi-square cannot be a negative number, so it cannot accurately show the type of correlation between the two variables False
  • 41.
    Figure 15.5: Example15.2 SPSS Output— Chi-square Test for Independence
  • 42.

Editor's Notes

  • #9 FIGURE 15.1 A distribution of grades for a sample of n = 40 students. The same frequency distribution is shown as a bar graph, as a table, and with the frequencies written in a series of boxes.
  • #17 FIGURE 15.2 Chi-square distributions are positively skewed. The critical region is placed in the extreme tail, which reflects large chi-square values.
  • #18 FIGURE 15.3 The shape of the chi-square distribution for different values of df. As the number of categories increases, the peak (mode) of the distribution has a larger chi-square value.
  • #20 FIGURE 15.4 For Example 15.1 , the critical region begins at a chi-square value of 7.81.
  • #28 Note 1: under the second version of the null hypothesis, the null hypothesis does NOT say that the two distributions are identical; instead it says they have the same proportions. Note 2: stating that there is no relationship between variables (version 1) is equivalent to stating that the distributions have equal proportions.
  • #42 FIGURE 15.5. The SPSS output for the chi-square test for independence in Example 15.2