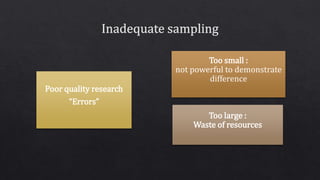
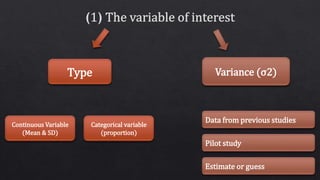
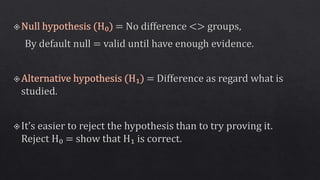
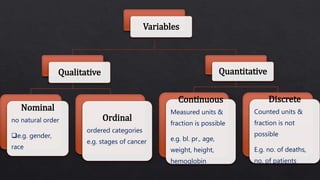
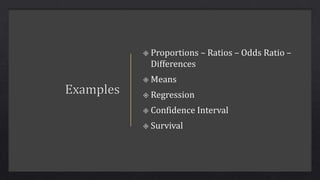
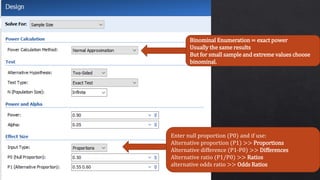
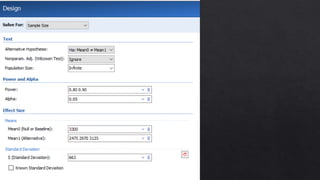
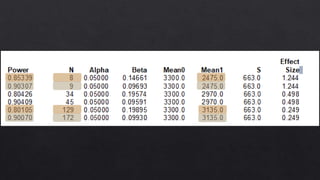
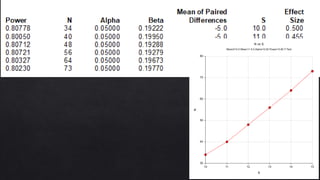
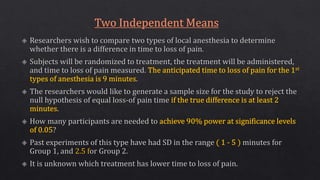
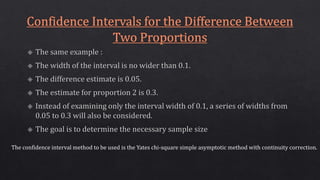
Sample size and how to calculate it
- Why sample size is important
- Alpha and beta errors
- Main outcome and Effect size
- Practical examples using Means-Proportions-Correlation- Confidence Interval
4. Type
Continuous Variable
(Mean & SD)
Categorical variable
(proportion)
Variance (σ2)
Data from previous studies
Pilot study
Estimate or guess
5.
6.
7. REALITY
Decision H₀ True H₀ False
Reject H₀ Error : Type I (α) Correct (1-β)
Not Reject H₀ Correct (1-α) Error: Type II (β)
Prove difference
No difference
False +ve
Difference is real
Fail to prove it False -ve
The Power
8.
9.
10. Testing relation in one directions
Smoking and lung cancer
Testing relation in both directions
“A” is either better or worse than “B”
18. Variables
Qualitative
Nominal
no natural order
e.g. gender,
race
Ordinal
ordered categories
e.g. stages of cancer
Quantitative
Continuous
Measured units &
fraction is possible
e.g. bl. pr., age,
weight, height,
hemoglobin
Discrete
Counted units &
fraction is not
possible
E.g. no. of deaths,
no. of patients
19.
20.
21.
22.
23. Binominal Enumeration = exact power
Usually the same results
But for small sample and extreme values choose
binominal.
Enter null proportion (P0) and if use:
Alternative proportion (P1) >> Proportions
Alternative difference (P1-P0) >> Differences
Alternative ratio (P1/P0) >> Ratios
alternative odds ratio >> Odds Ratios
24. The higher the difference the lower the sample size needed
26. Group Allocation :
Equal (N1 = N2).
Enter N1, solve for N2 and vice versa.
Enter R = N2/N1, solve for N1 and N2.
Enter percentage in Group 1, solve for N1 and N2.
P1 = Treatment Group
P2 = Control Group.
47. The confidence interval method to be used is the Yates chi-square simple asymptotic method with continuity correction.
Editor's Notes
If the study has more than one important outcome variables:Separate sample size calculations should be done for each importantvariable & select the largest calculated size
كل مرة بترفض فيها ال h0
فيه احتمالية للخطأ
Reject H₀ when it is true. (type 1 error). = Accept H₁ = False positive. .. Alpha = probability of type 1 reject a true null hypothesis
Reject H₀ when it is false. (Correct)
Not Reject H₀ when it is true. (Correct)
Not reject H₀ when it is false. (type II error) = Reject H₁ = False negative. Beta = probability of fail to reject a false null hypothesis.
Things do not always work out as expected, you may be surprised by your results.(2) Use two-sided tests unless there is a very good reason for doing otherwise .(3) If you use one sided tests , direction of the test must be specified in advance.(4) Never use one sided tests to make a non-significant difference significant
4.
One tail 2 tail ::
نشتغل بنية إثبات إ،ه أعلى في جهة واحدة
لو جايز يطلع العكس يبقى اتجاهين
One tail :: عدد أقل
The variable of interest is not their actual weight, but how much their weight changed.
In this design, the data are analyzed using a one-sample t-test on the differences between the paired observations.
The null hypothesis is that the average difference is zero. The alternative hypothesis is that the average difference is some nonzero value.
hazard ratio (HR) is the ratio of the hazard rates corresponding to the conditions described by two levels of an explanatory variable. For example, in a drug study, the treated population may die at twice the rate per unit time as the control population. The hazard ratio would be 2, indicating higher hazard of death from the treatment. Or in another study, men receiving the same treatment may suffer a certain complication ten times more frequently per unit time than women, giving a hazard ratio of 10.
Z-test is a statistical test where normal distribution is applied and is basically used for dealing with problems relating to large samples when n ≥ 30.
For example suppose a person wants to test if both tea & coffee are equally popular in a particular town. Then he can take a sample of size say 500 from the town out of which suppose 280 are tea drinkers. To test the hypothesis, he can use Z-test.