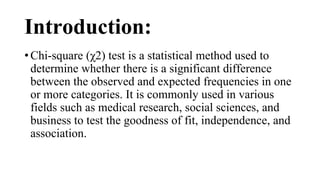
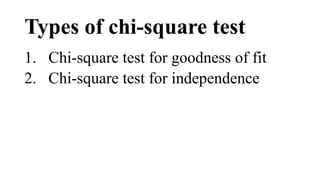
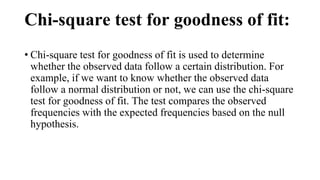
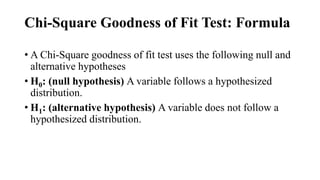
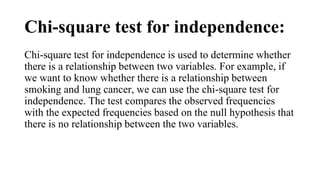
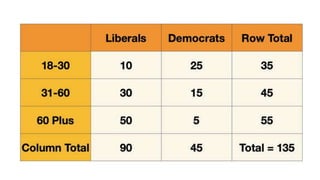
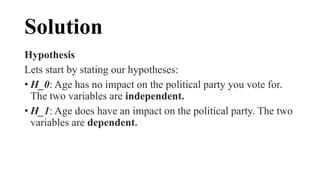
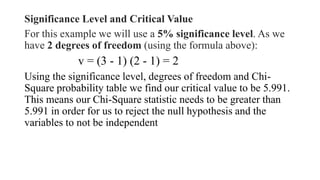
This document provides an overview of chi-square tests, including:
- Chi-square tests determine if observed and expected frequencies differ significantly. They are used in fields like medical research.
- There are tests for goodness of fit and independence. Goodness of fit compares data to a hypothesized distribution. Independence examines the relationship between two variables.
- Examples demonstrate applying chi-square tests, calculating statistics, determining significance. The independence example found age impacts political party choice.
Chi Square Test…..
This topic comes under Biostatistics…….
This is useful for Maths students, B.Pharm Students ,M.Pharm Students who studying Biostatistics.
This Presentation Contain following...
#History and Introduction
#Conditions
#Formula
#Classification
#Types of Non-Parametric Chi Square Test
#Test of Independence
#Steps for Test of Independence
#Problem and Solution for Test of Independence
#Test of Goodness of Fit
#Problem and Solution for Test of Goodness of Fit
#Applications of Chi Square Test
Thanks for the Help and Guidance of Dr. M. S. Bhatia Sir
linearity concept of significance, standard deviation, chi square test, stude...KavyasriPuttamreddy
Linearity concept of significance, standard deviation, chi square test, students T- test, ANOVA test , pharmaceutical science, statistical analysis, statistical methods, optimization technique, modern pharmaceutics, pharmaceutics, mpharm 1 unit i sem, 1 year m
pharm, applications of chi square test, application of standard deviation , pharmacy, method to compare dissolution profile, statistical analysis of dissolution profile, important statical analysis, m. pharmacy, graphical representation of standard deviation, graph of chi square test, graph of T test , graph of ANOVA test ,formulation of t test, formulation of chi square test, formula of standard deviation.
Chi‑square Test and its Application in Hypothesis Testing
Rakesh Rana, Richa Singhal
Statistical Section, Central Council for Research in Ayurvedic Sciences, Ministry of AYUSH, GOI, New Delhi, India
A chi-squared test is a statistical hypothesis test that is valid to perform when the test statistic is chi-squared distributed under the null hypothesis, specifically Pearson's chi-squared test and variants
differences between the observed values
This is my statistics exam I need help I have been lost this whole s.docxdivinapavey
This is my statistics exam I need help I have been lost this whole semester
Identify each of the following as examples of nominal, ordinal, interval, or ratio scales of measurement.
1.Identify each of the following as examples of nominal, ordinal, interval, or ratio scales of measurement.
1. A poll of registered voters in Florida asking which candidate they support
2. The length of time required for a wound to heal when using a new medicine
3. The number of telephone calls arriving at a switchboard per five-minute period
4. The distance first-year college football players can kick a ball
5. Mental health diagnoses present in an elderly population
6. The rankings of employees on their job performance
2) Two hundred raffle tickets are sold. Your friend has five people in her family who each bought two raffle tickets. What is the probability that someone from her family will win the raffle?
3) Jolie has 45 minutes to do her statistics homework. If the mean is 38 minutes and the standard deviation is 3, calculate Jolie's z score. Once calculated, interpret your findings in terms of Jolie's performance.
4) . A psychologist measures units of change for a memory test after students are given an opportunity to sleep only four hours. The following change units were obtained: 7, -12, 4, -7, 3, -10. Find the a) mean, b) median, c) mode, d) standard deviation, e) range, and f) variance.
5) A student scored 81 on a chemistry test and 75 on a history test. For the chemistry test, the mean was 70 and the standard deviation was 20. For the history test, the mean was 65 and the standard deviation was 8. Did the student do better on the chemistry test or the history test? Explain your answer
6. Suppose you want to figure out what to do with your degree in psychology. You ask some fellow students from your psychology program who recently graduated to find out what they are doing with their degree and how much it pays. What type of sampling is this? What are the limitations of this sampling approach?
7. Variables in which the values are categories are known as)
Interval variables
Nominal variables
Ordinal variables
Ratio variables
8. Before the researcher can conduct a statistical test, the research question must be translated into
A testable hypothesis
Additional observations
Mathematical symbols
Numbers
9. The hypothesis stating that there are no differences, effects, or relationships is)
The alternative hypothesis
The baseline hypothesis
The null hypothesis
The reasonable hypothesis
10. A group of students made the following scores on a 10-item quiz in psychological statistics: {5, 6, 7, 7, 7, 8, 8, 9, 9, 10, 10} What is the mean score?
6.6
7.2
7.8
8.7
11. A group of students made the following scores on a 10-item quiz in psychological statistics: {5, 6, 7, 7, 7, 8, 8, 9, 9, 10, 10} What is the median score?
6
7
8
9
12. A group of students made the following scores on a 10-item quiz in psychological statistics: {5, 6, 7, 7, 7, 8, 8, 9, 9, 10, 1.
Francesca Gottschalk - How can education support child empowerment.pptxEduSkills OECD
Francesca Gottschalk from the OECD’s Centre for Educational Research and Innovation presents at the Ask an Expert Webinar: How can education support child empowerment?
Normal Labour/ Stages of Labour/ Mechanism of LabourWasim Ak
Normal labor is also termed spontaneous labor, defined as the natural physiological process through which the fetus, placenta, and membranes are expelled from the uterus through the birth canal at term (37 to 42 weeks
Operation “Blue Star” is the only event in the history of Independent India where the state went into war with its own people. Even after about 40 years it is not clear if it was culmination of states anger over people of the region, a political game of power or start of dictatorial chapter in the democratic setup.
The people of Punjab felt alienated from main stream due to denial of their just demands during a long democratic struggle since independence. As it happen all over the word, it led to militant struggle with great loss of lives of military, police and civilian personnel. Killing of Indira Gandhi and massacre of innocent Sikhs in Delhi and other India cities was also associated with this movement.
Model Attribute Check Company Auto PropertyCeline George
In Odoo, the multi-company feature allows you to manage multiple companies within a single Odoo database instance. Each company can have its own configurations while still sharing common resources such as products, customers, and suppliers.
Safalta Digital marketing institute in Noida, provide complete applications that encompass a huge range of virtual advertising and marketing additives, which includes search engine optimization, virtual communication advertising, pay-per-click on marketing, content material advertising, internet analytics, and greater. These university courses are designed for students who possess a comprehensive understanding of virtual marketing strategies and attributes.Safalta Digital Marketing Institute in Noida is a first choice for young individuals or students who are looking to start their careers in the field of digital advertising. The institute gives specialized courses designed and certification.
for beginners, providing thorough training in areas such as SEO, digital communication marketing, and PPC training in Noida. After finishing the program, students receive the certifications recognised by top different universitie, setting a strong foundation for a successful career in digital marketing.
How to Make a Field invisible in Odoo 17Celine George
It is possible to hide or invisible some fields in odoo. Commonly using “invisible” attribute in the field definition to invisible the fields. This slide will show how to make a field invisible in odoo 17.
1. ACHARYA NARENDRA DEVA UNIVERSITY OF AGRICULTURE &
TECHNOLOGY, KUMARGANJ, AYODHYA (U.P.) 224229
Assignment
on
Chi-square test
Course No : STAT-502 4(3+1)
Course name : Statistical methods for applied sciences
Presented to : Presented by :
Dr. Vishal Mehta Vikas Yadav
Assistant Professor Id. No. A-11153/19/22
Department of Agril. Statistics Ph. D. 1st Semester
Soil Science and Agril. Chemistry
2. Content:
• Introduction
• Properties of Chi-square test
• Limitations of Chi-square test
• Type of Chi-square test
1. Chi-square test for goodness of fit
2. Chi-square test for independence
• Chi-square test for goodness of fit: Example
• Chi-square test for independence: Example
• References
3. Introduction:
• Chi-square (χ2) test is a statistical method used to
determine whether there is a significant difference
between the observed and expected frequencies in one
or more categories. It is commonly used in various
fields such as medical research, social sciences, and
business to test the goodness of fit, independence, and
association.
4. Properties
The chi-square test has the following significant properties:
1.If you multiply the number of degrees of freedom by two,
you will receive an answer that is equal to the variance.
2.The chi-square distribution curve approaches the data is
normally distributed as the degree of freedom increases.
3.The mean distribution is equal to the number of degrees of
freedom
5. Limitations of Chi-Square Test
There are two limitations to using the chi-square test that you
should be aware of.
• The chi-square test, for starters, is extremely sensitive to
sample size. Even insignificant relationships can appear
statistically significant when a large enough sample is used.
Keep in mind that "statistically significant" does not always
imply "meaningful" when using the chi-square test.
6. • Be mindful that the chi-square can only determine whether
two variables are related. It does not necessarily follow that
one variable has a causal relationship with the other. It would
require a more detailed analysis to establish causality
7. Types of chi-square test
1. Chi-square test for goodness of fit
2. Chi-square test for independence
8. Chi-square test for goodness of fit:
• Chi-square test for goodness of fit is used to determine
whether the observed data follow a certain distribution. For
example, if we want to know whether the observed data
follow a normal distribution or not, we can use the chi-square
test for goodness of fit. The test compares the observed
frequencies with the expected frequencies based on the null
hypothesis.
9. Chi-Square Goodness of Fit Test: Formula
• A Chi-Square goodness of fit test uses the following null and
alternative hypotheses
• H0: (null hypothesis) A variable follows a hypothesized
distribution.
• H1: (alternative hypothesis) A variable does not follow a
hypothesized distribution.
10. We use the following formula to calculate the Chi-Square test
statistic X2:
X2 = Σ(O-E)2 / E
where:
Σ: is a fancy symbol that means “sum”
O: observed value
E: expected value
11. Chi-Square test Goodness of Fit Test: Example
• A shop owner claims that an equal number of customers
come into his shop each weekday. To test this hypothesis, an
independent researcher records the number of customers that
come into the shop on a given week and finds the following:
• Monday: 50 customers
• Tuesday: 60 customers
• Wednesday: 40 customers
• Thursday: 47 customers
• Friday: 53 customers
12. Solution:
We will use the following steps to perform a Chi-Square goodness
of fit test to determine if the data is consistent with the shop
owner’s claim
Step 1: Define the hypotheses.
We will perform the Chi-Square goodness of fit test using the
following hypotheses:
• H0: An equal number of customers come into the shop each day.
• H1: An equal number of customers do not come into the shop
each day.
13. Step 2: Calculate (O-E)2 / E for each day.
There were a total of 250 customers that came into the shop
during the week. Thus, if we expected an equal amount to
come in each day then the expected value “E” for each day
would be 50
• Monday: (50-50)2 / 50 = 0
• Tuesday: (60-50)2 / 50 = 2
• Wednesday: (40-50)2 / 50 = 2
• Thursday: (47-50)2 / 50 = 0.18
• Friday: (53-50)2 / 50 = 0.18
14. • Step 3: Calculate the test statistic X2.
X2 = Σ(O-E)2 / E = 0 + 2 + 2 + 0.18 + 0.18 = 4.36
• Step 4: Calculate the p-value of the test statistic X2.
The p-value associated with X2 = 4.36 and n-1 = 5-1 = 4
degrees of freedom is 0.359472
15. Conclusion
• Since this p-value is not less than 0.05, we fail to reject the
null hypothesis. This means we do not have sufficient
evidence to say that the true distribution of customers is
different from the distribution that the shop owner claimed
16. Chi-square test for independence:
Chi-square test for independence is used to determine whether
there is a relationship between two variables. For example, if
we want to know whether there is a relationship between
smoking and lung cancer, we can use the chi-square test for
independence. The test compares the observed frequencies
with the expected frequencies based on the null hypothesis that
there is no relationship between the two variables.
17. Assumptions
• Both variables are CATEGORICAL
• Observations are INDEPENDENT
• The COUNT for each category is GREATER THAN 5
• Each count in a category is MUTUALLY EXCLUSIVE
• Data is chosen RANDOMLY
18. Chi-Square test for independence : Example
• We want to see if age has an impact on what political party
you vote for. We collect a random sample of 135 people and
display it in the following contingency table broken down by
age and political party.
19.
20. Solution
Hypothesis
Lets start by stating our hypotheses:
• H_0: Age has no impact on the political party you vote for.
The two variables are independent.
• H_1: Age does have an impact on the political party. The two
variables are dependent.
21. Significance Level and Critical Value
For this example we will use a 5% significance level. As we
have 2 degrees of freedom (using the formula above):
v = (3 - 1) (2 - 1) = 2
Using the significance level, degrees of freedom and Chi-
Square probability table we find our critical value to be 5.991.
This means our Chi-Square statistic needs to be greater than
5.991 in order for us to reject the null hypothesis and the
variables to not be independent
22. • Calculating Expected Counts
We now need to determine the expected count frequency for each cell in
our contingency table. These are the expected values if the null
hypothesis is true and is calculated using the following formula:
Er,c = nr*nc /nT
Where n_r and n_c are the row and column totals for certain categories
and n_T is the total number of counts.
For example, the expected count for ages 18–30 who voted Liberals is:
E1,1 = 35*90/135 = 23.3
We can then populate the contingency table with these expected values
(in brackets):
23.
24. Chi-Square Statistic
It is now time to calculate the Chi-Square statistic using the
formula above
Χ2
2=(10-23.3)2/23.3 + (30-30)2/30 + (50–36.7)2/36.7 +
(25–11.7)2/11.7 + (15–15)2/15 + (5–18.3)2/18.3
This equals 37.2
Therefore, our statistic is much greater than the critical value and
so we can reject the null hypothesis
25. Conclusion
In this article we have described and shown an example of the
Chi-Square test of independence. This test measures if two
categorical variables are dependent on each-other. This is used
in Data Science for Feature Selection where we only want
modelling features that have an effect on the target.
26. References
1. Wikipedia
2. www.towarddatascience.com
3. www.statology.org
4. Agresti, A. (2018). An introduction to categorical data
analysis. Wiley.
5. Kothari, C. R. (2004). Research methodology: methods and
techniques. New Age International.