Downloaded 119 times

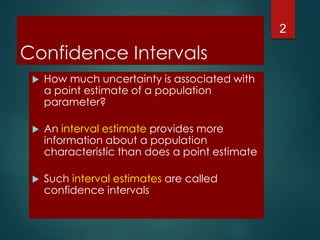
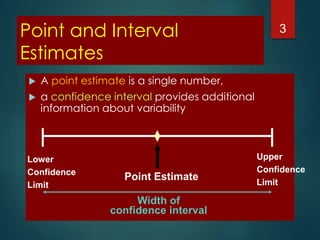
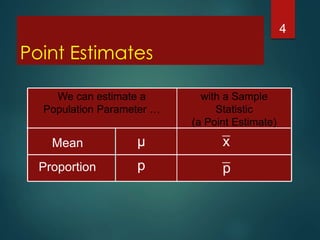
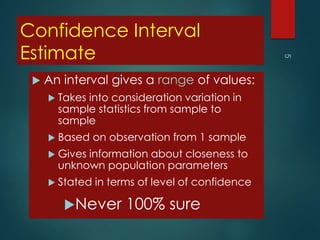
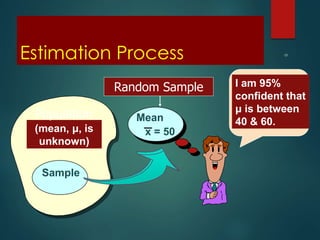
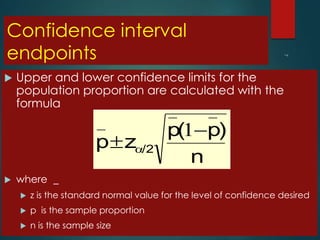
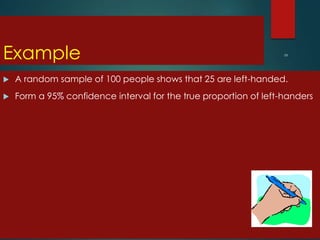

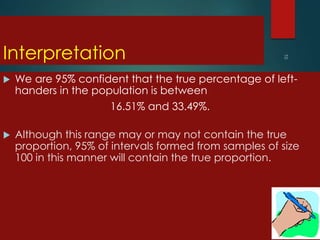
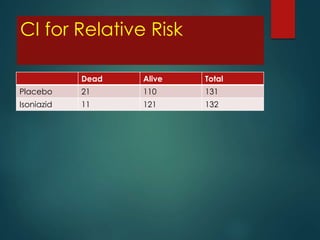
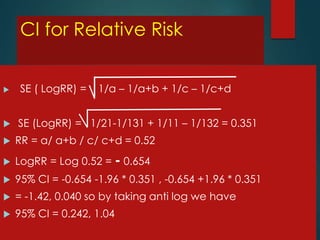

This document discusses confidence intervals and probability. It defines confidence intervals as a range of values that provide more information than a point estimate by taking into account variability between samples. The document provides examples of how to calculate 95% confidence intervals for a proportion, mean, odds ratio, and relative risk using sample data and the appropriate formulas. It explains that confidence intervals convey the level of uncertainty associated with point estimates and allow estimation of how close a sample statistic is to the unknown population parameter.


![Hypothalamus short ppt by Dr. Neha [PT].pptx](https://cdn.slidesharecdn.com/ss_thumbnails/hypothalamusbydr-260124145759-b9f94a93-thumbnail.jpg?width=640&height=640&fit=bounds)


