Downloaded 5,222 times


![ANGLE MODULATION
Amplitude of the modulated carrier is held constant and either the
phase or the time derivative of the phase of the carrier is varied linearly
with the message signal m(t).
General angle-modulated signal is given by
m( t ) = Vc cos[ωct + θ ( t ) ]
In angle modulation, θ(t) is prescribed as being a function of the
modulating signal
If vm(t) is the modulating signal, angle modulation is expressed as
θ (t ) = F [ vm (t ) ]
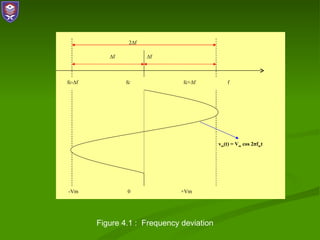
vm (t ) = Vm sin(ωmt )
where
ωm = 2π f m](https://image.slidesharecdn.com/chapter4frequencymodulation-120317021055-phpapp01/85/Chapter-4-frequency-modulation-5-320.jpg)

![MATHEMATICAL ANALYSIS
Instantaneous frequency deviation
Instantaneous change in the frequency of the carrier and is defined
as the first time derivative of the instantaneous phase deviation
instantaneous frequency deviation = θ '(t ) rad/s
θ '(t ) rad/s cycle
or = = = Hz
2π rad/cycle s
Instantaneous frequency
the precise frequency of the carrier at any given instant of time and
is defined as the first time derivative of the instantaneous phase
d
instantaneous frequency = ωi (t ) = [ ωct + θ (t )]
dt
= ωc + θ '(t ) rad/s](https://image.slidesharecdn.com/chapter4frequencymodulation-120317021055-phpapp01/85/Chapter-4-frequency-modulation-8-320.jpg)

![FREQUENCY MODULATION
(FM)
Variation of dθ /dt produces Frequency
Modulation
Frequency modulation implies that dθ/dt is
proportional to the modulating signal.
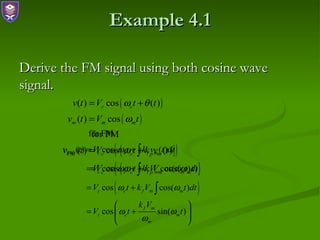
This yields v (t ) = V sin [ ω t + θ (t )]
FM c c
= Vc sin ωc t + ∫ θ '(t )dt
= Vc sin ωc t + ∫ k f vm (t )dt
= Vc sin ωc t + k f Vm ∫ sin ωm (t ) dt
k f Vm
= Vc sin ωc t − cos ωm (t )
ωm ](https://image.slidesharecdn.com/chapter4frequencymodulation-120317021055-phpapp01/85/Chapter-4-frequency-modulation-11-320.jpg)
![MODULATION INDEX
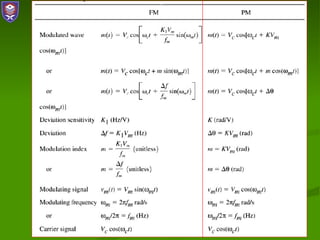
Directly proportional to the amplitude of the modulating signal
and inversely proportional to the frequency of the modulating
signal
Ratio of the frequency deviation and the modulating frequency
FM equation : vFM (t ) = Vc sin [ ωct − β cos ωm (t )]
β as modulation index : k f Vm ∆f c
β= =
ωm fm
Example:
Determine the modulation index for FM signal with modulating frequency
is 10KHz deviated by ±10kHz.
Answer : (20KHz/10KHz) = 2 .0 (unitless)
The total frequency change, 10kHz x 2 is called the carrier swing](https://image.slidesharecdn.com/chapter4frequencymodulation-120317021055-phpapp01/85/Chapter-4-frequency-modulation-15-320.jpg)

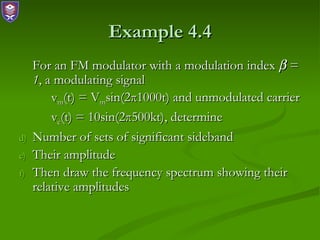
![Example 4.2
A 1 MHz carrier freq with a measured sensitivity of 3
kHz/V is modulated with a 2 V, 4 kHz sinusoid.
Determine
1. the max freq deviation of the carrier
2. the modulation index
3. the modulation index if the modulation voltage is
doubled
4. the modulation index for vm(t)=2cos[2π(8kHz)t)]V
5. express the FM signal mathematically for a cosine
carrier & the cosine-modulating signal of part 4. Carrier
amplitude is 10V](https://image.slidesharecdn.com/chapter4frequencymodulation-120317021055-phpapp01/85/Chapter-4-frequency-modulation-19-320.jpg)


![CARSON’S RULE
BW = 2[ f d (max) + f m (max) ]
fd (max) = max. frequency deviation
fm (max) = max. modulating frequency
Carson’s rule always give a lower BW calculated with the
formula BW = 2fmN.
Consider only the power in the most significant sidebands
whose amplitudes are greater than 1% of the carrier.
Rule for the transmission bandwidth of an FM signal
generated by a single of frequency fm as follows:
BT = BW ≅ 2 ∆f + 2 f m = 2 ∆f (1 + 1 )
β
or = 2 fm ( 1 + β )](https://image.slidesharecdn.com/chapter4frequencymodulation-120317021055-phpapp01/85/Chapter-4-frequency-modulation-30-320.jpg)
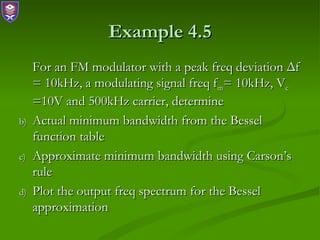


![Example 4.7
An FM signal is given as vFM(t)=12cos[(6π106t)
+ 5sin(2π x 1250t)] V. Determine
a. freq of the carrier signal
b. freq of the modulating signal
c. modulation index
d. freq deviation
e. power dissipated in 10 ohm resistor.](https://image.slidesharecdn.com/chapter4frequencymodulation-120317021055-phpapp01/85/Chapter-4-frequency-modulation-36-320.jpg)


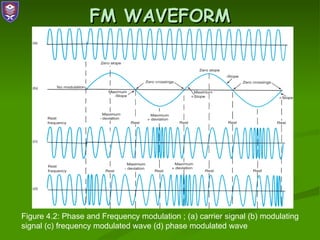
1) Frequency modulation (FM) varies the instantaneous frequency of the carrier signal in proportion to an input modulating signal. This produces sidebands around the carrier frequency. 2) FM is considered superior to amplitude modulation (AM) due to better fidelity, noise immunity, and transmission efficiency. However, FM requires more bandwidth than AM. 3) The modulation index determines the number of significant sidebands and bandwidth occupied. It is defined as the peak frequency deviation divided by the modulating signal frequency.