This chapter of the textbook covers amplitude modulation fundamentals, including:
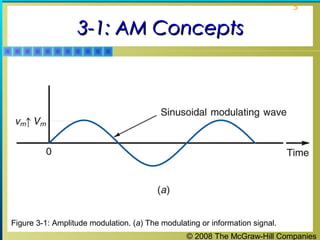
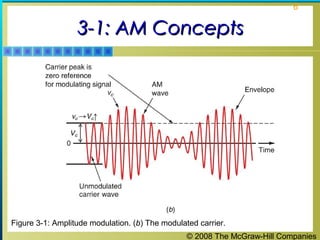
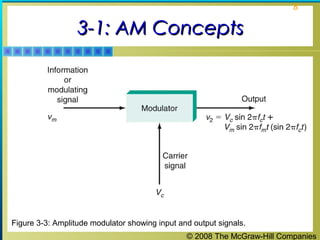
- The basic concepts of how an information signal varies the amplitude of a carrier wave in AM.
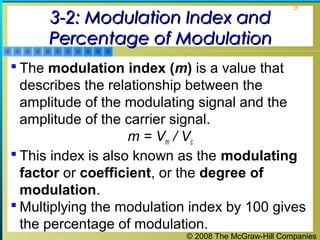
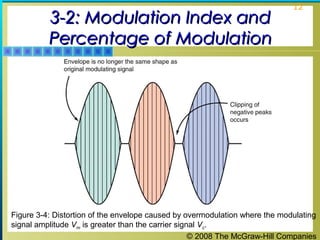
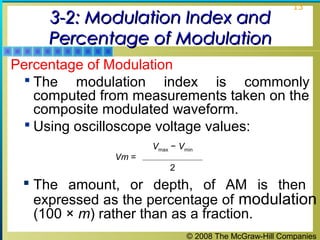
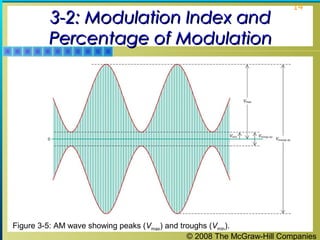
- Modulation index and percentage of modulation, and the importance of avoiding overmodulation which causes distortion.
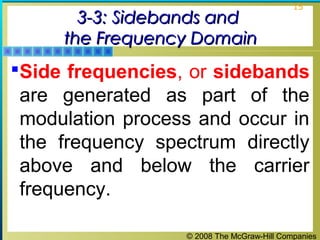
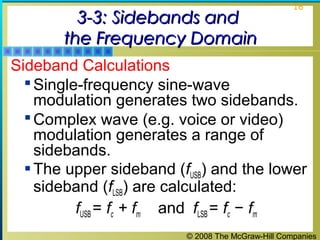
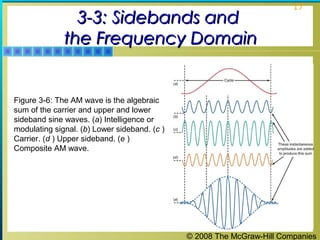
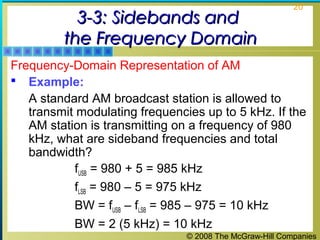
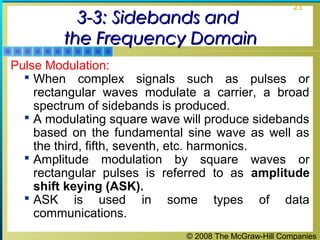
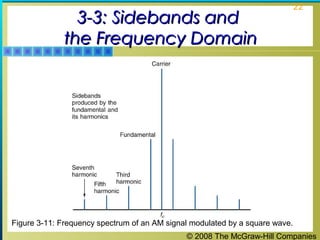
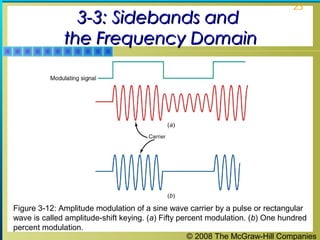
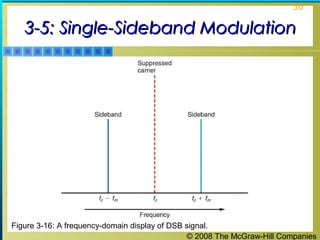
- How sidebands are generated above and below the carrier frequency during modulation.
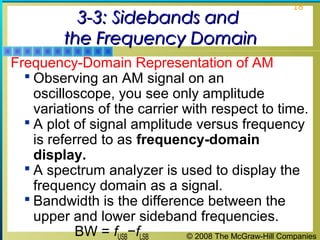
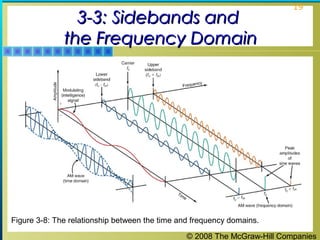
- How AM signals can be represented in both the time and frequency domains.
- The calculation of power in AM signals and how power is distributed between the carrier and sidebands.
- An introduction to single sideband modulation as a more efficient form of AM that eliminates the carrier wave.