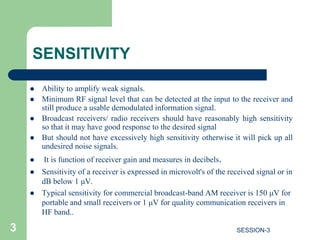
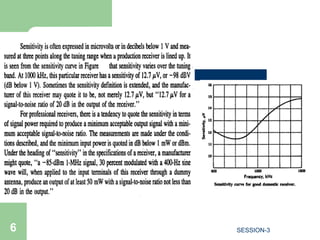
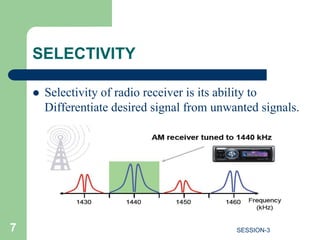
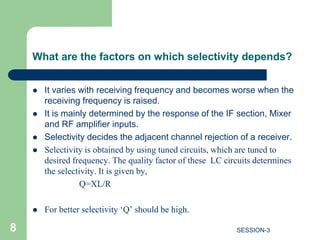
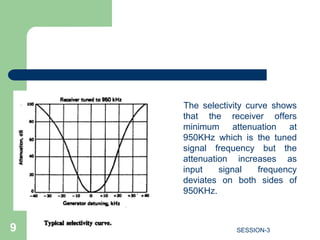
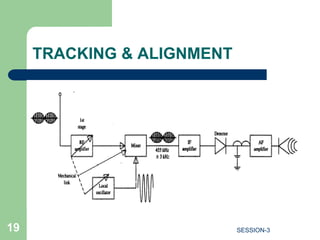
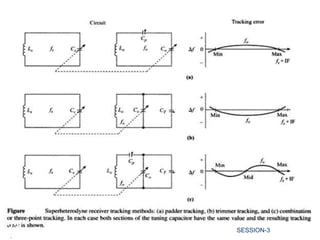
RECEIVERS
PRESENTED BY
A.ABHISHEK REDDY
ASSISTANT PROFESSOR, MECS.
Mobile No.:8121444996
1 SESSION-3
CHARACTERISTICS OF RADIO RECEIVERS
 Sensitivity
 Selectivity
 Fidelity
 Noise Figure
 Image frequency & rejection
 Double spotting
 Tracking and alignment
2 SESSION-3
SENSITIVITY
 Ability to amplify weak signals.
 Minimum RF signal level that can be detected at the input to the receiver and
still produce a usable demodulated information signal.
 Broadcast receivers/ radio receivers should have reasonably high sensitivity
so that it may have good response to the desired signal
 But should not have excessively high sensitivity otherwise it will pick up all
undesired noise signals.
 It is function of receiver gain and measures in decibels.
 Sensitivity of a receiver is expressed in microvolt's of the received signal or in
dB below 1 μV.
 Typical sensitivity for commercial broadcast-band AM receiver is 150 μV for
portable and small receivers or 1 μV for quality communication receivers in
HF band..
3 SESSION-3
 Sensitivity of the receiver depends on :
1. Noise power present at the input to the receiver
2. Receiver noise figure
3. Bandwidth improvement factor of the receiver
4. Gain of RF and IF amplifier stages
 DESENSITIZATION : blocking of received RF signal with adjacent
signal stronger than other cause reduction in the sensitivity to the
desired channel.
 The best way to improve sensitivity is to reduce noise level.
4 SESSION-3
5 SESSION-3
6 SESSION-3
SELECTIVITY
 Selectivity of radio receiver is its ability to
Differentiate desired signal from unwanted signals.
7 SESSION-3
What are the factors on which selectivity depends?
 It varies with receiving frequency and becomes worse when the
receiving frequency is raised.
 It is mainly determined by the response of the IF section, Mixer
and RF amplifier inputs.
 Selectivity decides the adjacent channel rejection of a receiver.
 Selectivity is obtained by using tuned circuits, which are tuned to
desired frequency. The quality factor of these LC circuits determines
the selectivity. It is given by,
Q=XL/R
 For better selectivity ‘Q’ should be high.
8 SESSION-3
The selectivity curve shows
that the receiver offers
minimum attenuation at
950KHz which is the tuned
signal frequency but the
attenuation increases as
input signal frequency
deviates on both sides of
950KHz.
9 SESSION-3
FIDELITY
 Fidelity is defined as – a measure of the ability of a communication system to
produce an exact replica of the original source information at the output of the
receiver.
 Any variations in the demodulated signal that are not in the original information
signal is considered as distortion.
 Radio receiver should have high fidelity or accuracy.
 Example- In an A.M. broadcast the maximum audio frequency is 5 KHz hence
receiver with good fidelity must produce entire frequency up to 5KHz.
10 SESSION-3
NOISE FIGURE
 Ratio of SNR of the input signal to the SNR of the output.
 AM broadcast receivers generally have NF of about 5 to 10dB.
 It determines the smallest signal power that it can receive without
making the output signal get drowned in noise.
NF=
11 SESSION-3
IMAGE FREQUENCY
 In radio reception using heterodyning in the tuning process, an
undesired input frequency that is capable of producing the same
intermediate frequency (IF) that the desired input frequency produces.
 Image frequency – any frequency other than the selected radio
frequency carrier that will produce a cross-product frequency that is
equal to the intermediate frequency if allowed to enter a receiver and
mix with the local oscillator.
 It is given by signal frequency plus twice the intermediate frequency
fsi = fs + 2fi
12 SESSION-3
 It is equivalent to a second radio frequency that will produce an IF that will
interfere with the IF from the desired radio frequency.
– if the selected RF carrier and its image frequency enter a receiver at a
same time, they both mix with the local oscillator frequency and produce
different frequencies that are equal to the IF.
– Consequently, two different stations are received and demodulated
simultaneously
– The higher the IF, the farther away the image frequency is from the
desired radio frequency. Therefore, for better image frequency rejection,
a high IF is preferred.
– However, the higher the IF, it is more difficult to build a stable amplifier
with high gain. i.e. there is a trade-off when selecting the IF for a radio
receiver (image frequency rejection vs IF gain and stability)
13 SESSION-3
14 SESSION-3
MATHEMATICAL ANALYSIS
 Basic principle with two frequencies component f1 and f2,we have harmonics
f1,f2,f1+f2,f1-f2
 In case of radio receivers, two frequency components are fo and fs
 So harmonic we have fo, fs, fo+fs,fo-fs
 Let Undesired frequency fsi(=fo+fif) able to reach at the mixer
 So now two frequency components will be fo (local oscillator) and fsi
(undesired freq)
 And harmonics will be fo,fsi,fo+fsi,fo-fsi
 Substituting value of fsi we have
 fo,fo+fs,2fo+fif,fif
 It was observed that difference component is a mirror image of IF
– Consequently, 2 different stations are received and demodulated
simultaneously
15 SESSION-3
Once an image frequency has down-converted to IF, it cannot be removed. In
order to reject the image frequency, it has to be blocked prior to the mixer stage. i.e.
the bandwidth of the pre-selector must be sufficiently narrow to prevent image
frequency from entering the receiver.
16 SESSION-3
IMAGE FREQUENCY REJECTIO RATIO
 The rejection of an image frequency signal by a single tuned
circuit may be defined as the ratio of gain at the signal
frequency to the gain at the image frequency and is given by
2 2
1
si s
s si
Q
where
f f
f f
Q qualityfactorinloadedcondition
 

 
 

17 SESSION-3
DOUBLE SPOTTING
 Same radio station being heard at two
different points on the AM receiver dial.
 The main cause of double spotting is poor
front end selectivity
 It can be used to calculate IF of an unknown
receiver.
 If IFRR is improved the DS will reduce.
18 SESSION-3
TRACKING & ALIGNMENT
19 SESSION-3
 In SHR the tuning capacitors of the RF amplifier and LO are ganged
together to have only one tuning control for the receiver.
 The LO frequency is tuned to pre-determined value frequency called IF
frequency at all times.
 The process of tuning the LO to produce a predetermined frequency
for each station throughout the AM band is called TRACKING.
 To produce a fixed value always LO frequency is chosen higher than
the signal frequency.
The plates of the variable capacitors of the LO section is
made smaller than that of RF .
20 SESSION-3
 The minimum and maximum value of capacitance in each section is
about 50pf and 500pf and the inductance is smaller than RF.
 This is achieved simply mechanically linked ganged capacitors-having
3 capacitors for RF, mixer and LO.
 In addition to this a small variable capacitance called PADDER and
TRIMMER is also present.
PADDER--capacitances connected in series with the inductor
tank circuit for proper adjustments at lower frequency.
TRIMMENR--capacitances connected in parallel with each
section for proper operation at higher frequency.
21 SESSION-3
 Difference between the LO frequency and receiver tuning
frequency will not differ exactly by the IF we say there is small
“tracking error”.
 Tracking error can be adjusted by means of
 In 3-point tracking,
 trimmer capacitance determines the higher end cross over
point
 padder capacitance determines the lower end cross over
point
 inductance Lo determines the middle range crossover point.
p T
c orc
22 SESSION-3
23 SESSION-3
PROCEDURE TO FIND CAPACITORS VALUES
Step:1 Find the minimum and maximum
frequencies and the required oscillator
capacitance.
Oscillator capacitance ratio is given as
min min
max max
o s
o s
f f IF
f f IF
 
 
2
max max
min min
o o
o o
C f
C f
 
  
 
24 SESSION-3
 Step:2 calculate the capacitance ratio of the
signal tuning.
25 SESSION-3
2
max max
min min
s s
s s
C f
C f
 
  
 
 Step:3 calculate the oscillator tuning
capacitance
SESSION-3
26
*
s p
o
s p
C C
C
C C


 Step:4 calculate the value of padder
capacitance
SESSION-3
27
max
max
min min
s p
o
o s p
C inserieswithC
C
C C inserieswithC

max min
max
min min max
( )
( )
s s p
o
o s s p
C C C
C
C C C C



 Step:5 obtain the oscillator coil value
SESSION-3
28
2 2
min max max min
1 1
( )
(2 ) * (2 ) *
o
o o
L or
f C f C
 

NOTE:
1. To calculate the value of trimmer
capacitance in step3
2. For 3-point tracking , two equations in terms
of must be set up.
SESSION-3
29
o s T
C C C
 
p T
C andC
CHOICE OF IF
 If the IF is too high ,poor selectivity and poor adjacent channel
rejection .
 A high value of IF increases tracking difficulties.
 If IF is lowered , image frequency rejection becomes poorer
 A very low IF can make the selectivity too sharp , cutting of side
bands(Q is low).
 IF value should not fall within tuning range of receiver, or else
instability will occur and heterodyne whistles will be heard,
making it impossible to tune to the frequency band immediately
adjacent to the intermediate frequency.
 If IF is low the frequency stability of LO must be made higher
Bcz any frequency drift is larger proportion of low IF than that of
high IF. SESSION-3
30
Standard IF values
 Standard AM receivers tuning from 540 to 1650 KHz or 6 to 18
MHz use IF within 438-to-465 KHz among 455KHz is popular.
 AM,SSB and other receivers for shortwave or VHF have first IF
of 1.6 to 2.3MHz.
 FM receivers using in 88 to 108 MHz have an IF of 10.7MHz.
 Television receivers in the VHF band(54 to 223MHz) and in
UHF band(470 to 940MHz) us an IF between 26 and 46 MHz
with approximately 36 and 46 MHz are two popular values .
 Microwave and radar receivers operating in 1 to 10GHz use an
IF of 30,60 and 70MHz depending upon application.
SESSION-3
31
THANK U
SESSION-3
32

Radio receiver characteristics

  • 1.
    RECEIVERS PRESENTED BY A.ABHISHEK REDDY ASSISTANTPROFESSOR, MECS. Mobile No.:8121444996 1 SESSION-3
  • 2.
    CHARACTERISTICS OF RADIORECEIVERS  Sensitivity  Selectivity  Fidelity  Noise Figure  Image frequency & rejection  Double spotting  Tracking and alignment 2 SESSION-3
  • 3.
    SENSITIVITY  Ability toamplify weak signals.  Minimum RF signal level that can be detected at the input to the receiver and still produce a usable demodulated information signal.  Broadcast receivers/ radio receivers should have reasonably high sensitivity so that it may have good response to the desired signal  But should not have excessively high sensitivity otherwise it will pick up all undesired noise signals.  It is function of receiver gain and measures in decibels.  Sensitivity of a receiver is expressed in microvolt's of the received signal or in dB below 1 μV.  Typical sensitivity for commercial broadcast-band AM receiver is 150 μV for portable and small receivers or 1 μV for quality communication receivers in HF band.. 3 SESSION-3
  • 4.
     Sensitivity ofthe receiver depends on : 1. Noise power present at the input to the receiver 2. Receiver noise figure 3. Bandwidth improvement factor of the receiver 4. Gain of RF and IF amplifier stages  DESENSITIZATION : blocking of received RF signal with adjacent signal stronger than other cause reduction in the sensitivity to the desired channel.  The best way to improve sensitivity is to reduce noise level. 4 SESSION-3
  • 5.
  • 6.
  • 7.
    SELECTIVITY  Selectivity ofradio receiver is its ability to Differentiate desired signal from unwanted signals. 7 SESSION-3
  • 8.
    What are thefactors on which selectivity depends?  It varies with receiving frequency and becomes worse when the receiving frequency is raised.  It is mainly determined by the response of the IF section, Mixer and RF amplifier inputs.  Selectivity decides the adjacent channel rejection of a receiver.  Selectivity is obtained by using tuned circuits, which are tuned to desired frequency. The quality factor of these LC circuits determines the selectivity. It is given by, Q=XL/R  For better selectivity ‘Q’ should be high. 8 SESSION-3
  • 9.
    The selectivity curveshows that the receiver offers minimum attenuation at 950KHz which is the tuned signal frequency but the attenuation increases as input signal frequency deviates on both sides of 950KHz. 9 SESSION-3
  • 10.
    FIDELITY  Fidelity isdefined as – a measure of the ability of a communication system to produce an exact replica of the original source information at the output of the receiver.  Any variations in the demodulated signal that are not in the original information signal is considered as distortion.  Radio receiver should have high fidelity or accuracy.  Example- In an A.M. broadcast the maximum audio frequency is 5 KHz hence receiver with good fidelity must produce entire frequency up to 5KHz. 10 SESSION-3
  • 11.
    NOISE FIGURE  Ratioof SNR of the input signal to the SNR of the output.  AM broadcast receivers generally have NF of about 5 to 10dB.  It determines the smallest signal power that it can receive without making the output signal get drowned in noise. NF= 11 SESSION-3
  • 12.
    IMAGE FREQUENCY  Inradio reception using heterodyning in the tuning process, an undesired input frequency that is capable of producing the same intermediate frequency (IF) that the desired input frequency produces.  Image frequency – any frequency other than the selected radio frequency carrier that will produce a cross-product frequency that is equal to the intermediate frequency if allowed to enter a receiver and mix with the local oscillator.  It is given by signal frequency plus twice the intermediate frequency fsi = fs + 2fi 12 SESSION-3
  • 13.
     It isequivalent to a second radio frequency that will produce an IF that will interfere with the IF from the desired radio frequency. – if the selected RF carrier and its image frequency enter a receiver at a same time, they both mix with the local oscillator frequency and produce different frequencies that are equal to the IF. – Consequently, two different stations are received and demodulated simultaneously – The higher the IF, the farther away the image frequency is from the desired radio frequency. Therefore, for better image frequency rejection, a high IF is preferred. – However, the higher the IF, it is more difficult to build a stable amplifier with high gain. i.e. there is a trade-off when selecting the IF for a radio receiver (image frequency rejection vs IF gain and stability) 13 SESSION-3
  • 14.
  • 15.
    MATHEMATICAL ANALYSIS  Basicprinciple with two frequencies component f1 and f2,we have harmonics f1,f2,f1+f2,f1-f2  In case of radio receivers, two frequency components are fo and fs  So harmonic we have fo, fs, fo+fs,fo-fs  Let Undesired frequency fsi(=fo+fif) able to reach at the mixer  So now two frequency components will be fo (local oscillator) and fsi (undesired freq)  And harmonics will be fo,fsi,fo+fsi,fo-fsi  Substituting value of fsi we have  fo,fo+fs,2fo+fif,fif  It was observed that difference component is a mirror image of IF – Consequently, 2 different stations are received and demodulated simultaneously 15 SESSION-3
  • 16.
    Once an imagefrequency has down-converted to IF, it cannot be removed. In order to reject the image frequency, it has to be blocked prior to the mixer stage. i.e. the bandwidth of the pre-selector must be sufficiently narrow to prevent image frequency from entering the receiver. 16 SESSION-3
  • 17.
    IMAGE FREQUENCY REJECTIORATIO  The rejection of an image frequency signal by a single tuned circuit may be defined as the ratio of gain at the signal frequency to the gain at the image frequency and is given by 2 2 1 si s s si Q where f f f f Q qualityfactorinloadedcondition         17 SESSION-3
  • 18.
    DOUBLE SPOTTING  Sameradio station being heard at two different points on the AM receiver dial.  The main cause of double spotting is poor front end selectivity  It can be used to calculate IF of an unknown receiver.  If IFRR is improved the DS will reduce. 18 SESSION-3
  • 19.
  • 20.
     In SHRthe tuning capacitors of the RF amplifier and LO are ganged together to have only one tuning control for the receiver.  The LO frequency is tuned to pre-determined value frequency called IF frequency at all times.  The process of tuning the LO to produce a predetermined frequency for each station throughout the AM band is called TRACKING.  To produce a fixed value always LO frequency is chosen higher than the signal frequency. The plates of the variable capacitors of the LO section is made smaller than that of RF . 20 SESSION-3
  • 21.
     The minimumand maximum value of capacitance in each section is about 50pf and 500pf and the inductance is smaller than RF.  This is achieved simply mechanically linked ganged capacitors-having 3 capacitors for RF, mixer and LO.  In addition to this a small variable capacitance called PADDER and TRIMMER is also present. PADDER--capacitances connected in series with the inductor tank circuit for proper adjustments at lower frequency. TRIMMENR--capacitances connected in parallel with each section for proper operation at higher frequency. 21 SESSION-3
  • 22.
     Difference betweenthe LO frequency and receiver tuning frequency will not differ exactly by the IF we say there is small “tracking error”.  Tracking error can be adjusted by means of  In 3-point tracking,  trimmer capacitance determines the higher end cross over point  padder capacitance determines the lower end cross over point  inductance Lo determines the middle range crossover point. p T c orc 22 SESSION-3
  • 23.
  • 24.
    PROCEDURE TO FINDCAPACITORS VALUES Step:1 Find the minimum and maximum frequencies and the required oscillator capacitance. Oscillator capacitance ratio is given as min min max max o s o s f f IF f f IF     2 max max min min o o o o C f C f        24 SESSION-3
  • 25.
     Step:2 calculatethe capacitance ratio of the signal tuning. 25 SESSION-3 2 max max min min s s s s C f C f       
  • 26.
     Step:3 calculatethe oscillator tuning capacitance SESSION-3 26 * s p o s p C C C C C  
  • 27.
     Step:4 calculatethe value of padder capacitance SESSION-3 27 max max min min s p o o s p C inserieswithC C C C inserieswithC  max min max min min max ( ) ( ) s s p o o s s p C C C C C C C C   
  • 28.
     Step:5 obtainthe oscillator coil value SESSION-3 28 2 2 min max max min 1 1 ( ) (2 ) * (2 ) * o o o L or f C f C   
  • 29.
    NOTE: 1. To calculatethe value of trimmer capacitance in step3 2. For 3-point tracking , two equations in terms of must be set up. SESSION-3 29 o s T C C C   p T C andC
  • 30.
    CHOICE OF IF If the IF is too high ,poor selectivity and poor adjacent channel rejection .  A high value of IF increases tracking difficulties.  If IF is lowered , image frequency rejection becomes poorer  A very low IF can make the selectivity too sharp , cutting of side bands(Q is low).  IF value should not fall within tuning range of receiver, or else instability will occur and heterodyne whistles will be heard, making it impossible to tune to the frequency band immediately adjacent to the intermediate frequency.  If IF is low the frequency stability of LO must be made higher Bcz any frequency drift is larger proportion of low IF than that of high IF. SESSION-3 30
  • 31.
    Standard IF values Standard AM receivers tuning from 540 to 1650 KHz or 6 to 18 MHz use IF within 438-to-465 KHz among 455KHz is popular.  AM,SSB and other receivers for shortwave or VHF have first IF of 1.6 to 2.3MHz.  FM receivers using in 88 to 108 MHz have an IF of 10.7MHz.  Television receivers in the VHF band(54 to 223MHz) and in UHF band(470 to 940MHz) us an IF between 26 and 46 MHz with approximately 36 and 46 MHz are two popular values .  Microwave and radar receivers operating in 1 to 10GHz use an IF of 30,60 and 70MHz depending upon application. SESSION-3 31
  • 32.