 Measures of central tendency are statistical 
measures which describe the position of a 
distribution. 
 They are also called statistics of location, and are 
the complement of statistics of dispersion, which 
provide information concerning the variance or 
distribution of observations. 
 In the univariate context, the mean, median and 
mode are the most commonly used measures of 
central tendency. 
 computable values on a distribution that discuss 
the behavior of the center of a distribution.
The value or the figure which represents the whole 
series is neither the lowest value in the series nor the 
highest it lies somewhere between these two extremes. 
1. The average represents all the measurements made on 
a group, and gives a concise description of the group 
as a whole. 
2. When two are more groups are measured, the central 
tendency provides the basis of comparison between 
them.
Simpson and Kafka defined it as “ A measure of 
central tendency is a typical value around which other 
figures congregate” 
Waugh has expressed “An average stand for the whole 
group of which it forms a part yet represents the whole”.
Arithmetic mean is a mathematical 
average and it is the most popular 
measures of central tendency. It is 
frequently referred to as ‘mean’ it is obtained by 
dividing sum of the values of all observations in 
a series (ƩX) by the number of items (N) 
constituting the series. 
Thus, mean of a set of numbers X1, X2, 
X3,………..Xn denoted by x̅ 
and is defined as
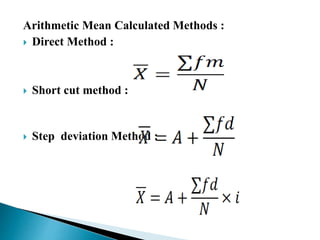
Arithmetic Mean Calculated Methods : 
 Direct Method : 
 Short cut method : 
 Step deviation Method :
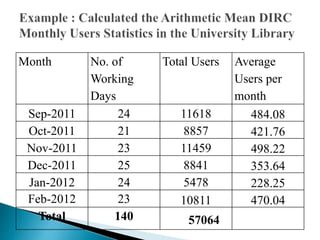
Month No. of 
Working 
Days 
Total Users Average 
Users per 
month 
Sep-2011 24 11618 484.08 
Oct-2011 21 8857 421.76 
Nov-2011 23 11459 498.22 
Dec-2011 25 8841 353.64 
Jan-2012 24 5478 228.25 
Feb-2012 23 10811 470.04 
Total 140 57064
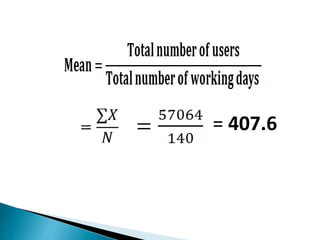
= 407.6
• It is easy to understand & simple 
calculate. 
• It is based on all the values. 
• It is rigidly defined . 
• It is easy to understand the arithmetic 
average even if some of the details of the 
data are lacking. 
• It is not based on the position in the 
series.
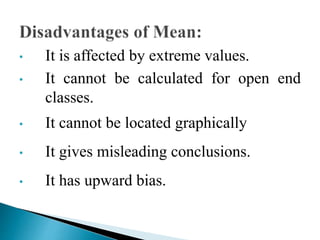
• It is affected by extreme values. 
• It cannot be calculated for open end 
classes. 
• It cannot be located graphically 
• It gives misleading conclusions. 
• It has upward bias.
Median is a central value of the distribution, or the 
value which divides the distribution in equal parts, each 
part containing equal number of items. Thus it is the 
central value of the variable, when the values are arranged 
in order of magnitude. 
Connor has defined as “ The median is that value of the 
variable which divides the group into two equal parts, one 
part comprising of all values greater, and the other, all 
values less than median”
Calculation of Median –Discrete series : 
i. Arrange the data in ascending or descending order. 
ii. Calculate the cumulative frequencies. 
iii. Apply the formula.
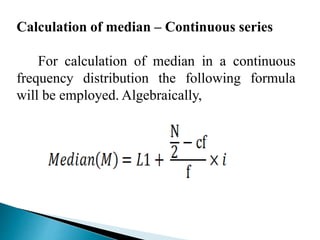
Calculation of median – Continuous series 
For calculation of median in a continuous 
frequency distribution the following formula 
will be employed. Algebraically,
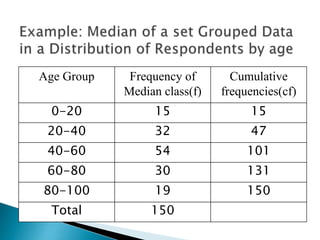
Age Group Frequency of 
Median class(f) 
Cumulative 
frequencies(cf) 
0-20 15 15 
20-40 32 47 
40-60 54 101 
60-80 30 131 
80-100 19 150 
Total 150
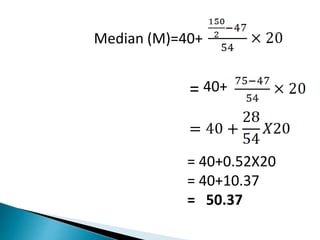
Median (M)=40+ 
= 40+ 
= 40+0.52X20 
= 40+10.37 
= 50.37
Advantages of Median: 
• Median can be calculated in all distributions. 
• Median can be understood even by common people. 
• Median can be ascertained even with the extreme items. 
• It can be located graphically 
• It is most useful dealing with qualitative data
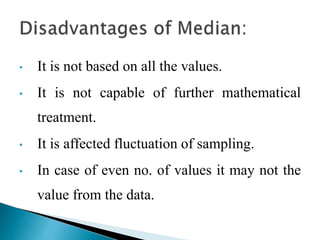
• It is not based on all the values. 
• It is not capable of further mathematical 
treatment. 
• It is affected fluctuation of sampling. 
• In case of even no. of values it may not the 
value from the data.
 Mode is the most frequent value or score 
in the distribution. 
 It is defined as that value of the item in 
a series. 
 It is denoted by the capital letter Z. 
 highest point of the frequencies 
distribution curve.
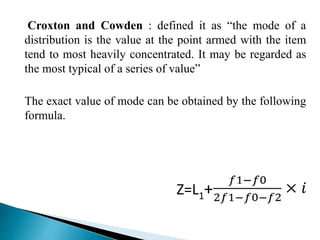
Croxton and Cowden : defined it as “the mode of a 
distribution is the value at the point armed with the item 
tend to most heavily concentrated. It may be regarded as 
the most typical of a series of value” 
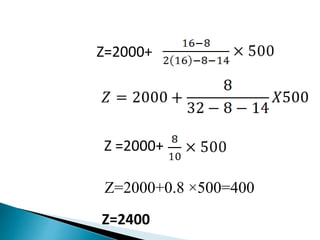
The exact value of mode can be obtained by the following 
formula. 
Z=L1+
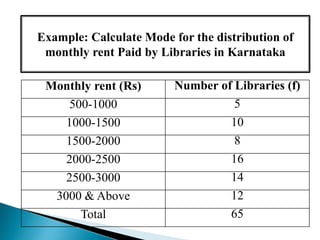
Example: Calculate Mode for the distribution of 
monthly rent Paid by Libraries in Karnataka 
Monthly rent (Rs) Number of Libraries (f) 
500-1000 5 
1000-1500 10 
1500-2000 8 
2000-2500 16 
2500-3000 14 
3000 & Above 12 
Total 65
Z=2000+ 
Z =2000+ 
Z=2000+0.8 ×500=400 
Z=2400
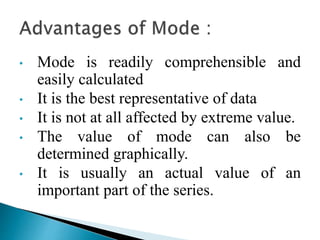
• Mode is readily comprehensible and 
easily calculated 
• It is the best representative of data 
• It is not at all affected by extreme value. 
• The value of mode can also be 
determined graphically. 
• It is usually an actual value of an 
important part of the series.
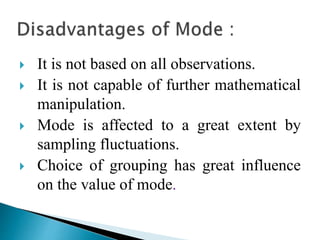
 It is not based on all observations. 
 It is not capable of further mathematical 
manipulation. 
 Mode is affected to a great extent by 
sampling fluctuations. 
 Choice of grouping has great influence 
on the value of mode.
• A measure of central tendency is a 
measure that tells us where the middle of 
a bunch of data lies. 
• Mean is the most common measure of 
central tendency. It is simply the sum of 
the numbers divided by the number of 
numbers in a set of data. This is also 
known as average.
• Median is the number present in the middle 
when the numbers in a set of data are 
arranged in ascending or descending order. If 
the number of numbers in a data set is even, 
then the median is the mean of the two 
middle numbers. 
• Mode is the value that occurs most 
frequently in a set of data.
Thank You 
By 
Reena Esther. B 
14MBT109 
M.Phill (Biotechnology) 
St.Josephs’ College 
Trichy.