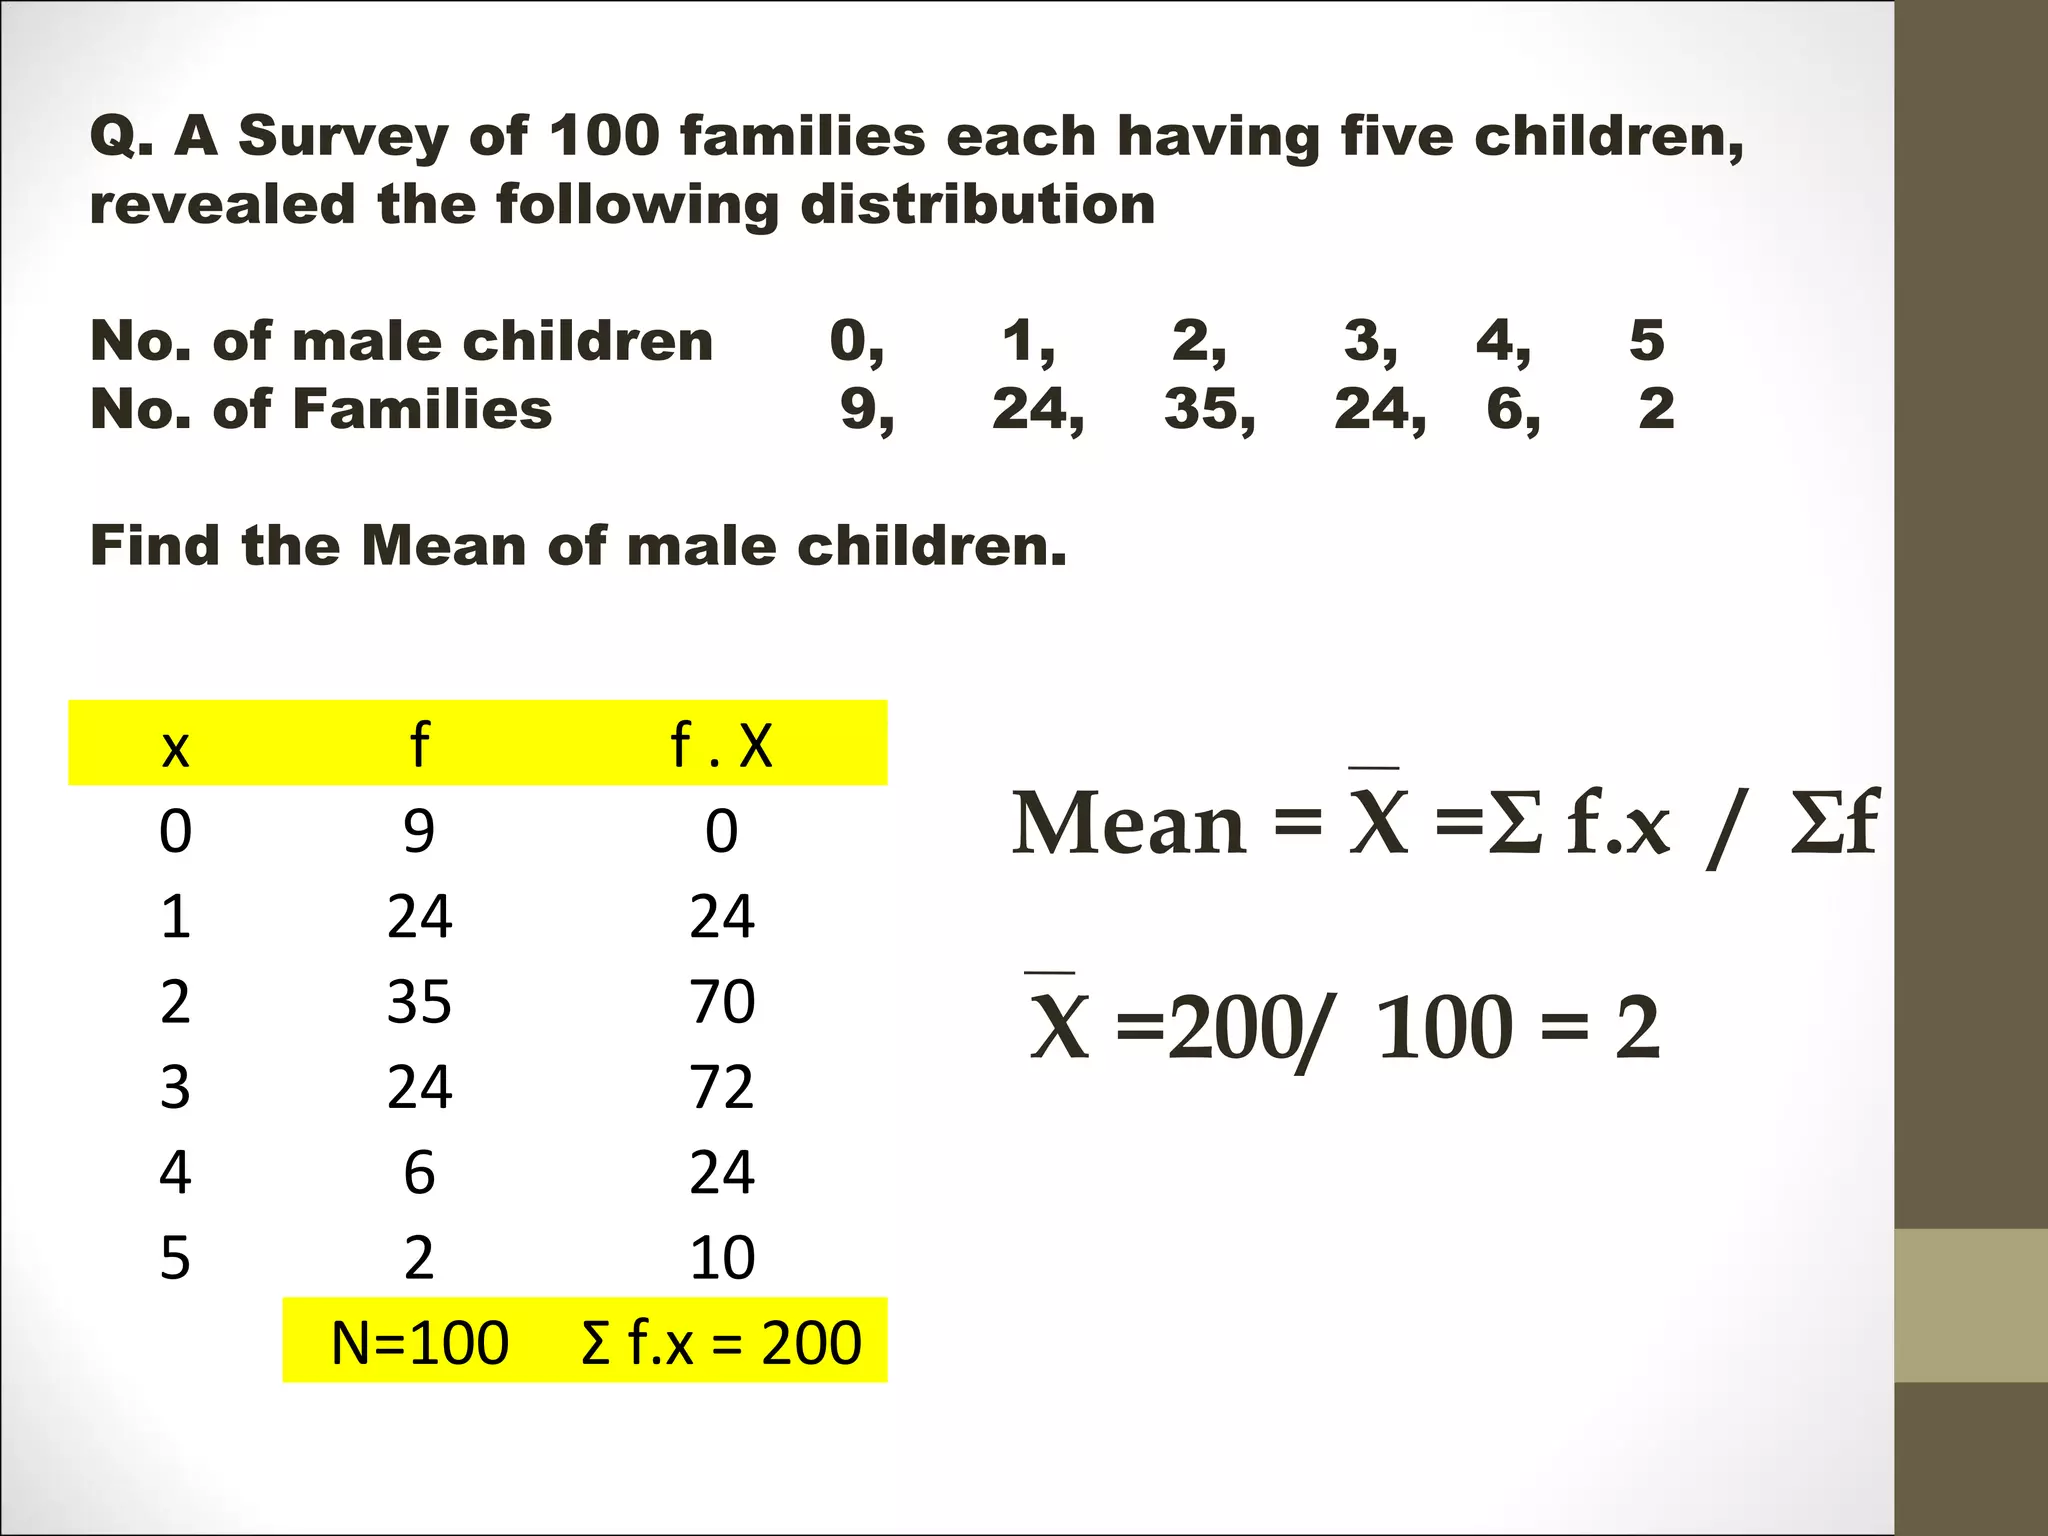
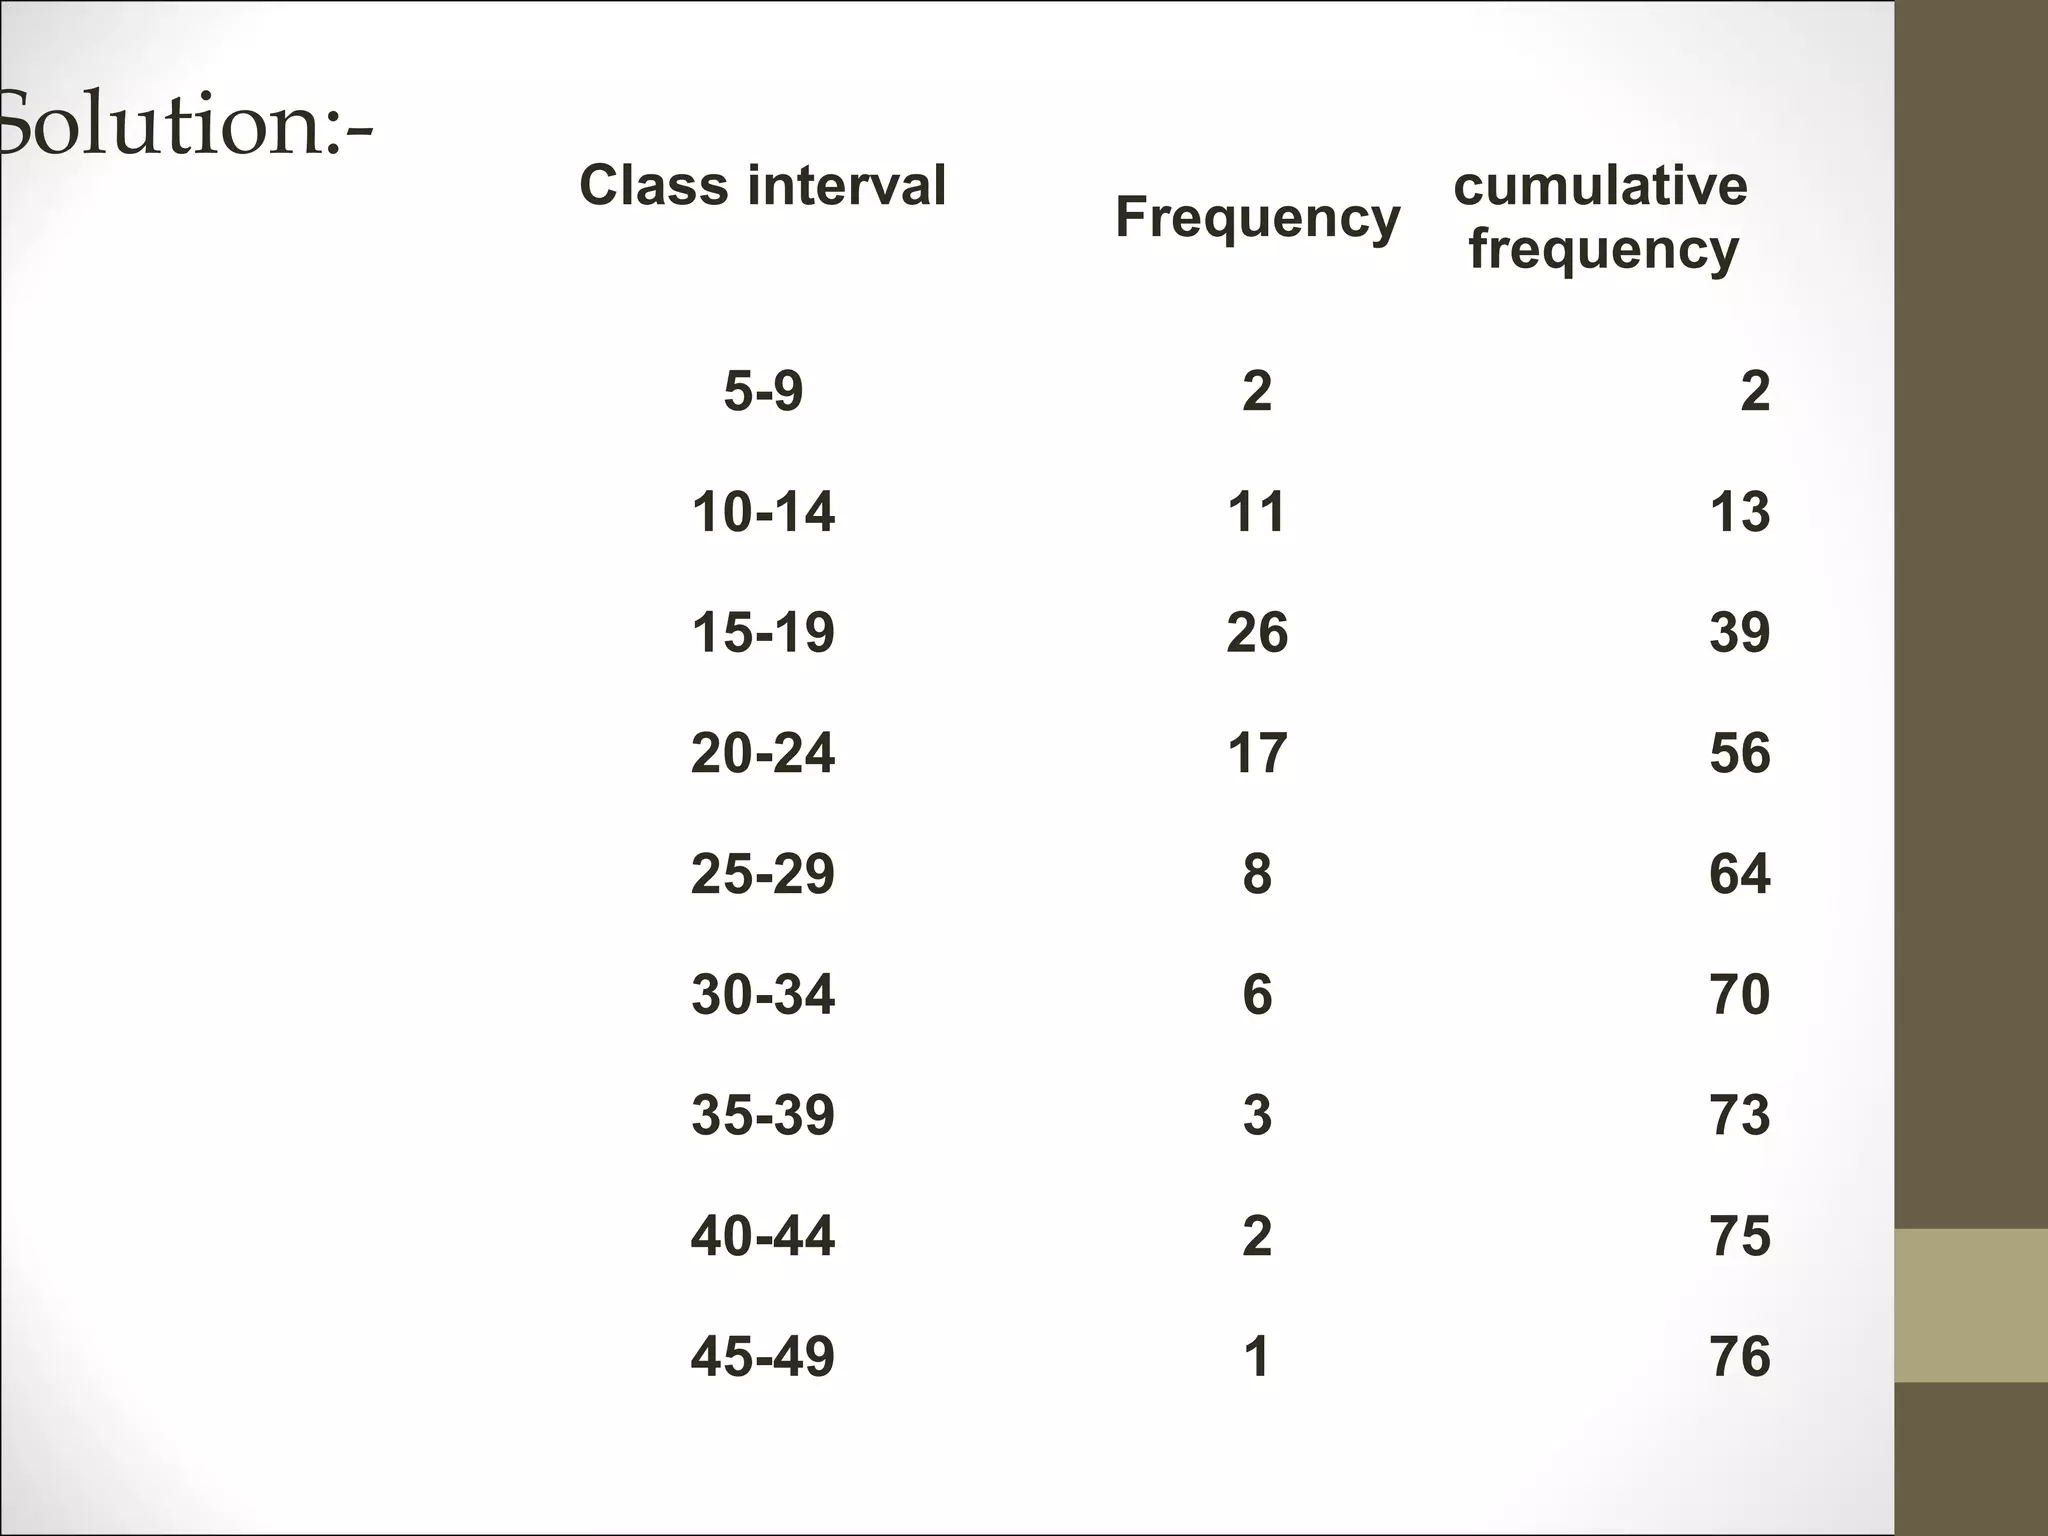
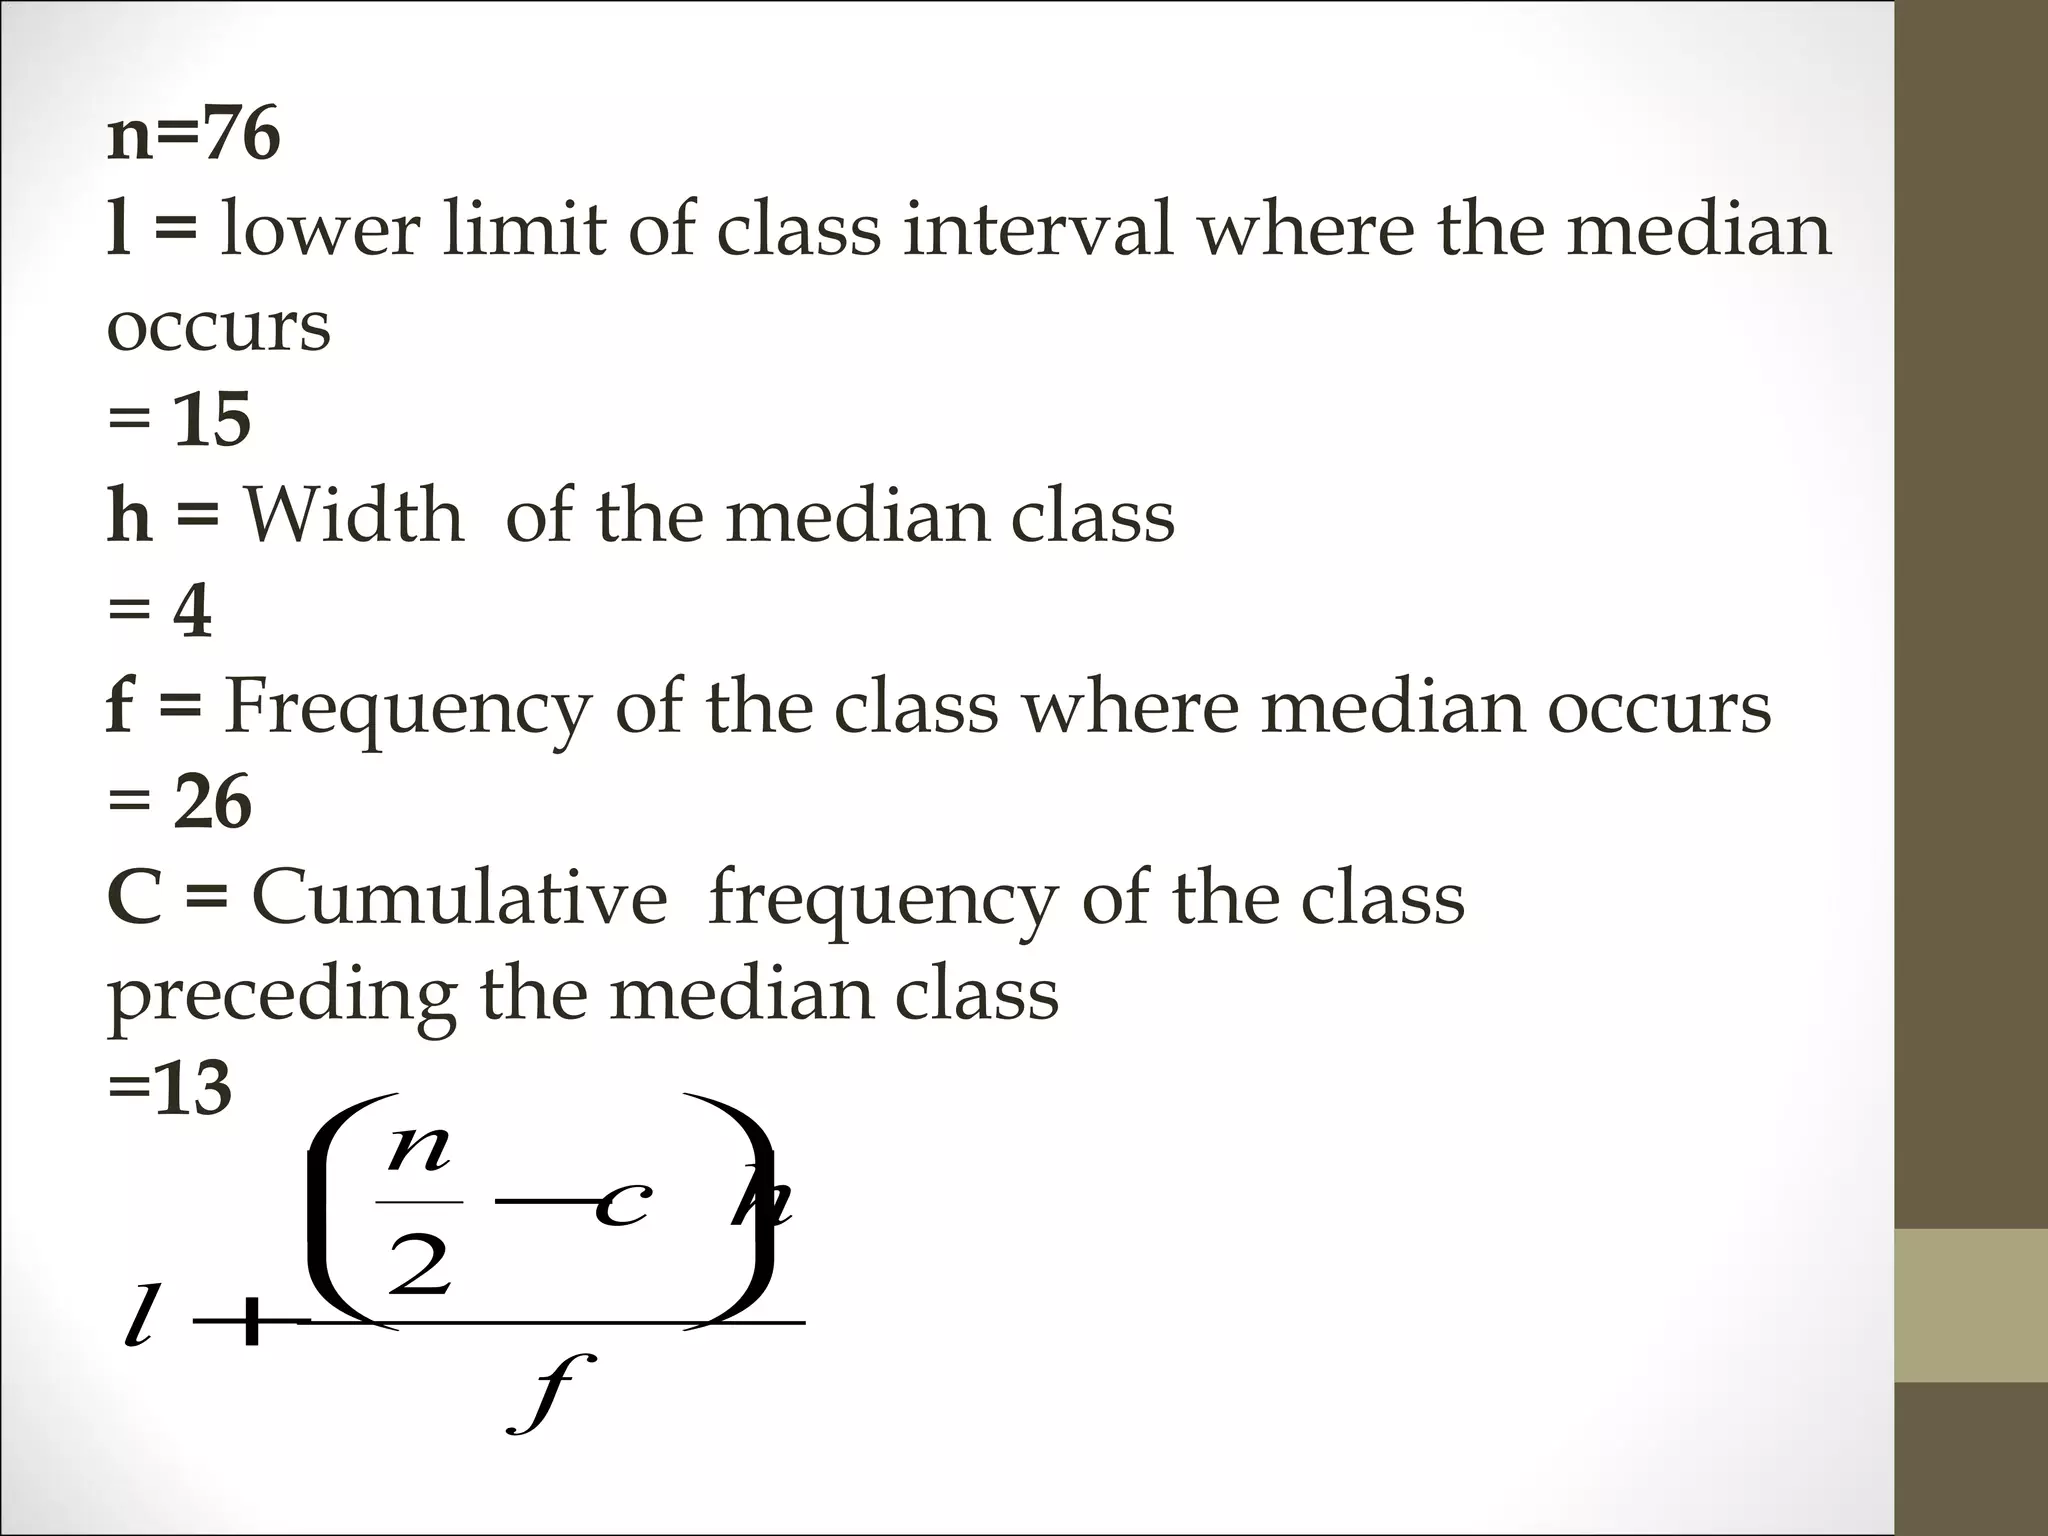
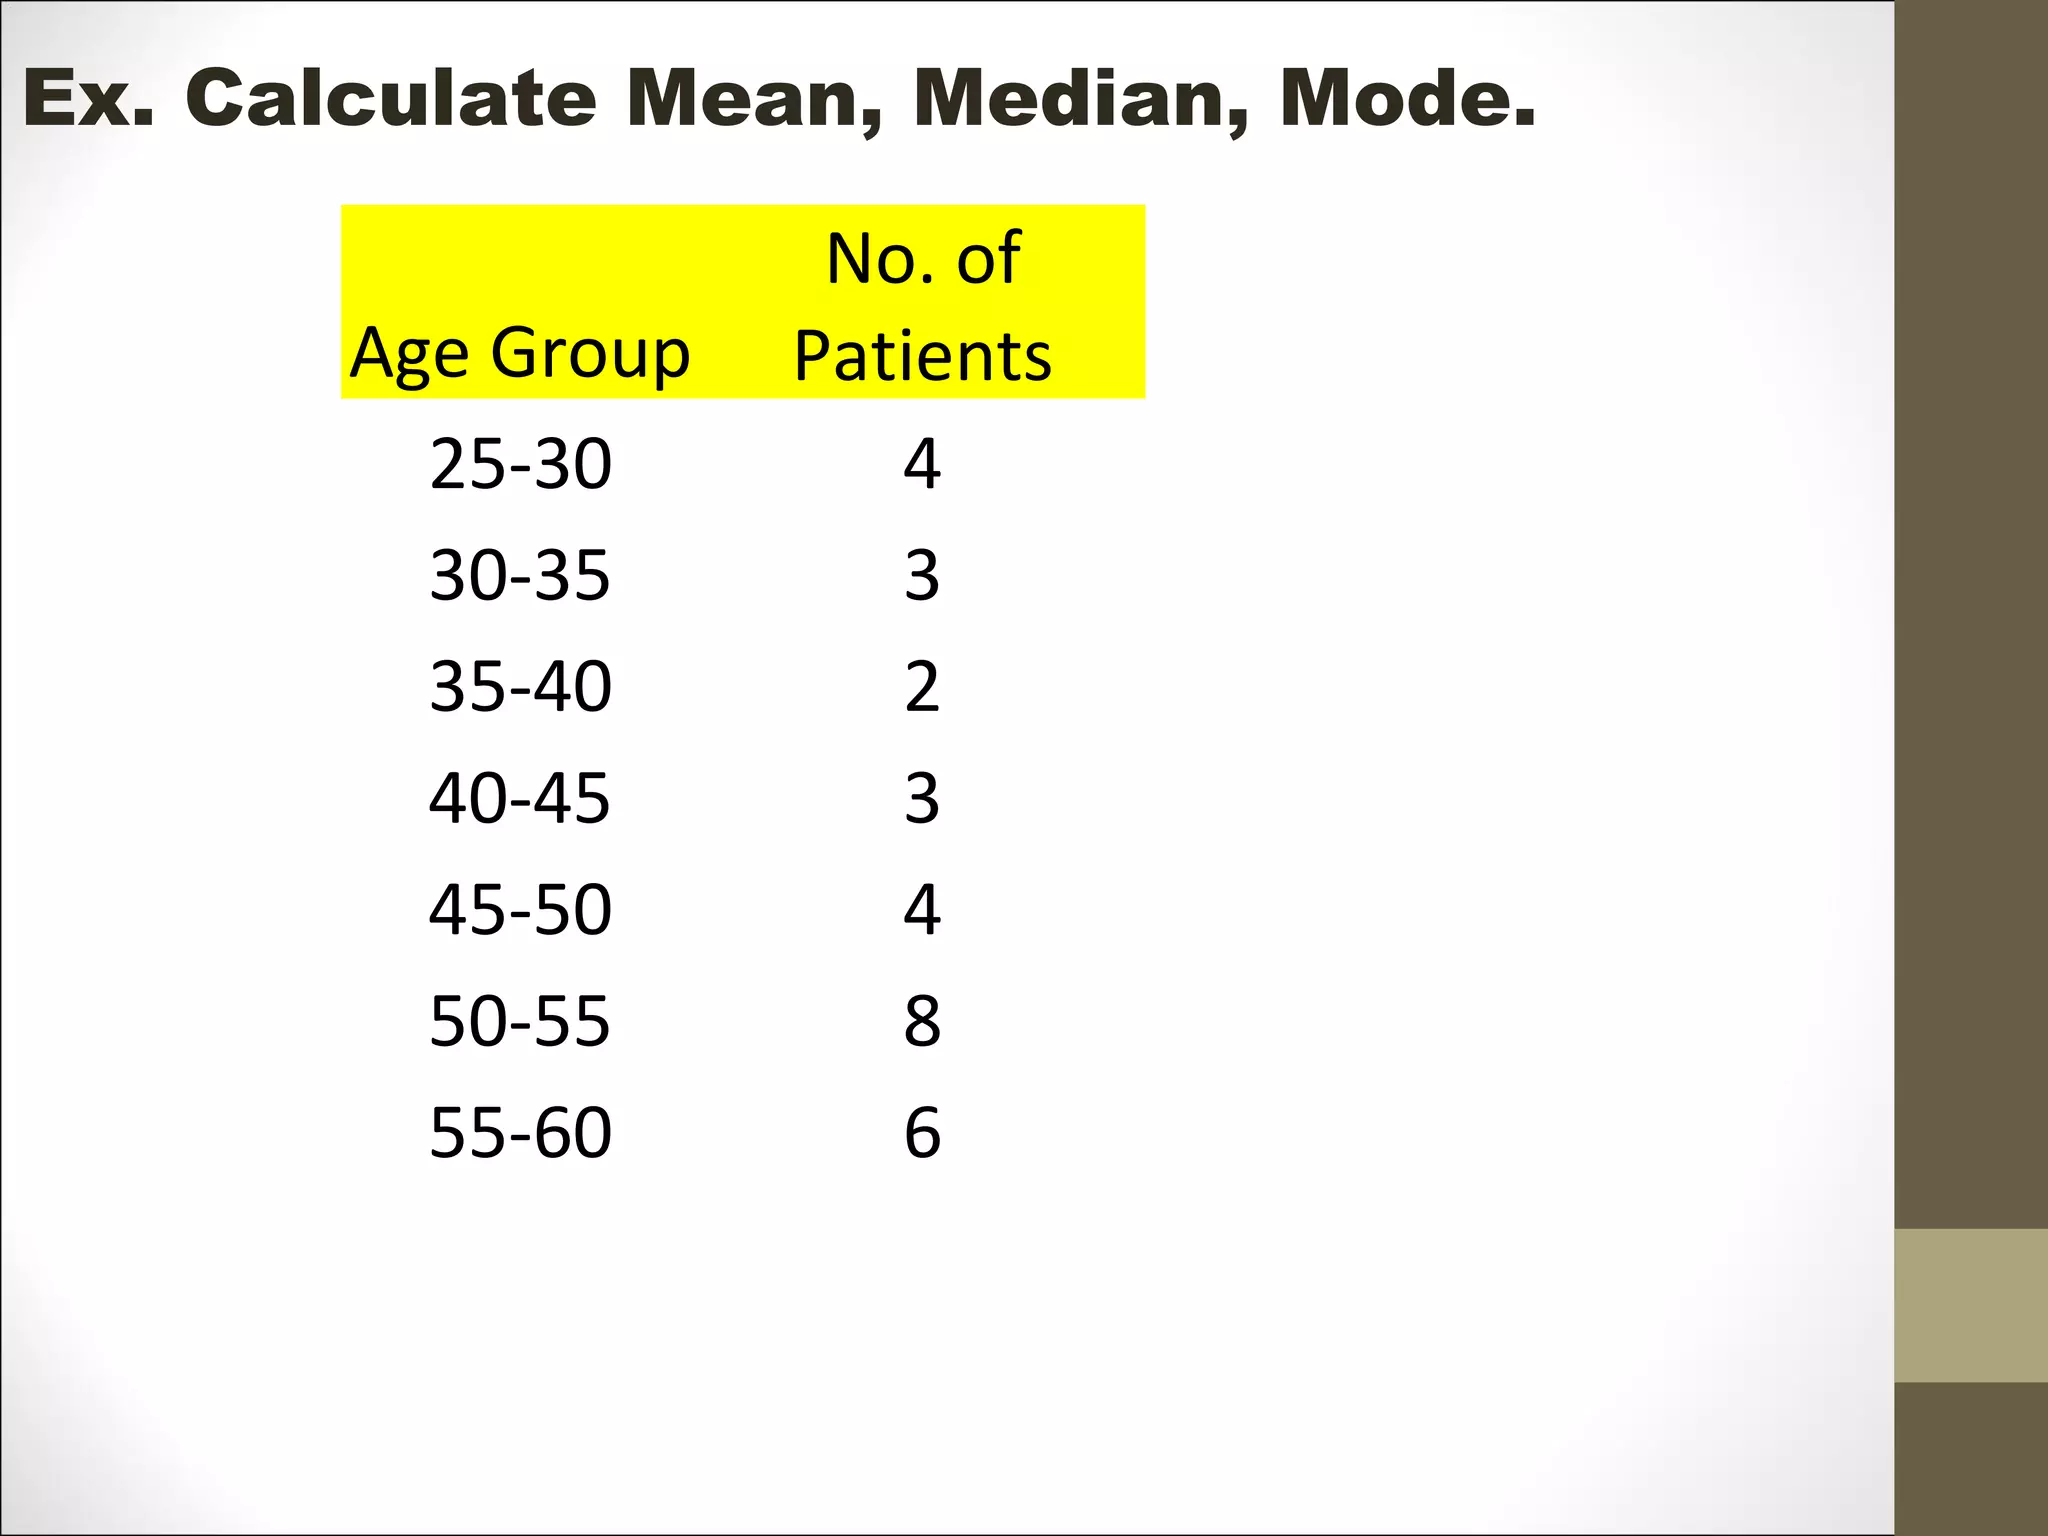
Measures of
Central Tendency
Harshit Jadav
M.S.Pharm, PGDRA
• Measures of central tendency are also usually
called as the averages.
• They give us an idea about the concentration
of the values in the central part of the
distribution.
• The following are the five measures of
central tendency that are in common use:
• (i) Arithmetic mean, (ii) Median, (iii) Mode,
(iv) Geometric mean, and (v) Harmonic mean
(vi) weighted mean
MEASURE OF CENTRAL TENDANCY
MEAN
MEDIAN MODE
The average of the data
The middle value of the
data
most commonly
occurring value
Mean (Average)
Mean locate the centre of distribution.
Also known as arithmetic mean
Most Common Measure
The mean is simply the sum of the values divided by
the total number of items in the set.
Affected by Extreme Values
XX
XX
nn
XX XX XX
nn
ii
ii
nn
nn
== ==
++ ++ ++==
∑∑
11 11 22 
Merits:
• It is easy to understand and easy to calculate
• It is based upon all the observations
• It is familiar to common man and rigidly
defined
• It is capable of further mathematical
treatment.
• It is affected by sampling fluctuations. Hence
it is more stable.
Demerits
• It cannot be determined by inspection.
• Arithmetic mean cannot be used if we are
dealing with qualitative characteristics,
which cannot be measured quantitatively
like caste, religion, sex.
• Arithmetic mean cannot be obtained if a
single observation is missing or lost
• Arithmetic mean is very much affected by
extreme values.
MEAN
UNGROUPED DATA GROUPED DATA
n
x
n
i
∑=
= 1
ix
n
x
n
i
∑=
= 1
ii xf
MEAN =
nsobservatioofno.total
nsobservatioofSum
Birth weight of new borns are :
3.3, 6.1, 5.8, 3.8, 2.7, 4.1, 3.4, 3.9, 5.1, 3
n
x
n
i
∑=
= 1
ix =41.2/10
=4.12 kg
Q. A Survey of 100 families each having five children,
revealed the following distribution
No. of male children 0, 1, 2, 3, 4, 5
No. of Families 9, 24, 35, 24, 6, 2
Find the Mean of male children.
x f f . X
0 9 0
1 24 24
2 35 70
3 24 72
4 6 24
5 2 10
N=100 Σ f.x = 200
Mean = X =Σ f.x / Σf
X =200/ 100 = 2
Find mean days of confinement after
delivery in the following series:-
Day of
confinement
No. of
patients
6 5
7 4
8 4
9 3
10 2
Day of
confinement
(x)
No. of
patients
(f)
X*f
6 5 30
7 4 28
8 4 32
9 3 27
10 2 20
Total 18 137
Solution:-
n
x
n
i
∑=
= 1
ii xf =137/18
=7.61
Median
1.Measure of Central Tendency.
2. The median is determined by sorting the data set
from lowest to highest values and taking the data
point in the middle of the sequence.
3.Middle Value In Ordered Sequence
• If Odd n, Middle Value of Sequence
• If Even n, Average of 2 Middle Value
4.Not Affected by Extreme Values
Merits:
• It is rigidly defined
• It is easy to understand and easy to
calculate.
• It is not at all affected by extreme values.
• It can be calculated for distributions with
open-end classes.
• Median is the only average to be used
while dealing with qualitative data.
• Can be determined graphically.
Demerits:
• In case of even number of observations
median cannot be determined exactly.
• It is not based on all the observations.
• It is not capable of further mathematical
treatment
For ungrouped data:-
Step-1
Arranged data in ascending or descending order.
Step:-2
If total no. of observations ‘n’ is odd then used the
following formula for median
Step:-3
If total no. of observations ‘n’ is even then used
the following formula for
median = arithmetic mean of two middle
observations.
.
2
1
nobservatioth
n +
=
Median
If X1, X2, X3,... …. ,Xn are n observations
arranged in ascending order of magnitude.
X(n+1)/2 if n is odd
Median = {
Xn/2 + X(n/2)+1 if n is even
------------------
2
Calculate the median for the following
series :-
2,3,5,1,4,5,8
1,2,3,4,5,5,8.
Median .
2
1
nobservatioth
n +
=
= 7+1/2
=4th
number
74+75
Median = ---------- = 74.5
2
The data on pulse rate per minute of 10 healthy
individuals are 82, 79, 60, 76, 63,81, 68, 74, 60, 75.
n= 10
60, 60, 63, 68, 74,75, 76, 79, 81, 82
Xn/2 + X(n/2)+1 / 2
Find out the median for number of
sports injuries happened in cricket in all teams
37, 57, 65, 46, 12, 14, 19, 23, 56, 78, 5, 33
Median:-
f
hc
n
l






−
+
2
l = lower limit of class interval where the
median occurs
f = Frequency of the class where median occurs
h = Width of the median class
C= Cumulative frequency of the class
preceding the median class (PCF)
For Grouped data:-
Weight of infant in kg No of infants
2.0-2.5 37
2.5-3.0 117
3.0-3.5 207
3.5-4.0 155
4.0-4.5 48
4.5 and above 26
Find the median weight of 590 infants born in a
hospital in one year from the following table.
Weight of infants in
kg
No of infants Cumulative frequency
2.0-2.5 37 37
2.5-3.0 117 37+117=154
3.0-3.5 207 154+207=361
3.5-4.0 155 361+155=516
4.0-4.5 48 516+48=564
4.5 and above 26 564+26=590
N/2 =590/2 =295
Median Class = 3.0-3.5, so L=3.0, f= 207
Cf = 154 h=0.5
f
hc
n
l






−
+
2
= 3.0 + (295-154) * 0.5
207
= 3.0 + 0.34
= 3.34 Median Weight
For grouped Data:-
Class interval Frequency
5-9 2
10-14 11
15-19 26
20-24 17
25-29 8
30-34 6
35-39 3
40-44 2
45-49 1
Calculate the median for the following data
series:-
Solution:-
Class interval
Frequency
cumulative
frequency
5-9 2 2
10-14 11 13
15-19 26 39
20-24 17 56
25-29 8 64
30-34 6 70
35-39 3 73
40-44 2 75
45-49 1 76
n=76
l = lower limit of class interval where the median
occurs
= 15
h = Width of the median class
= 4
f = Frequency of the class where median occurs
= 26
C = Cumulative frequency of the class
preceding the median class
=13
f
hc
n
l






−
+
2
Mode
1.Measure of Central Tendency
2.The mode is the most frequently
occurring value in the data set.
3.May Be No Mode or Several Modes
Merits:
• Mode is readily comprehensible and easy to
calculate.
• Mode is not at all affected by extreme values.
• Mode can be conveniently located even if the
frequency distribution has class intervals of
unequal magnitude
• Open-end classes also do not pose any
problem in the location of mode.
• Mode is the average to be used to find the
ideal size.
Demerits:
• Mode is ill defined.
• It is not based upon all the observations.
• It is not capable of further mathematical
treatment.
• As compared with mean, mode is affected
to a great extent by fluctuations of
sampling.
Mode Example
No Mode
Raw Data: 10.3 4.9 8.9 11.7 6.3 7.7
One Mode
Raw Data: 6.3 4.9 8.9 6.3 4.9 4.9
More Than 1 Mode
Raw Data: 21 28 28 41 43 43
Mode for ungrouped data:-
2,2,3,4,6,7,4,4,4,4,8,9,0 mode is 4
10,10,3,3,4,2,1,6,7 mode is 10 and 3
10,34,23,12,11,3,4 no mode
Mode for Group Data
Fm-F1
Mode = L1 + ------------------ * c
2Fm– F1- F2
Where
•Fm is mode freq.
• F1 is freq. just lower mode class.
•F2 is freq. after mode class.
• L1 is lower limit of mode class
•C is class difference.
C I FREQU. (F)
20 - 30 3
30 - 40 20
40 - 50 27
50 - 60 15
60 - 70 9
Q. Find the Mode for group data
Age group 20-30 30-40 40-50 50-60 60-70
No. of persons 3 20 27 15 9
Q. Find the Mode for group data
Age group 20-30 30-40 40-50 50-60 60-70
No. of persons 3 20 27 15 9
C I FREQU. (F)
20 - 30 3
30 - 40 20
40 - 50 27
50 - 60 15
60 - 70 9
L1
Fm
F1
F2
FFmm -- FF11
Mode = LMode = L11 + ------------------ * c+ ------------------ * c
2F2Fmm – F– F11- F- F22
2727 –– 20 7020 70
Mode = 40 + ------------------ * 10 = 40 + -----Mode = 40 + ------------------ * 10 = 40 + -----
2*272*27 – 20- 15 19– 20- 15 19
Mode = 43.68Mode = 43.68
Calculate the mode for the following
frequency distribution:-
IQ Range Frequency
90-100 11
100-110 27
110-120 36
120-130 38
130-140 43
140-150 28
150-160 16
160-170 1
Modal class by inspection is
130-140
fm= 43
f1= 38
f2= 28
C=10
l = 130
c
fff
ff
l
m
m






−−
−
+
)(2
)(
21
1
=130.6579
Relationship between
Mean, Median and Mode
Mode = 3 Median – 2 Mean
Summary of
Central Tendency Measures
MeasureMeasure DescriptionDescription
MeanMean Balance PointBalance Point
MedianMedian Middle ValueMiddle Value
When OrderedWhen Ordered
ModeMode Most FrequentMost Frequent
Ex. Calculate Mean, Median, Mode.
Age Group
No. of
Patients
25-30 4
30-35 3
35-40 2
40-45 3
45-50 4
50-55 8
55-60 6
Age Group No. of Patients (F) X F*X C.F
25-30 4 27.5 110 4
30-35 3 32.5 97.5 7
35-40 2 37.5 75 9
40-45 3 42.5 127.5 12
45-50 4 47.5 190 16
50-55 8 52.5 420 24
55-60 6 57.5 345 30
30 1365
MEAN =1365/30 = 45.5
MEDIAN =45+ (15-12)*5/4 = 48.75
MODE=50 + [(8-4)*5/(2*8-4-6)]=53.34
Ex. The following table gives the frequency
distribution of marks obtained by 2300 medical
students of Gujarat in MCQ of PSM exam. Find
Mean, Median and Mode.
Marks
No. of
students
11-20 141
21-30 221
31-40 439
41-50 529
51-60 495
61-70 322
71-80 153
Geometric Mean
• Geometric mean is defined as the positive root of the
product of observations. Symbolically,
• It is also often used for a set of numbers whose values are
meant to be multiplied together or are exponential in nature,
such as data on the growth of the human population or
interest rates of a financial investment.
• Find geometric mean of rate of growth: 34, 27, 45, 55, 22, 34
n
nxxxxG /1
321 )( =
Geometric mean of Group
data
• If the “n” non-zero and positive variate-values occur
times, respectively, then the geometric mean of the
set of observations is defined by:
[ ] Nn
i
f
i
Nf
n
ff in
xxxxG
1
1
1
21
21






== ∏=

∑=
=
n
i
ifN
1
Where
nxxx ,........,, 21 nfff ,.......,, 21
Geometric Mean (Revised Eqn.)
)( 321 nxxxxG =








= ∑=
n
i
ixLog
N
AntiLogG
1
1








= ∑=
n
i
ii xLogf
N
AntiLogG
1
1
)( 321
321 n
fff
xxxxG =
Ungroup Data Group Data
What is the geometric mean of 4,8.3,9
and 17?
First, multiply the numbers together
and then take the 5th root (because
there are 5 numbers)
G = (4*8*3*9*17)(1/5)
G = 6.81
Harmonic Mean
• Harmonic mean (formerly sometimes called the
subcontrary mean) is one of several kinds of
average.
• The harmonic mean is a very specific type of
average.
• It’s generally used when dealing with averages of
units, like speed or other rates and ratios.
Harmonic Mean Group Data
• The harmonic mean H of the positive real numbers x1,x2, ..., xn
is defined to be
∑=
= n
i i
i
x
f
n
H
1
∑=
= n
i ix
n
H
1
1
Ungroup Data Group Data
What is the harmonic mean of 1,5,8,10?
Here,
N=4
H = 4 / (1/1) +(1/5) + (1/8) + (1/10)
H = 4/ 1.425
H = 2.80
∑=
= n
i ix
n
H
1
1
Rahul drives a car at 20 mph for the
first hour and 30 mph for the second.
What’s his average speed?
We need the harmonic
mean:
= 2/(1/20 + 1/30)
= 2(0.05 + 0.033)
= 2 / 0.083
= 24.09624 mph.
Weighted Mean
• The Weighted mean of the positive real numbers
x1,x2, ..., xn with their weight w1,w2, ..., wn is defined
to be
∑
∑
=
=
= n
i
i
n
i
ii
w
xw
x
1
1
Σ = the sum of (in other words…add them up!).
w = the weights.
x = the value.
A weighted mean is a kind of average.
Instead of each data point contributing
equally to the final mean, some data points
contribute more “weight” than others.
If all the weights are equal, then the
weighted mean equals the arithmetic mean
(the regular “average” you’re used to).
Weighted means are very common in
statistics, especially when studying
populations.
Steps:
1.Multiply the numbers in your data set
by the weights.
2.Add the numbers in Step 1 up. Set this
number aside for a moment.
3.Add up all of the weights.
4.Divide the numbers you found in Step 2
by the number you found in Step 3.
You take three 100-point exams in your
statistics class and score 80, 80 and 95. The last
exam is much easier than the first two, so your
professor has given it less weight. The weights
for the three exams are:
•Exam 1: 40 % of your grade. (Note: 40% as a
decimal is .4.)
•Exam 2: 40 % of your grade.
•Exam 3: 20 % of your grade
1.Multiply the numbers in your data set
by the weights:
.4(80) = 32
.4(80) = 32
.2(95) = 19
2. Add the numbers up. 32 + 32 + 19 = 83.
3. (0.4+0.4+0.2) = 1
4. 83/1= 83
The arithmetic mean is best used when the sum
of the values is significant. For example, your
grade in your statistics class. If you were to get
85 on the first test, 95 on the second test, and 90
on the third test, your average grade would be
90.
Why don't we use the geometric mean
here?
What about the harmonic mean?  
What if you got a 0 on your first test and
100 on the other two?
The arithmetic mean would give you a
grade of 66.6.
The geometric mean would give you a grade
of 0!!!
The harmonic mean can't even be applied at
all because 1/0 is undefined.  

Measures of Central Tendency - Biostatstics

  • 1.
  • 2.
    • Measures ofcentral tendency are also usually called as the averages. • They give us an idea about the concentration of the values in the central part of the distribution. • The following are the five measures of central tendency that are in common use: • (i) Arithmetic mean, (ii) Median, (iii) Mode, (iv) Geometric mean, and (v) Harmonic mean (vi) weighted mean
  • 3.
    MEASURE OF CENTRALTENDANCY MEAN MEDIAN MODE The average of the data The middle value of the data most commonly occurring value
  • 4.
    Mean (Average) Mean locatethe centre of distribution. Also known as arithmetic mean Most Common Measure The mean is simply the sum of the values divided by the total number of items in the set. Affected by Extreme Values XX XX nn XX XX XX nn ii ii nn nn == == ++ ++ ++== ∑∑ 11 11 22 
  • 5.
    Merits: • It iseasy to understand and easy to calculate • It is based upon all the observations • It is familiar to common man and rigidly defined • It is capable of further mathematical treatment. • It is affected by sampling fluctuations. Hence it is more stable.
  • 6.
    Demerits • It cannotbe determined by inspection. • Arithmetic mean cannot be used if we are dealing with qualitative characteristics, which cannot be measured quantitatively like caste, religion, sex. • Arithmetic mean cannot be obtained if a single observation is missing or lost • Arithmetic mean is very much affected by extreme values.
  • 7.
    MEAN UNGROUPED DATA GROUPEDDATA n x n i ∑= = 1 ix n x n i ∑= = 1 ii xf MEAN = nsobservatioofno.total nsobservatioofSum
  • 8.
    Birth weight ofnew borns are : 3.3, 6.1, 5.8, 3.8, 2.7, 4.1, 3.4, 3.9, 5.1, 3 n x n i ∑= = 1 ix =41.2/10 =4.12 kg
  • 9.
    Q. A Surveyof 100 families each having five children, revealed the following distribution No. of male children 0, 1, 2, 3, 4, 5 No. of Families 9, 24, 35, 24, 6, 2 Find the Mean of male children. x f f . X 0 9 0 1 24 24 2 35 70 3 24 72 4 6 24 5 2 10 N=100 Σ f.x = 200 Mean = X =Σ f.x / Σf X =200/ 100 = 2
  • 10.
    Find mean daysof confinement after delivery in the following series:- Day of confinement No. of patients 6 5 7 4 8 4 9 3 10 2
  • 11.
    Day of confinement (x) No. of patients (f) X*f 65 30 7 4 28 8 4 32 9 3 27 10 2 20 Total 18 137 Solution:- n x n i ∑= = 1 ii xf =137/18 =7.61
  • 12.
    Median 1.Measure of CentralTendency. 2. The median is determined by sorting the data set from lowest to highest values and taking the data point in the middle of the sequence. 3.Middle Value In Ordered Sequence • If Odd n, Middle Value of Sequence • If Even n, Average of 2 Middle Value 4.Not Affected by Extreme Values
  • 13.
    Merits: • It isrigidly defined • It is easy to understand and easy to calculate. • It is not at all affected by extreme values. • It can be calculated for distributions with open-end classes. • Median is the only average to be used while dealing with qualitative data. • Can be determined graphically.
  • 14.
    Demerits: • In caseof even number of observations median cannot be determined exactly. • It is not based on all the observations. • It is not capable of further mathematical treatment
  • 15.
    For ungrouped data:- Step-1 Arrangeddata in ascending or descending order. Step:-2 If total no. of observations ‘n’ is odd then used the following formula for median Step:-3 If total no. of observations ‘n’ is even then used the following formula for median = arithmetic mean of two middle observations. . 2 1 nobservatioth n + =
  • 16.
    Median If X1, X2,X3,... …. ,Xn are n observations arranged in ascending order of magnitude. X(n+1)/2 if n is odd Median = { Xn/2 + X(n/2)+1 if n is even ------------------ 2
  • 17.
    Calculate the medianfor the following series :- 2,3,5,1,4,5,8 1,2,3,4,5,5,8. Median . 2 1 nobservatioth n + = = 7+1/2 =4th number
  • 18.
    74+75 Median = ----------= 74.5 2 The data on pulse rate per minute of 10 healthy individuals are 82, 79, 60, 76, 63,81, 68, 74, 60, 75. n= 10 60, 60, 63, 68, 74,75, 76, 79, 81, 82 Xn/2 + X(n/2)+1 / 2
  • 19.
    Find out themedian for number of sports injuries happened in cricket in all teams 37, 57, 65, 46, 12, 14, 19, 23, 56, 78, 5, 33
  • 20.
    Median:- f hc n l       − + 2 l = lowerlimit of class interval where the median occurs f = Frequency of the class where median occurs h = Width of the median class C= Cumulative frequency of the class preceding the median class (PCF) For Grouped data:-
  • 21.
    Weight of infantin kg No of infants 2.0-2.5 37 2.5-3.0 117 3.0-3.5 207 3.5-4.0 155 4.0-4.5 48 4.5 and above 26 Find the median weight of 590 infants born in a hospital in one year from the following table.
  • 22.
    Weight of infantsin kg No of infants Cumulative frequency 2.0-2.5 37 37 2.5-3.0 117 37+117=154 3.0-3.5 207 154+207=361 3.5-4.0 155 361+155=516 4.0-4.5 48 516+48=564 4.5 and above 26 564+26=590 N/2 =590/2 =295 Median Class = 3.0-3.5, so L=3.0, f= 207 Cf = 154 h=0.5
  • 23.
    f hc n l       − + 2 = 3.0 +(295-154) * 0.5 207 = 3.0 + 0.34 = 3.34 Median Weight
  • 24.
    For grouped Data:- Classinterval Frequency 5-9 2 10-14 11 15-19 26 20-24 17 25-29 8 30-34 6 35-39 3 40-44 2 45-49 1 Calculate the median for the following data series:-
  • 25.
    Solution:- Class interval Frequency cumulative frequency 5-9 22 10-14 11 13 15-19 26 39 20-24 17 56 25-29 8 64 30-34 6 70 35-39 3 73 40-44 2 75 45-49 1 76
  • 26.
    n=76 l = lowerlimit of class interval where the median occurs = 15 h = Width of the median class = 4 f = Frequency of the class where median occurs = 26 C = Cumulative frequency of the class preceding the median class =13 f hc n l       − + 2
  • 27.
    Mode 1.Measure of CentralTendency 2.The mode is the most frequently occurring value in the data set. 3.May Be No Mode or Several Modes
  • 28.
    Merits: • Mode isreadily comprehensible and easy to calculate. • Mode is not at all affected by extreme values. • Mode can be conveniently located even if the frequency distribution has class intervals of unequal magnitude • Open-end classes also do not pose any problem in the location of mode. • Mode is the average to be used to find the ideal size.
  • 29.
    Demerits: • Mode isill defined. • It is not based upon all the observations. • It is not capable of further mathematical treatment. • As compared with mean, mode is affected to a great extent by fluctuations of sampling.
  • 30.
    Mode Example No Mode RawData: 10.3 4.9 8.9 11.7 6.3 7.7 One Mode Raw Data: 6.3 4.9 8.9 6.3 4.9 4.9 More Than 1 Mode Raw Data: 21 28 28 41 43 43
  • 31.
    Mode for ungroupeddata:- 2,2,3,4,6,7,4,4,4,4,8,9,0 mode is 4 10,10,3,3,4,2,1,6,7 mode is 10 and 3 10,34,23,12,11,3,4 no mode
  • 32.
    Mode for GroupData Fm-F1 Mode = L1 + ------------------ * c 2Fm– F1- F2 Where •Fm is mode freq. • F1 is freq. just lower mode class. •F2 is freq. after mode class. • L1 is lower limit of mode class •C is class difference.
  • 33.
    C I FREQU.(F) 20 - 30 3 30 - 40 20 40 - 50 27 50 - 60 15 60 - 70 9 Q. Find the Mode for group data Age group 20-30 30-40 40-50 50-60 60-70 No. of persons 3 20 27 15 9
  • 34.
    Q. Find theMode for group data Age group 20-30 30-40 40-50 50-60 60-70 No. of persons 3 20 27 15 9 C I FREQU. (F) 20 - 30 3 30 - 40 20 40 - 50 27 50 - 60 15 60 - 70 9 L1 Fm F1 F2
  • 35.
    FFmm -- FF11 Mode= LMode = L11 + ------------------ * c+ ------------------ * c 2F2Fmm – F– F11- F- F22 2727 –– 20 7020 70 Mode = 40 + ------------------ * 10 = 40 + -----Mode = 40 + ------------------ * 10 = 40 + ----- 2*272*27 – 20- 15 19– 20- 15 19 Mode = 43.68Mode = 43.68
  • 36.
    Calculate the modefor the following frequency distribution:- IQ Range Frequency 90-100 11 100-110 27 110-120 36 120-130 38 130-140 43 140-150 28 150-160 16 160-170 1
  • 37.
    Modal class byinspection is 130-140 fm= 43 f1= 38 f2= 28 C=10 l = 130 c fff ff l m m       −− − + )(2 )( 21 1 =130.6579
  • 38.
    Relationship between Mean, Medianand Mode Mode = 3 Median – 2 Mean
  • 39.
    Summary of Central TendencyMeasures MeasureMeasure DescriptionDescription MeanMean Balance PointBalance Point MedianMedian Middle ValueMiddle Value When OrderedWhen Ordered ModeMode Most FrequentMost Frequent
  • 40.
    Ex. Calculate Mean,Median, Mode. Age Group No. of Patients 25-30 4 30-35 3 35-40 2 40-45 3 45-50 4 50-55 8 55-60 6
  • 41.
    Age Group No.of Patients (F) X F*X C.F 25-30 4 27.5 110 4 30-35 3 32.5 97.5 7 35-40 2 37.5 75 9 40-45 3 42.5 127.5 12 45-50 4 47.5 190 16 50-55 8 52.5 420 24 55-60 6 57.5 345 30 30 1365 MEAN =1365/30 = 45.5 MEDIAN =45+ (15-12)*5/4 = 48.75 MODE=50 + [(8-4)*5/(2*8-4-6)]=53.34
  • 42.
    Ex. The followingtable gives the frequency distribution of marks obtained by 2300 medical students of Gujarat in MCQ of PSM exam. Find Mean, Median and Mode. Marks No. of students 11-20 141 21-30 221 31-40 439 41-50 529 51-60 495 61-70 322 71-80 153
  • 43.
    Geometric Mean • Geometricmean is defined as the positive root of the product of observations. Symbolically, • It is also often used for a set of numbers whose values are meant to be multiplied together or are exponential in nature, such as data on the growth of the human population or interest rates of a financial investment. • Find geometric mean of rate of growth: 34, 27, 45, 55, 22, 34 n nxxxxG /1 321 )( =
  • 44.
    Geometric mean ofGroup data • If the “n” non-zero and positive variate-values occur times, respectively, then the geometric mean of the set of observations is defined by: [ ] Nn i f i Nf n ff in xxxxG 1 1 1 21 21       == ∏=  ∑= = n i ifN 1 Where nxxx ,........,, 21 nfff ,.......,, 21
  • 45.
    Geometric Mean (RevisedEqn.) )( 321 nxxxxG =         = ∑= n i ixLog N AntiLogG 1 1         = ∑= n i ii xLogf N AntiLogG 1 1 )( 321 321 n fff xxxxG = Ungroup Data Group Data
  • 47.
    What is thegeometric mean of 4,8.3,9 and 17?
  • 48.
    First, multiply thenumbers together and then take the 5th root (because there are 5 numbers) G = (4*8*3*9*17)(1/5) G = 6.81
  • 49.
    Harmonic Mean • Harmonicmean (formerly sometimes called the subcontrary mean) is one of several kinds of average. • The harmonic mean is a very specific type of average. • It’s generally used when dealing with averages of units, like speed or other rates and ratios.
  • 50.
    Harmonic Mean GroupData • The harmonic mean H of the positive real numbers x1,x2, ..., xn is defined to be ∑= = n i i i x f n H 1 ∑= = n i ix n H 1 1 Ungroup Data Group Data
  • 51.
    What is theharmonic mean of 1,5,8,10? Here, N=4 H = 4 / (1/1) +(1/5) + (1/8) + (1/10) H = 4/ 1.425 H = 2.80 ∑= = n i ix n H 1 1
  • 52.
    Rahul drives acar at 20 mph for the first hour and 30 mph for the second. What’s his average speed?
  • 53.
    We need theharmonic mean: = 2/(1/20 + 1/30) = 2(0.05 + 0.033) = 2 / 0.083 = 24.09624 mph.
  • 54.
    Weighted Mean • TheWeighted mean of the positive real numbers x1,x2, ..., xn with their weight w1,w2, ..., wn is defined to be ∑ ∑ = = = n i i n i ii w xw x 1 1 Σ = the sum of (in other words…add them up!). w = the weights. x = the value.
  • 55.
    A weighted meanis a kind of average. Instead of each data point contributing equally to the final mean, some data points contribute more “weight” than others. If all the weights are equal, then the weighted mean equals the arithmetic mean (the regular “average” you’re used to). Weighted means are very common in statistics, especially when studying populations.
  • 56.
    Steps: 1.Multiply the numbersin your data set by the weights. 2.Add the numbers in Step 1 up. Set this number aside for a moment. 3.Add up all of the weights. 4.Divide the numbers you found in Step 2 by the number you found in Step 3.
  • 57.
    You take three100-point exams in your statistics class and score 80, 80 and 95. The last exam is much easier than the first two, so your professor has given it less weight. The weights for the three exams are: •Exam 1: 40 % of your grade. (Note: 40% as a decimal is .4.) •Exam 2: 40 % of your grade. •Exam 3: 20 % of your grade
  • 58.
    1.Multiply the numbersin your data set by the weights: .4(80) = 32 .4(80) = 32 .2(95) = 19 2. Add the numbers up. 32 + 32 + 19 = 83. 3. (0.4+0.4+0.2) = 1 4. 83/1= 83
  • 59.
    The arithmetic meanis best used when the sum of the values is significant. For example, your grade in your statistics class. If you were to get 85 on the first test, 95 on the second test, and 90 on the third test, your average grade would be 90. Why don't we use the geometric mean here? What about the harmonic mean?  
  • 60.
    What if yougot a 0 on your first test and 100 on the other two? The arithmetic mean would give you a grade of 66.6. The geometric mean would give you a grade of 0!!! The harmonic mean can't even be applied at all because 1/0 is undefined.