Downloaded 210 times
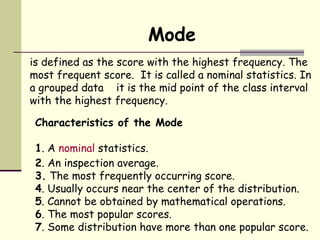
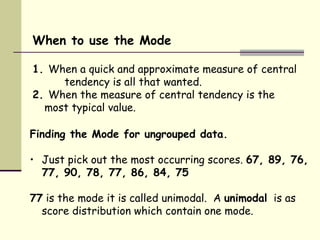

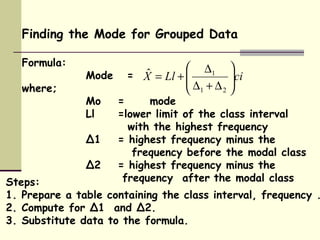
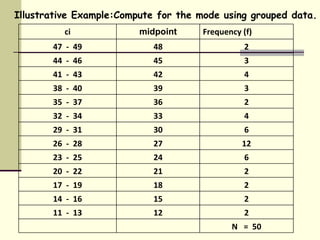


The mode is defined as the score that occurs most frequently in a data set. It is a measure of central tendency that indicates the most common value. For an ungrouped data set, the mode is simply the value that repeats most. For a grouped data set, the mode is calculated using a formula that finds the midpoint of the interval with the highest frequency while accounting for the differences in frequencies on either side of that interval. The mode is useful when wanting a quick approximation of central tendency or when trying to find the most typical value in a data set. Data sets can have one, two, or more modes depending on the number of most frequent values.