Measures of Central Tendency
•Download as PPTX, PDF•
11 likes•1,548 views

This document discusses various measures of central tendency including arithmetic mean, median, and mode. It provides definitions and formulas for calculating each measure along with examples using raw data and grouped data. The three main points covered are: 1. Measures of central tendency (mean, median, mode) calculate the central or typical value in a data set and are used to describe data distributions. 2. The arithmetic mean is the sum of all values divided by the number of values, the median is the middle number when values are arranged in order, and the mode is the most frequent value. 3. Formulas and methods are provided for calculating each measure using both raw ungrouped data as well as grouped frequency distribution data

Recommended
More Related Content
What's hot
What's hot (20)
Similar to Measures of Central Tendency
Similar to Measures of Central Tendency (20)
More from Suresh Babu
More from Suresh Babu (20)
Recently uploaded
Recently uploaded (20)
Measures of Central Tendency
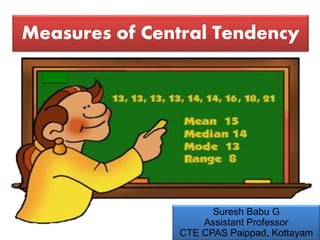
- 1. Suresh Babu G Measures of Central Tendency Suresh Babu G Assistant Professor CTE CPAS Paippad, Kottayam
- 2. Suresh Babu G Measures of Central Tendency • A measure of central tendency is a summary statistic that represents the centre point or typical value of a dataset. • In statistics, the three most common measures of central tendency are 1. Arithmetic Mean 2. Median 3. Mode There are two more types of average ie, Geometric Mean and Harmonic Mean • Each of these measures calculates the location of the central point using a different method.
- 3. Suresh Babu G Arithmetic Mean It is defined as the sum of the values of all observations divided by the number of observations and is usually denoted by X̅ . If there are N observations as X1, X2, X3,…..Xn N Xn....X3X2X1 X N X X Where ΣX = Sum of all observation N = Total number of observation
- 4. Suresh Babu G Arithmetic Mean for Ungrouped Data Individual Series Direct Method Example: Calculate Arithmetic Mean from the data showing marks of students in a class in an psychology test : 40, 50, 55, 78, 58. N X X 2.565 5878555040 X N X X
- 5. Suresh Babu G Arithmetic Mean for Ungrouped Data Discrete Series Direct Method N fX X
- 6. Suresh Babu G Example Calculate the AM from the following: Mark No: of students fX 22 5 110 25 10 250 30 15 450 37 7 259 45 3 135 50 10 500 N = 50 Σfx = 1704 Marks 22 25 30 37 45 50 No: of students 5 10 15 7 3 10 N fX X 08.34 50 1704 X 08.34 50 1704 X
- 7. Suresh Babu G Continuous Series Direct Method N fm or N fX X Where M = Mid value
- 8. Suresh Babu G Example: From the following data calculate AM Marks 0 - 10 10 - 20 20 - 30 30 - 40 40 - 50 No: of Students 5 3 7 25 20 Class Frequenc y (f) Mid value (x) fx 0 – 10 5 5 25 10 – 20 3 15 45 20 – 30 7 25 175 30 – 40 25 35 875 40 - 50 20 45 900 N = 60 Σfx = 2020 N fX X 67.33 60 2020 X X 33.67
- 9. Suresh Babu G Short Cut Method N fd AX Where A = Assumed Mean d = deveation of mid values from the assumed mean d = m-A N = Number of observations N fd AX
- 10. Suresh Babu G Example: From the following data calculate AM Marks 0 - 10 10 - 20 20 - 30 30 - 40 40 - 50 No: of Students 5 3 7 25 20 Class Freque ncy (f) Mid value (x) d= x-A fd 0 – 10 5 5 -20 -100 10 – 20 3 15 -10 -30 20 – 30 7 25 0 0 30 – 40 25 35 10 250 40 - 50 20 45 20 400 N = 60 Σfd=520 25 A = 25 N fd AX 66.33 66.825 60 52025 X X
- 11. Suresh Babu G Median Median is the middle element when the data set is arranged in order of the magnitude. Median of Ungrouped Data Individual Series Median = Size of item Where N is number of observations 2 )1( N th
- 12. Suresh Babu G Example : The following data provides marks of seven students. Calculate median 110, 115, 140, 117, 109, 113, 120 Arrange the data in ascending order 109, 110, 113, 115, 117, 120, 140 Median = Size of item Median = Size of item = Size of item Median = Size of 4 item Median = 115 2 )1( N th 2 )17( th 2 8 th th
- 13. Suresh Babu G Example 2 : Calculate the median 38, 24, 45, 50, 85, 60, 95, 40, 56, 63 Ascending order 24, 38, 40, 45, 50, 56, 60, 63, 85, 95 Median = Size of item Median = Size of item = Size of item Median = Size of 5.5 item Median = 50 + 0.5(56-50) = 50 + 0.5 X 6 = 53 Median = 53 2 )1( N 2 )110( 2 11 th th th th
- 14. Suresh Babu G Median of Grouped Data Discrete Series Median = Size of item Example: Calculate Median 2 )1( N th Marks No: of students 10 2 20 4 30 10 40 4 N = Total frequency
- 15. Suresh Babu G Marks No: of students Cumulative Frequency 10 2 2 20 4 6 30 10 16 40 4 20 Median = Size of item Median = Size of item = Size of item Median = Size of 10.5 item 10.5 is easily located at 16 of cf corresponding mark is 30 so Median =30 2 )1( N th 2 )120( th 2 21 th th
- 16. Suresh Babu G Continues Series Median = Where L = Lower limit of the median class cf = Cumulative frequency of the classes preceding the median class f = frequency of the median class h = magnitude of the median class interval h f cfN L )2/(
- 17. Suresh Babu G Example: Find median Marks No of Students 0 – 10 4 10 – 20 12 20 – 30 24 30 – 40 36 40 – 50 20 50 – 60 16 60 – 70 8 70 - 80 5
- 18. Suresh Babu G Median = Median = = = 30 + 6.25 Medan = 36.25 Marks No of Students Cumulative Frequency 0 – 10 4 4 10 – 20 12 16 20 – 30 24 40 30 – 40 36 76 40 – 50 20 96 50 – 60 16 112 60 – 70 8 120 70 - 80 5 125 Size of N/2 th item = Size of 125/2 th item = Size of 62.5 th item Median class = 30 – 40 L = 30 cf = 40 f = 36 h = 10 2 N h f cfN L )2/( 1030 36 402/125 1030 36 5.22
- 19. Suresh Babu G Mode Mode is the most frequently observed data value. Ungrouped data – Individual Series Example Find mode 1, 2, 3, 4, 4, 5 Mode is 4 ( as 4 repeats 2 times )
- 20. Suresh Babu G Mode of Grouped Data Discrete Series Example : Find Mode By inspecting the data value, the maximum frequency is 20 ie, 30 mark repeats 20 times so the mode value is 30 mark Marks No. of Students 10 2 20 8 30 20 40 10 50 5 30
- 21. Suresh Babu G Continuous Series: Inspection Method Mode = Where L = lower limit of the modal class D1 = Difference between the frequency of the model class and the frequency of the class preceding the modal class (ignoring signs) D2 = Difference between the frequency of the model class and the frequency of the class succeeding the modal class (ignoring signs) h = class interval if the distribution h DD DL 21 1
- 22. Suresh Babu G Example Find mode value Marks No of Students 0 – 10 5 10 – 20 7 20 – 30 8 30 – 40 20 40 – 50 10 50 – 60 6 60 – 70 2 70 - 80 2
- 23. Suresh Babu G The most frequently occurring data value is between 30-40 which occurs 20 times. The model class is 30 – 40. Mode = D1 = 20 – 8 = 12 Mode = D2 = 20 – 10 = 10 Mode = 30 + 5.45 L = 30 Mode = 30.45 h = 10 Marks No of Students 0 – 10 5 10 – 20 7 20 – 30 8 30 – 40 20 40 – 50 10 50 – 60 6 60 – 70 2 70 - 80 2 h DD DL 21 1 1030 1012 12
- 24. Suresh Babu G Another Method to find mode value is Mode = 3Median – 2 Mean
- 25. Suresh Babu G
- 26. Suresh Babu G
- 27. Suresh Babu G