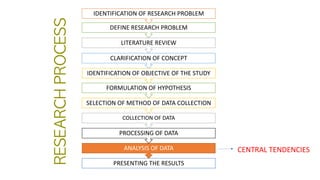
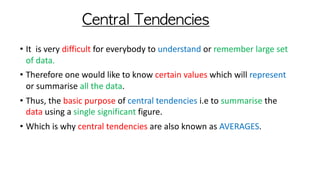
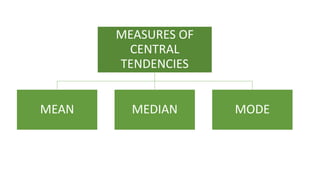
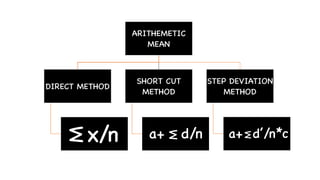
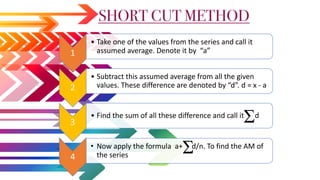
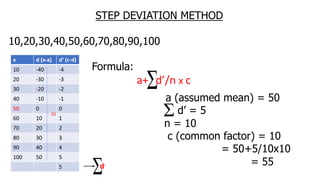
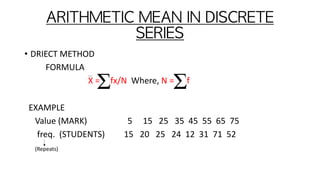
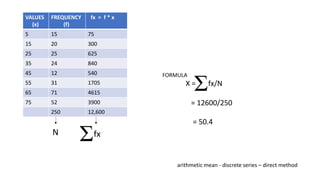
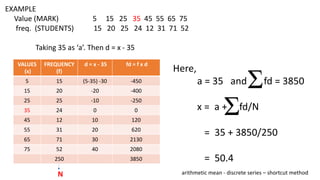
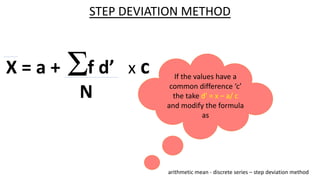
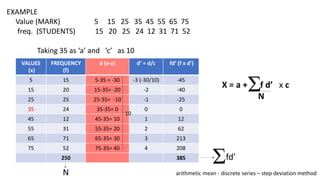
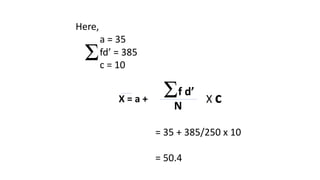
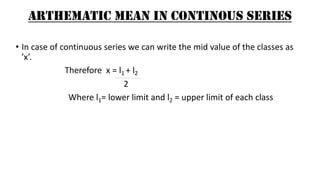
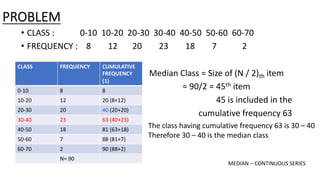
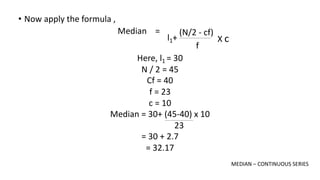
This document discusses various statistical measures of central tendency, including the mean, median, and mode. It provides definitions and formulas for calculating the arithmetic mean using direct, shortcut, and step deviation methods for individual, discrete, and continuous data series. It also discusses how to calculate the median and weighted mean. The document compares the merits and demerits of the arithmetic mean and provides examples to illustrate the different calculation techniques for central tendencies.


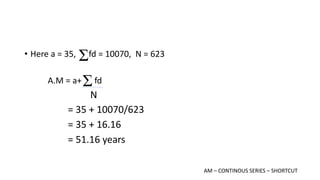
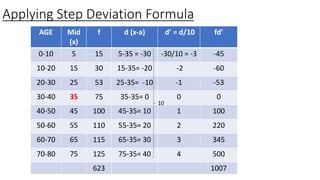
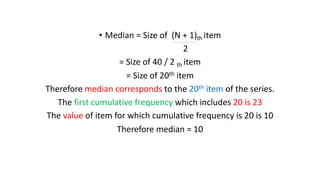
![Applying Short Cut Formula A.M = a+ fd
N
AGE f Mid (x) [l1+l2/2] d = x - 35 fd = f*d
0-10 15 5 5 - 35 = -30 -450
10-20 30 15 15 – 35 = -20 -600
20-30 53 25 24-35 = -10 -530
30-40 75 35 0 0
40-50 100 45 45 – 35 = 10 1000
50-60 110 55 55 – 35 = 20 2200
60-70 115 65 65 – 35 = 30 3450
70-80 125 75 75 – 35 = 40 5000
623 10070
AM – CONTINOUS SERIES – SHORTCUT METHOD](https://image.slidesharecdn.com/statrm-210328183726/85/Statistical-Analysis-using-Central-Tendencies-33-320.jpg)
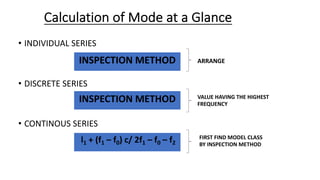
![Calculation of Median at a Glance
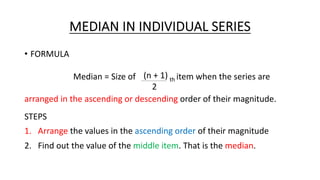
• INDIVIDUAL SERIES
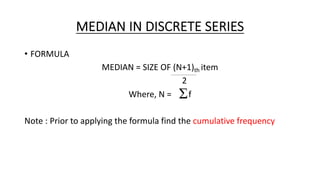
• DISCRETE SERIES
• CONTINOUS SERIES
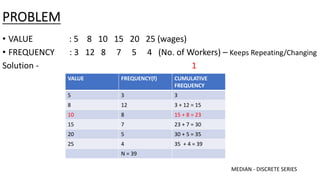
SIZE OF (n + 1)/2th ITEM
SIZE OF (N + 1)/2th ITEM
[N/2] l1 + (N/2 – cf) / f x c
1st find - CUMULATIVE
FREQUENCY
ARRANGE
MEDIAN CLASS
value which corresponds to
cumulative frequency](https://image.slidesharecdn.com/statrm-210328183726/85/Statistical-Analysis-using-Central-Tendencies-56-320.jpg)