Downloaded 332 times


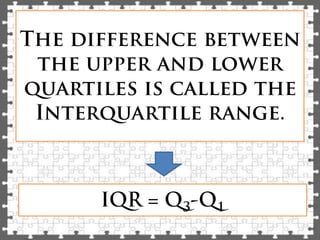


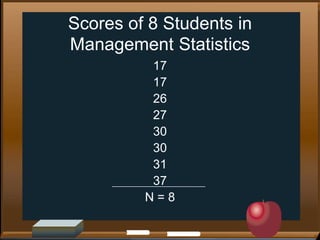

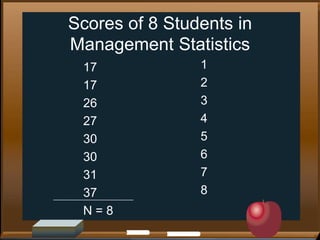


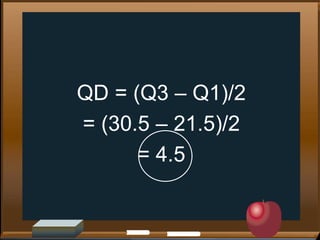


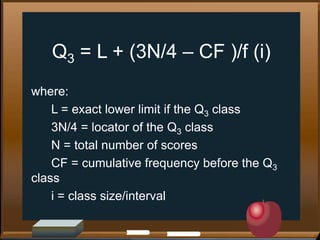


This document contains the scores of 8 students in a management statistics course. It shows the individual scores ranging from 17 to 37. It then calculates the first quartile (Q1) as 21.5 and the third quartile (Q3) as 30.5. The interquartile range (IQR) is calculated as the difference between Q3 and Q1, which is 4.5. Formulas are also provided for calculating Q1 and Q3 based on the class size, total number of scores, and cumulative frequency.


