Download to read offline


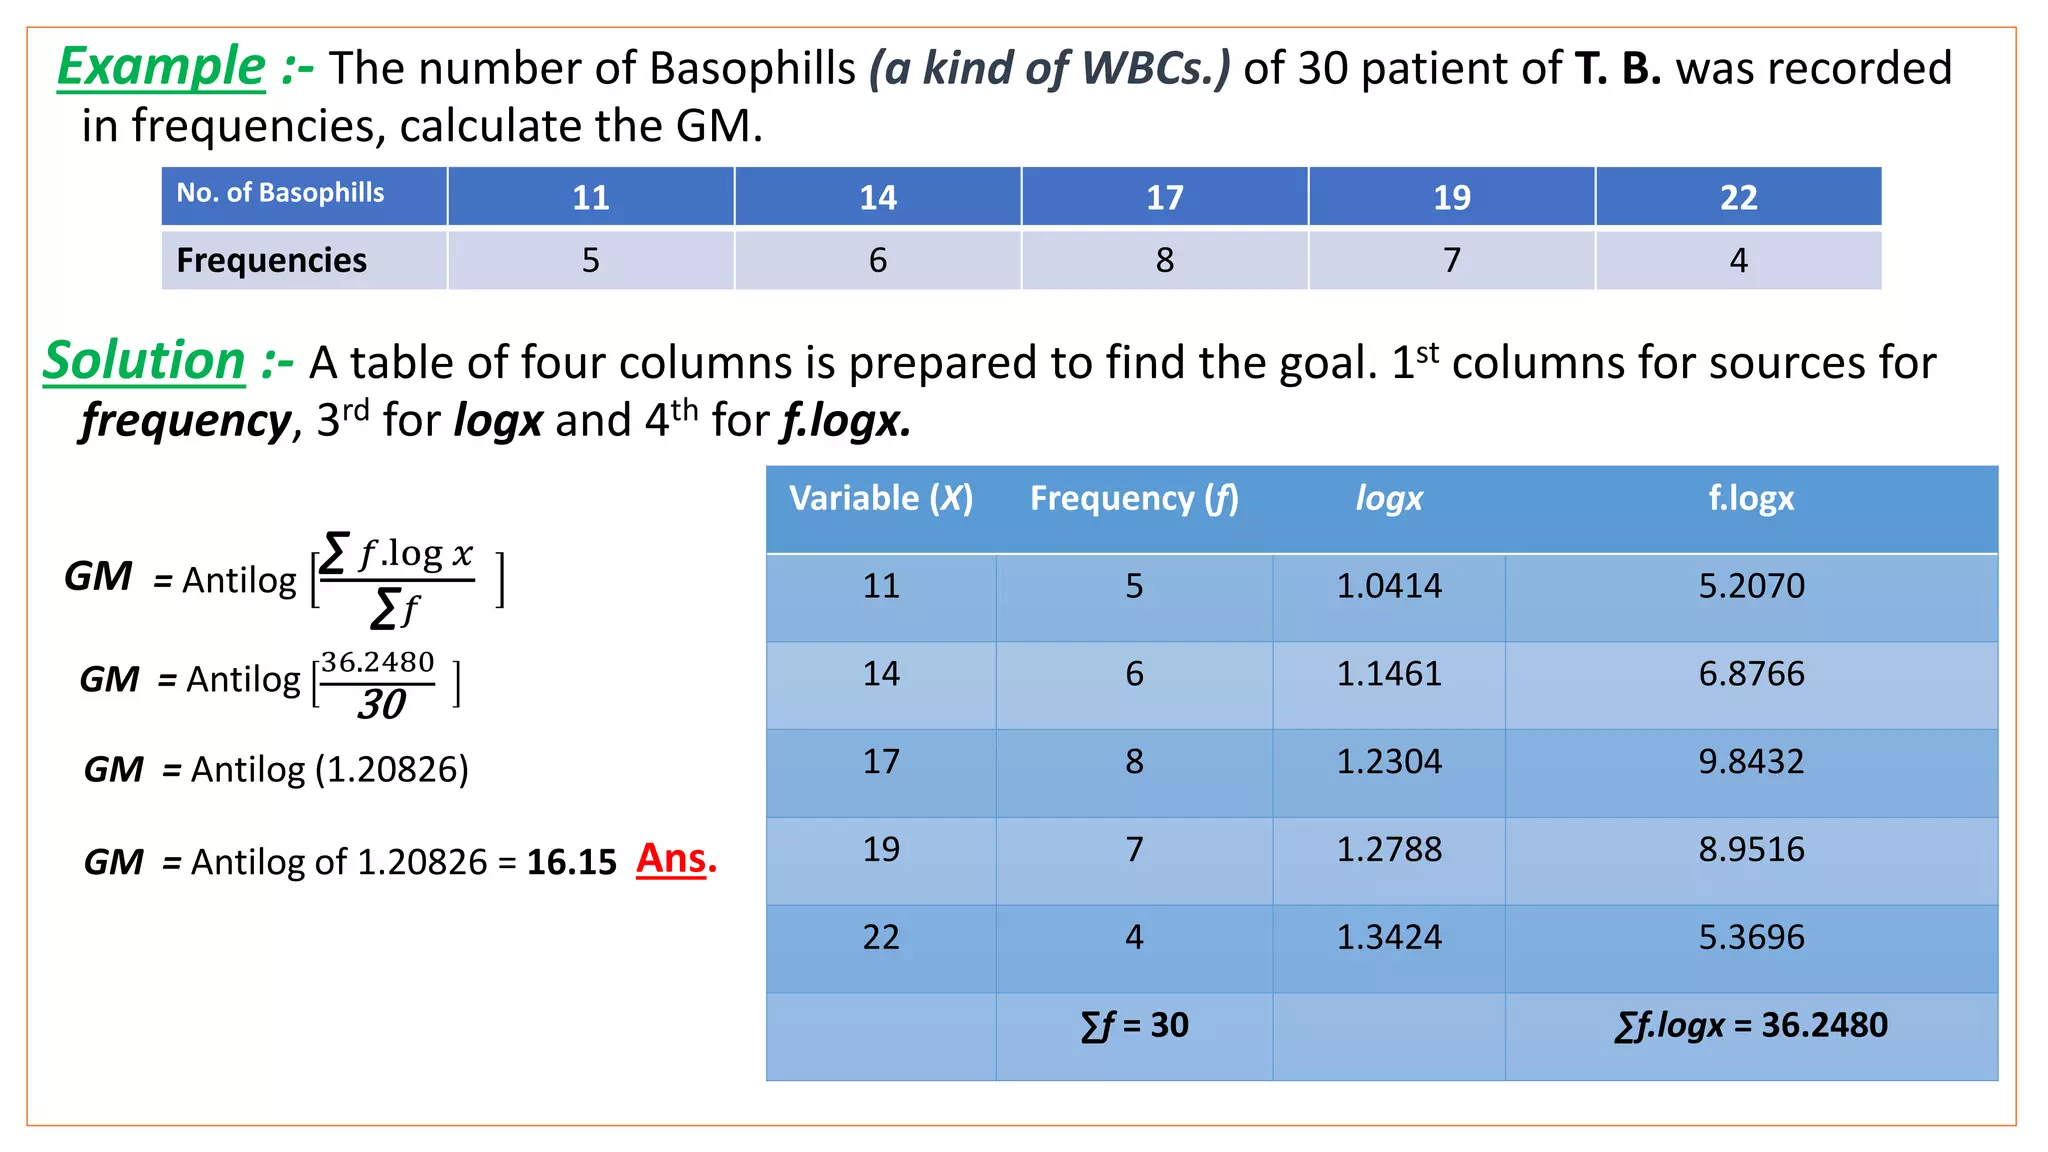
![Class – interval (i) = 10
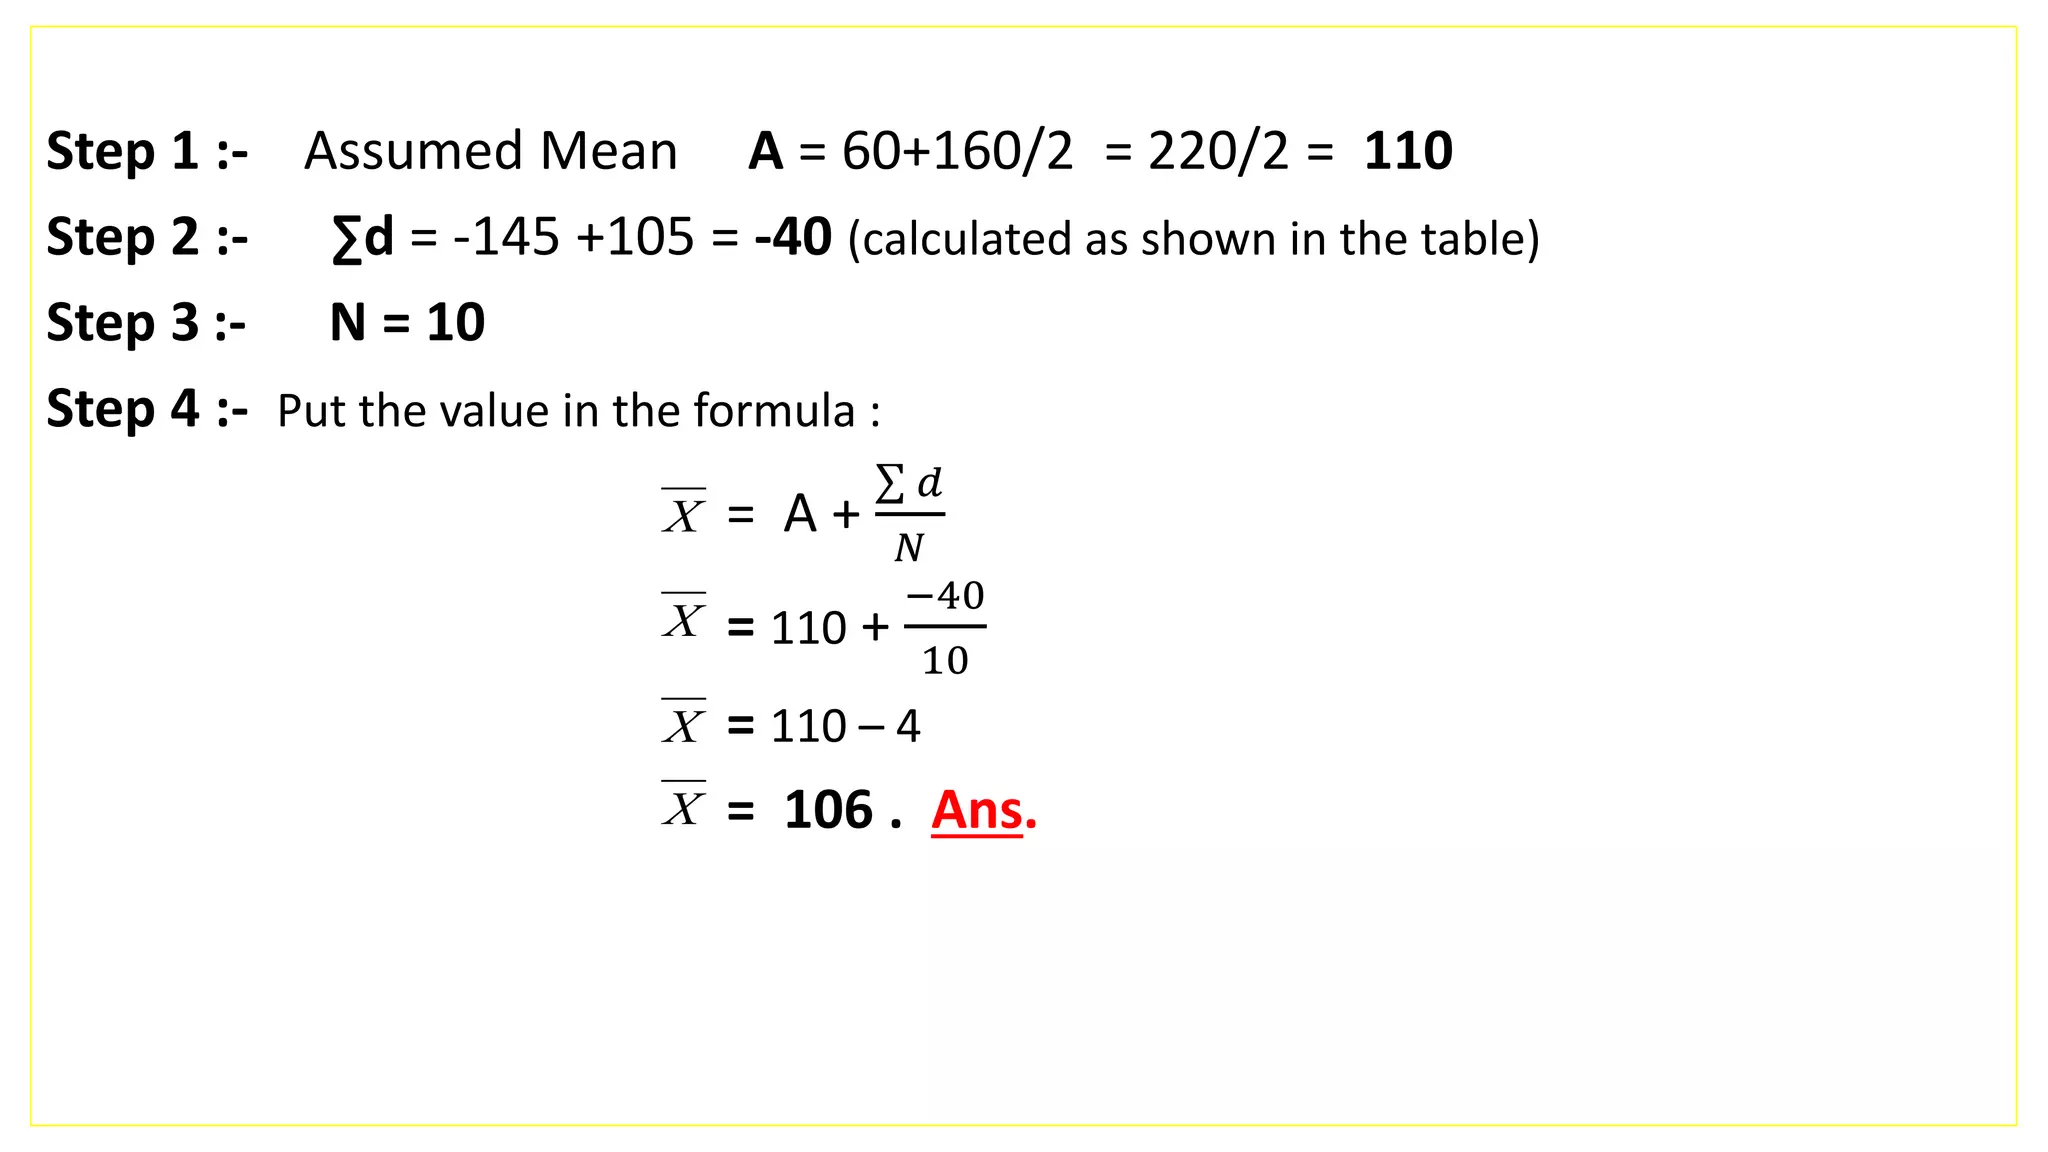
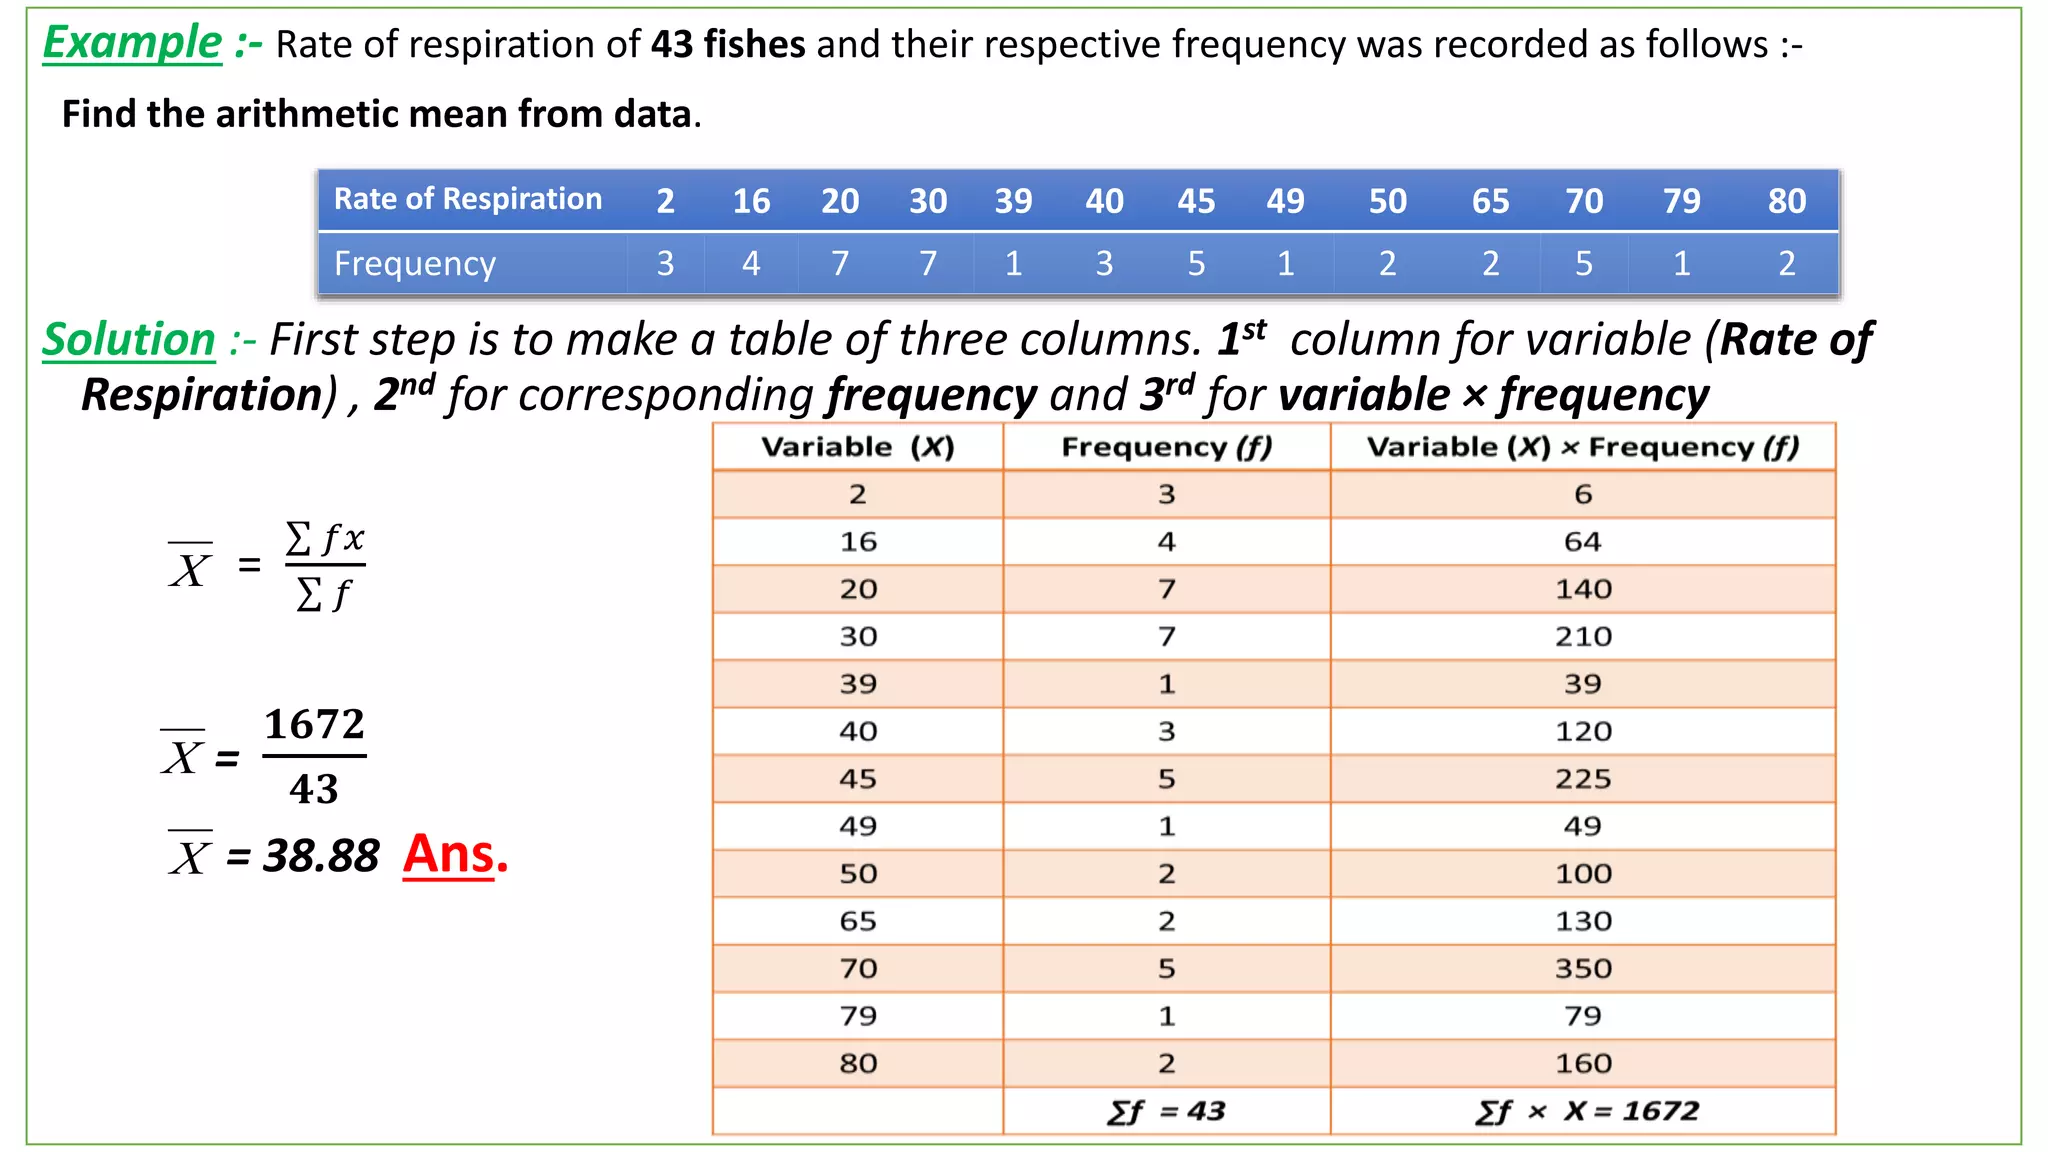
Assumed Mean (M’) = 35
Sum of Observation (N) = 220
Deviation of frequency from mid value (∑fd) = - 216
Put the value in the following formula :-
= M’+
𝑓𝑑
𝑁
i
= 35 +[
−𝟐𝟏𝟔
𝟐𝟐𝟎
] × 10
= 35 – 9.8 = 25.2 Ans.
X
X
X](https://image.slidesharecdn.com/meangirjapd-200220132803/75/Mean-Girja-Pd-Patel-25-2048.jpg)


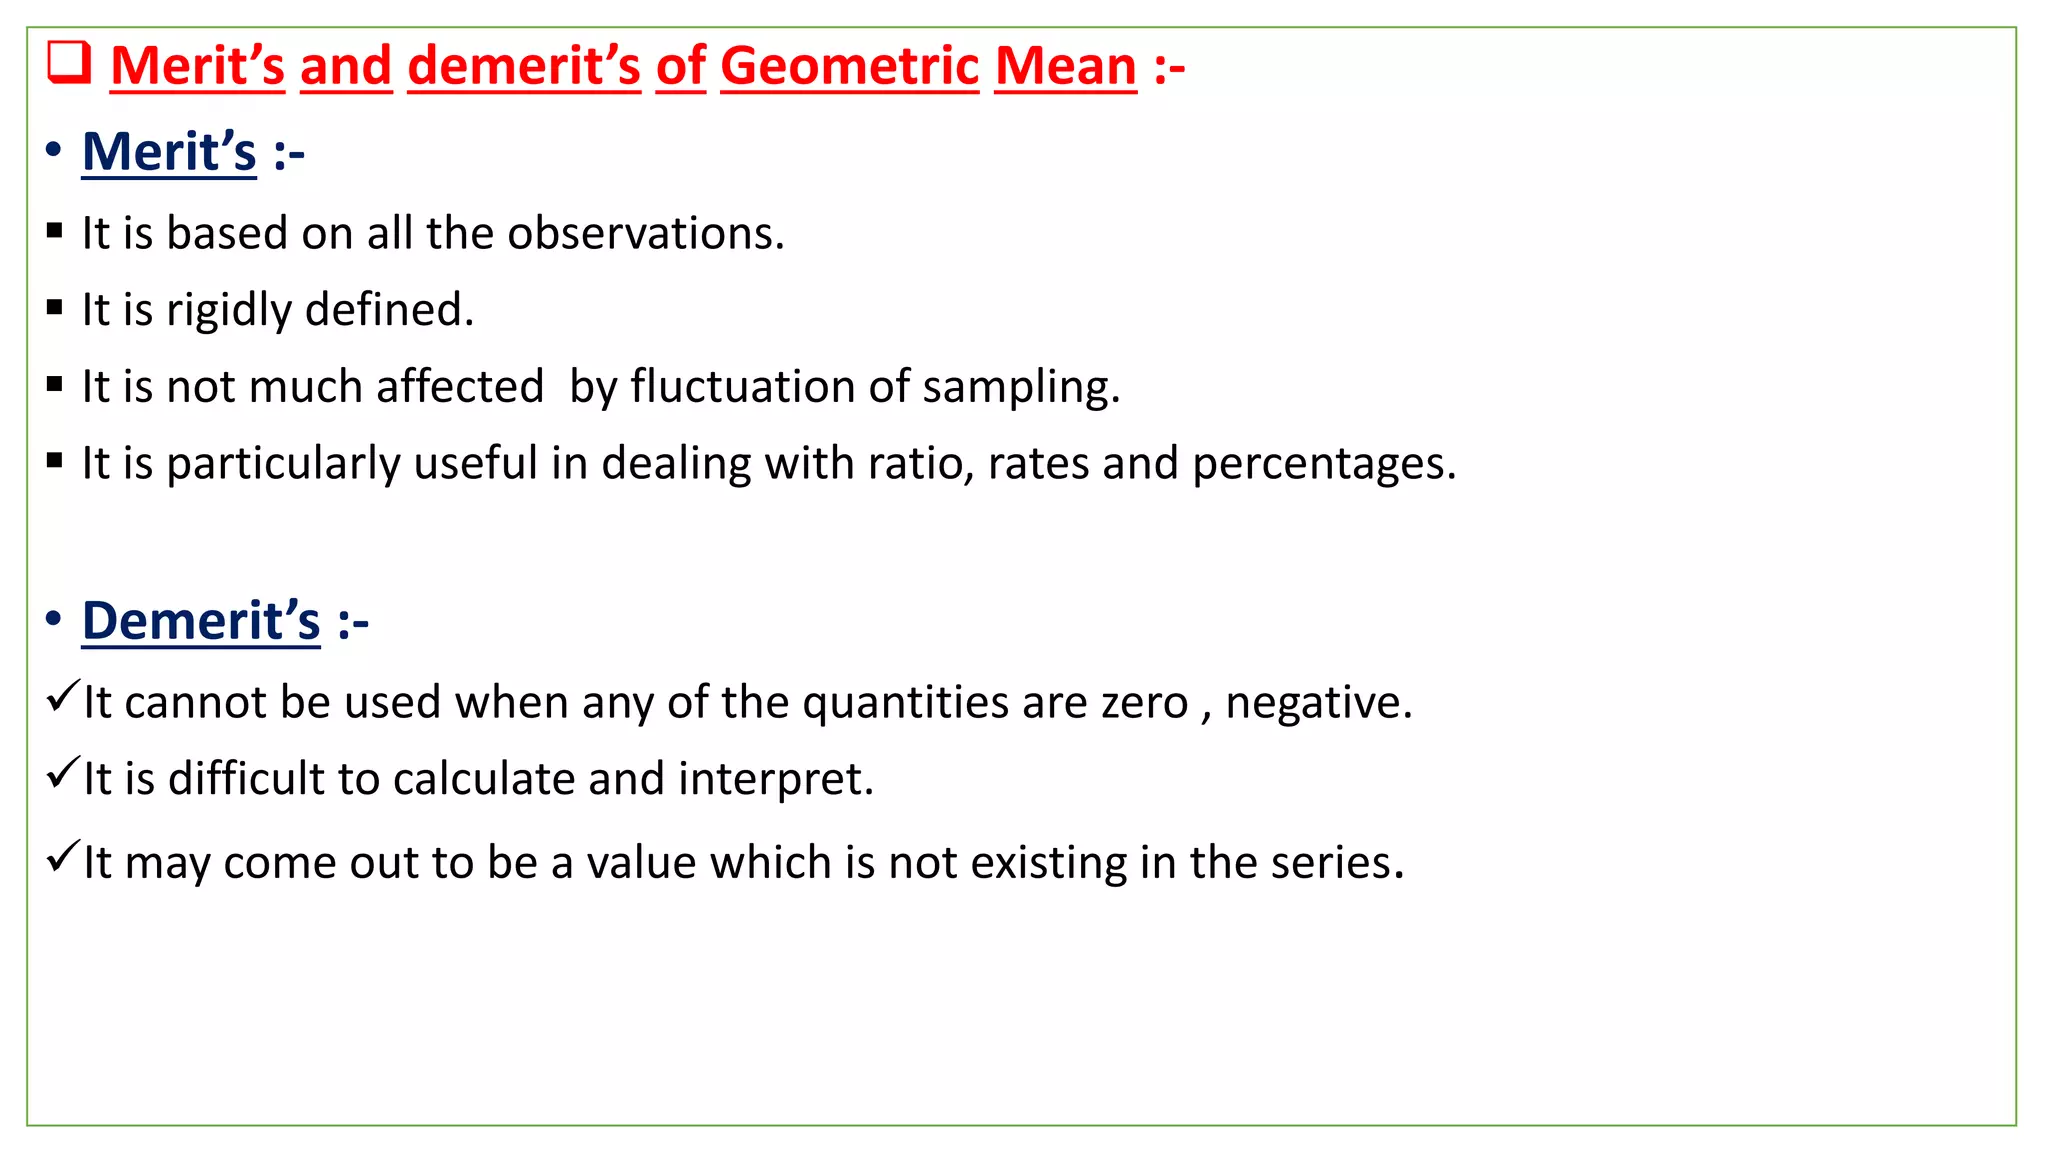


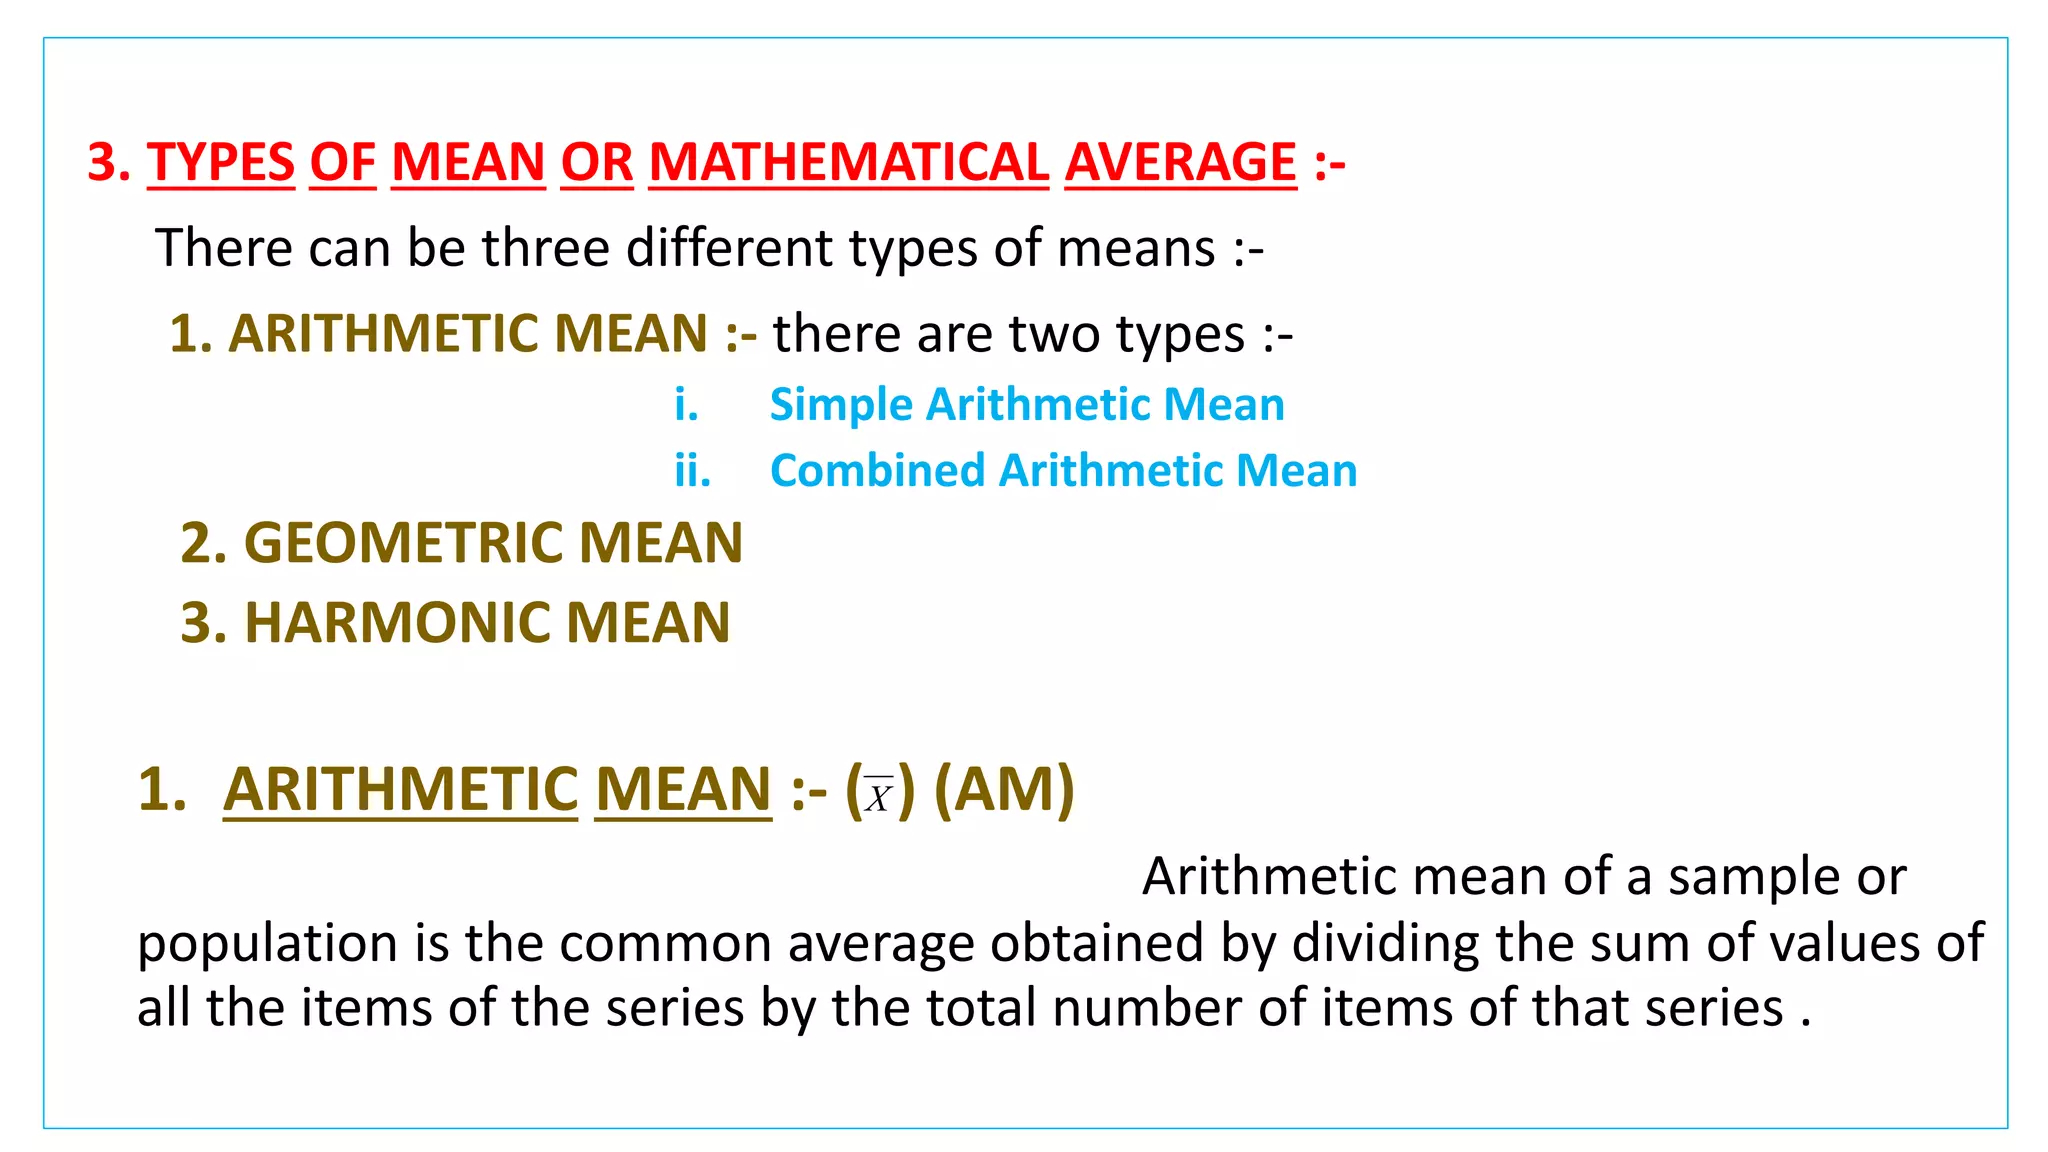
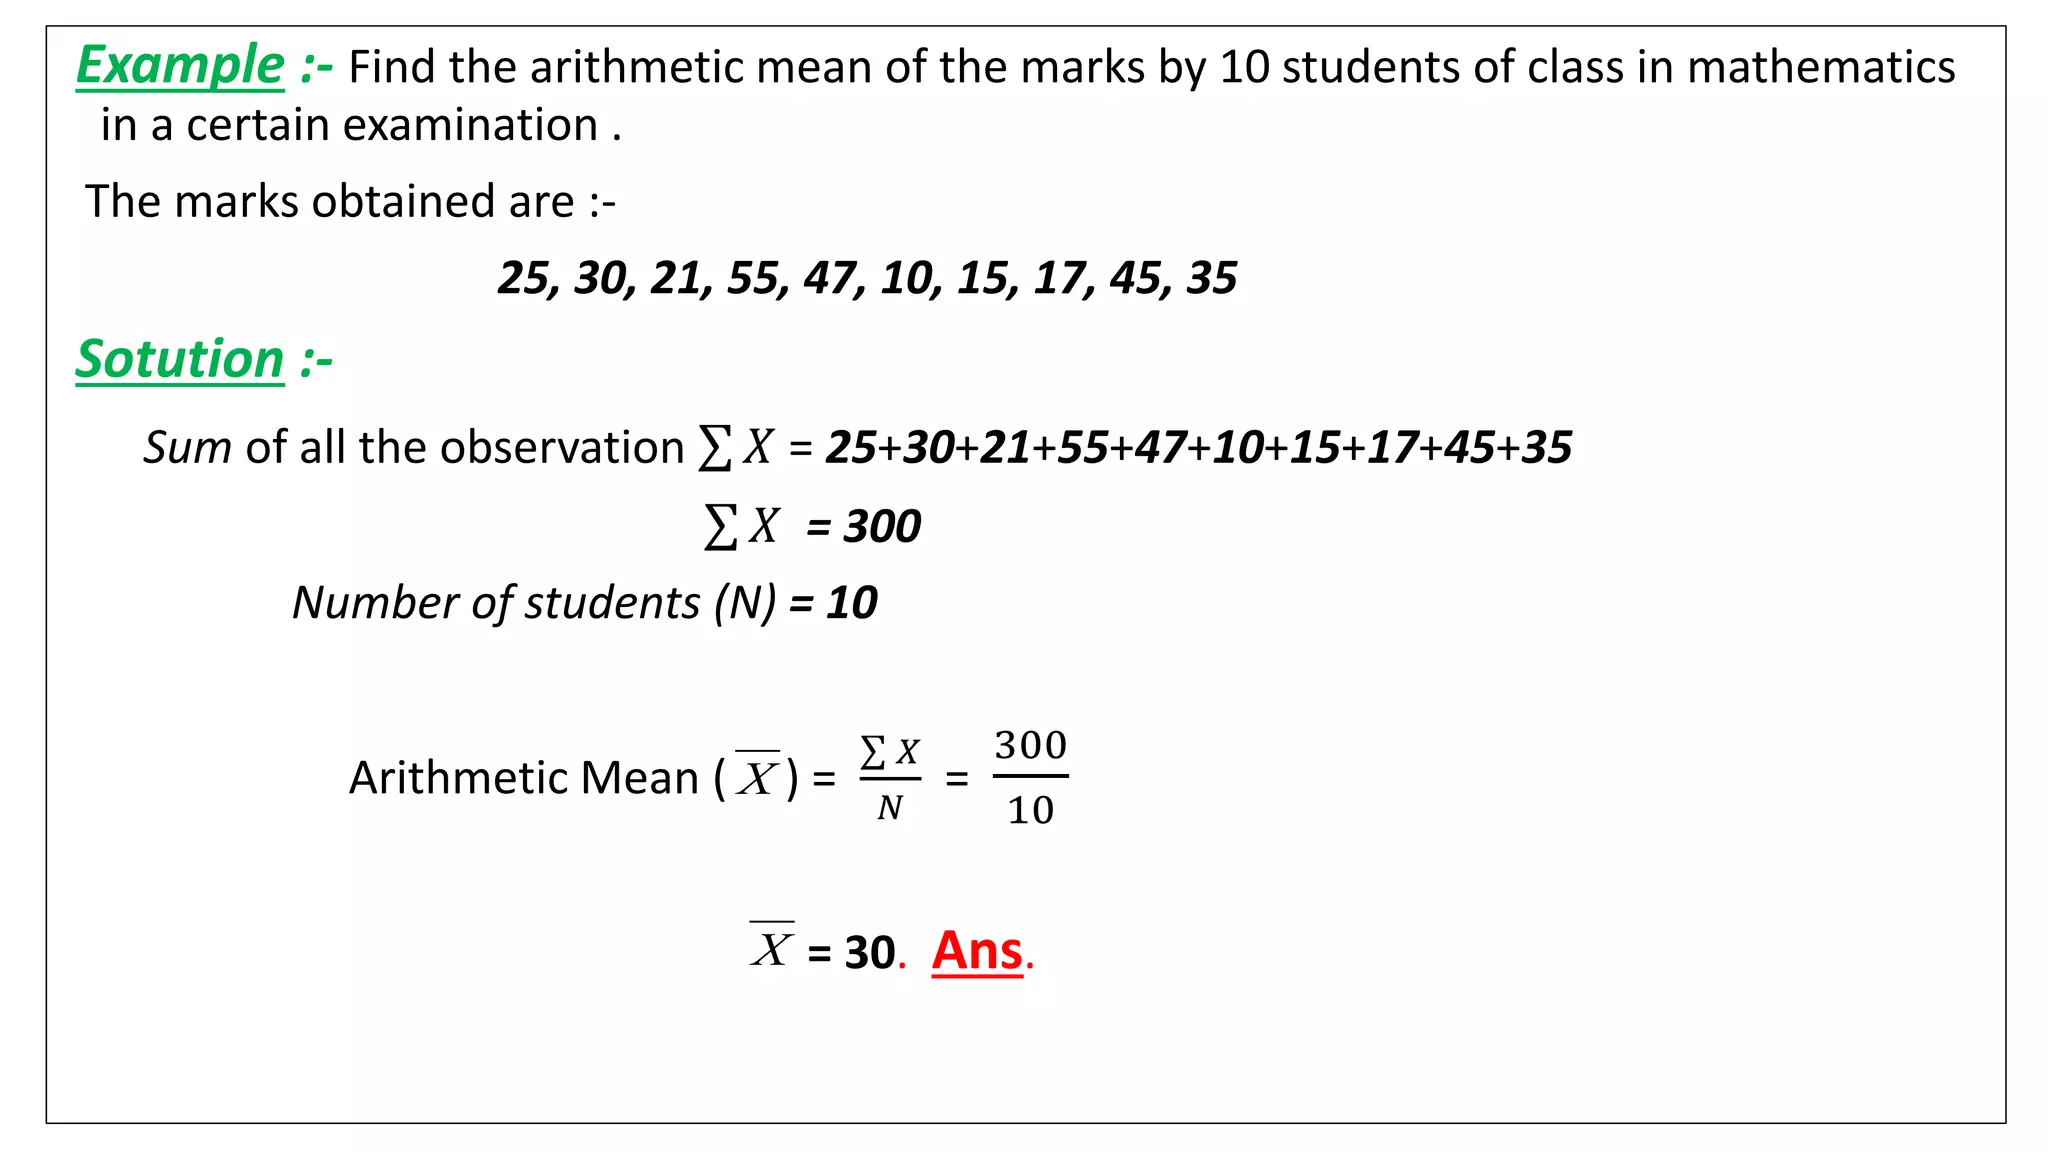
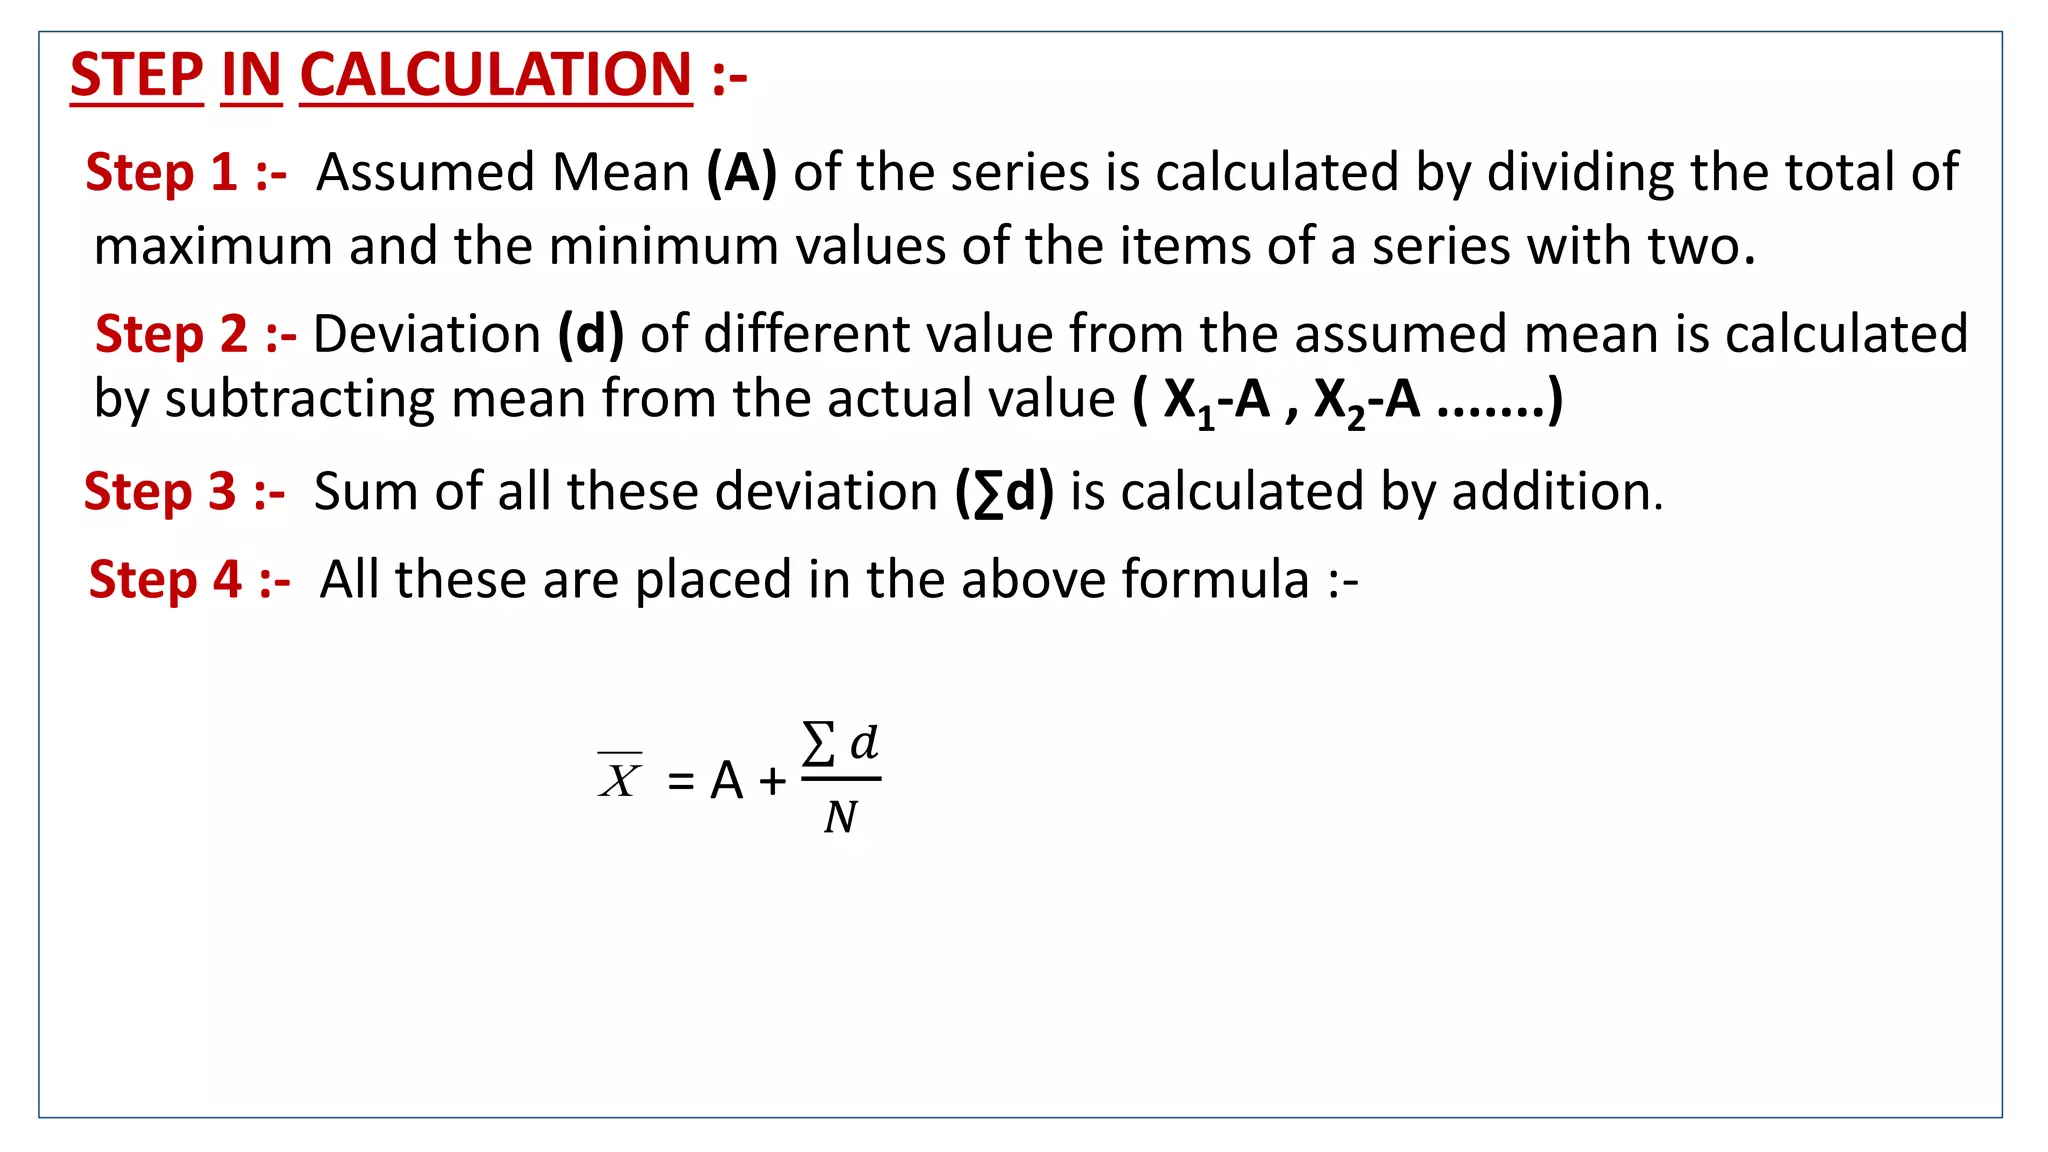
1. The document discusses different types of means or averages, including arithmetic mean, geometric mean, and harmonic mean. 2. It provides definitions and formulas for calculating simple arithmetic mean, combined arithmetic mean, and arithmetic mean of grouped data using both direct and shortcut methods. 3. Examples are given to demonstrate calculating the arithmetic mean from both ungrouped and grouped data using the frequency distribution method and the assumed mean method.