Download to read offline
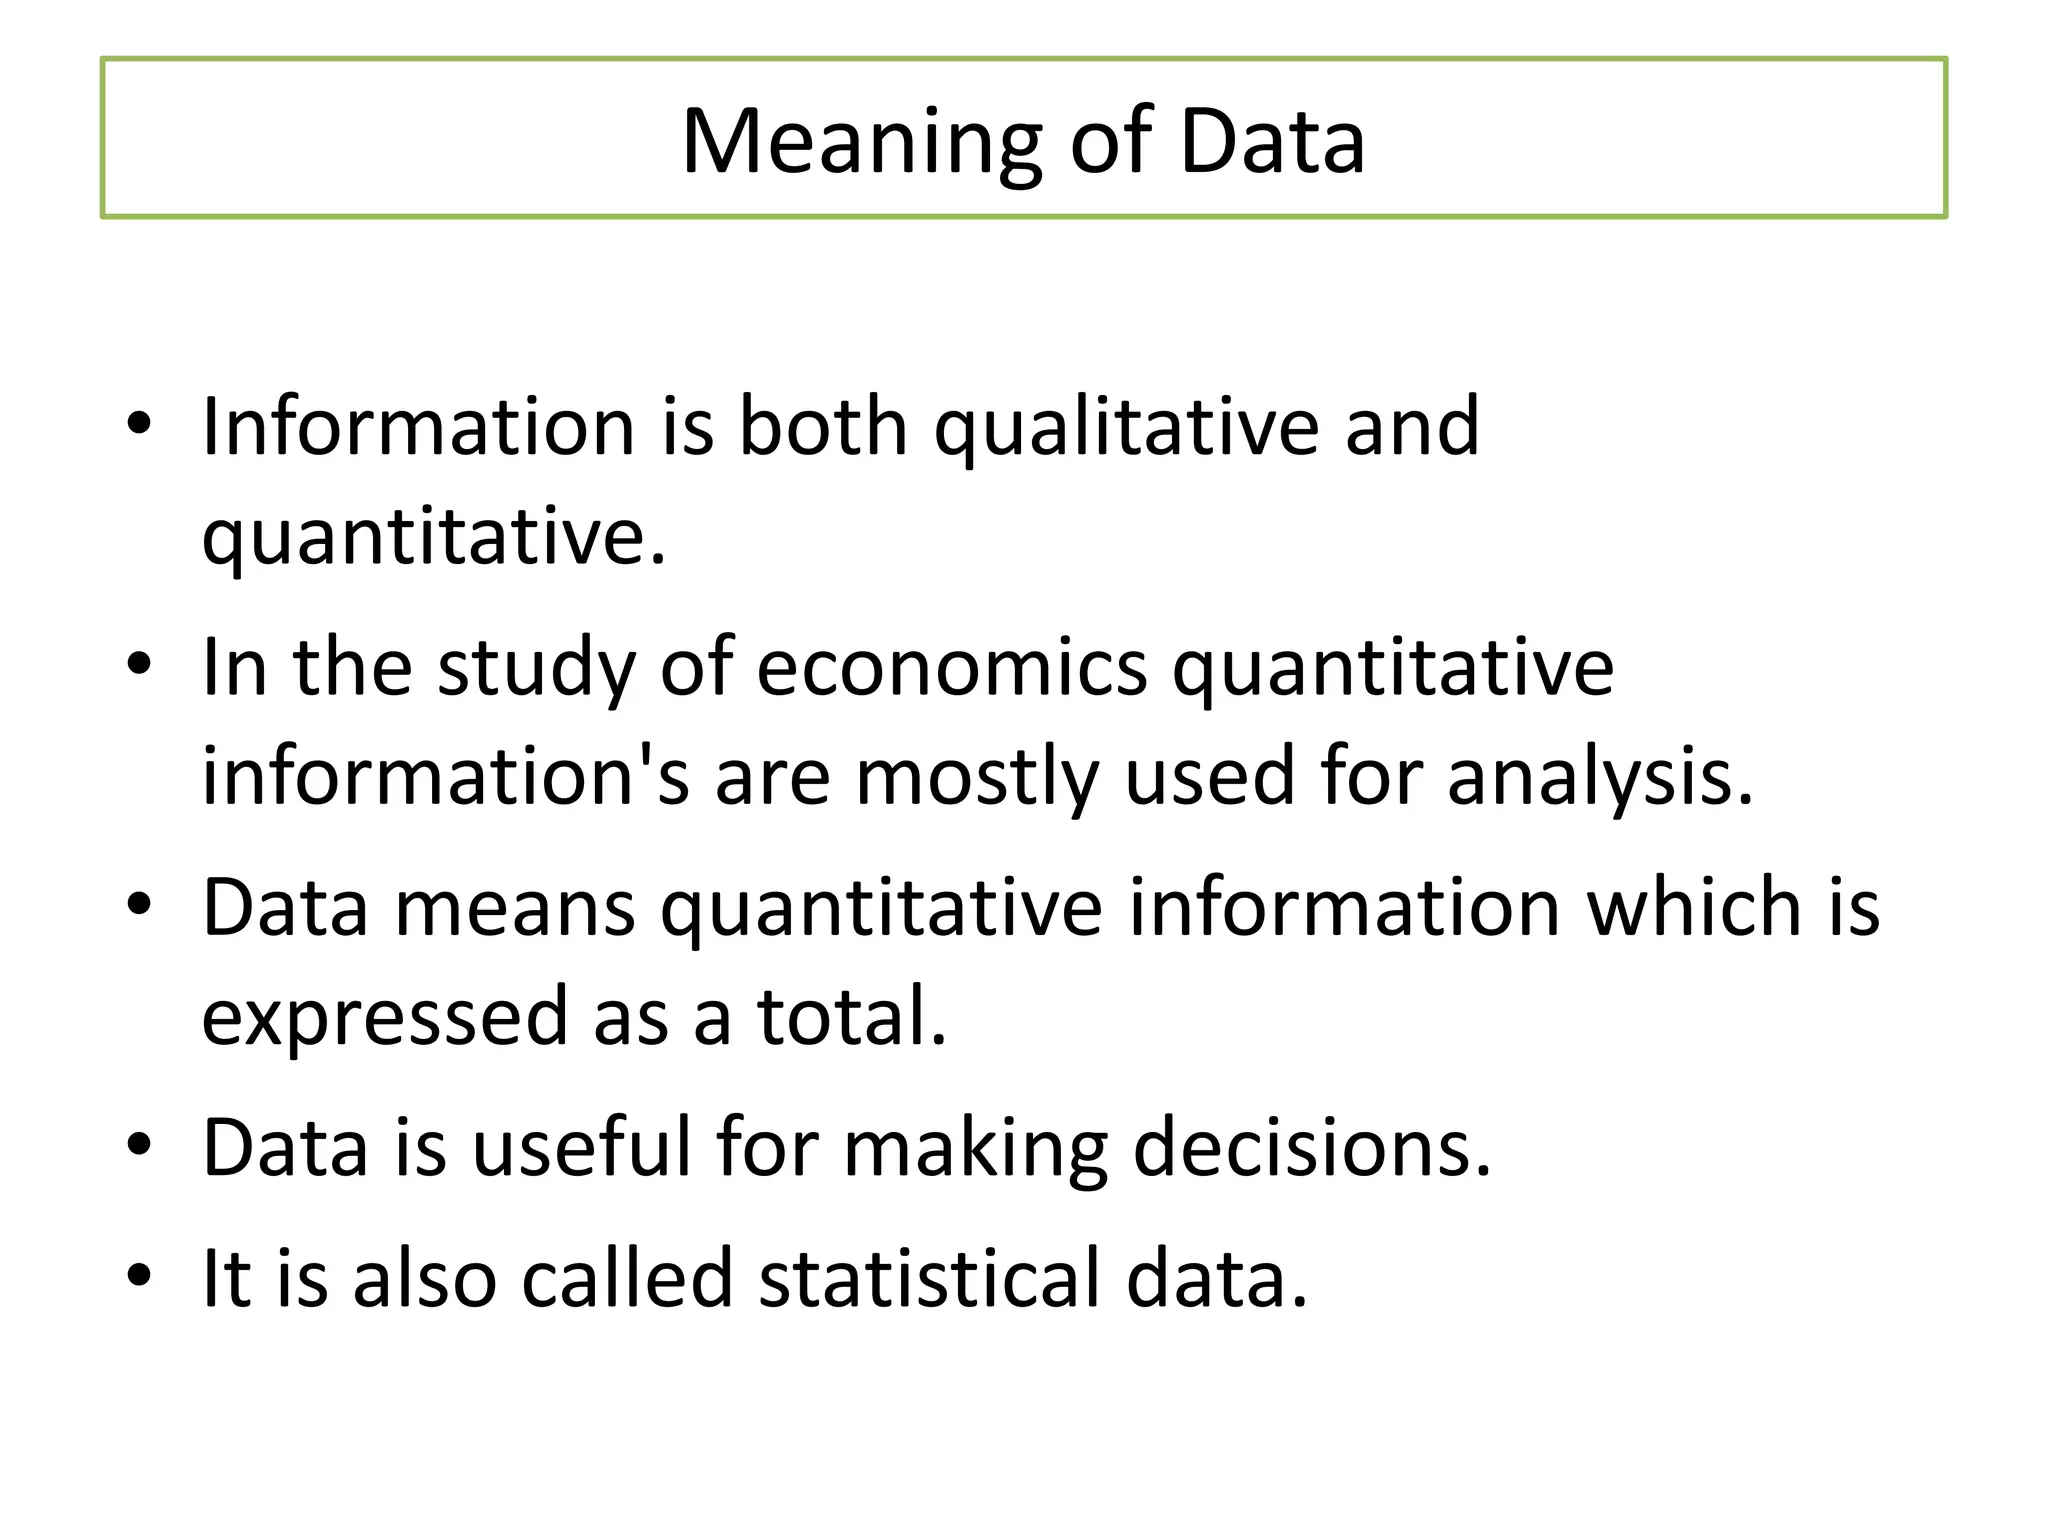
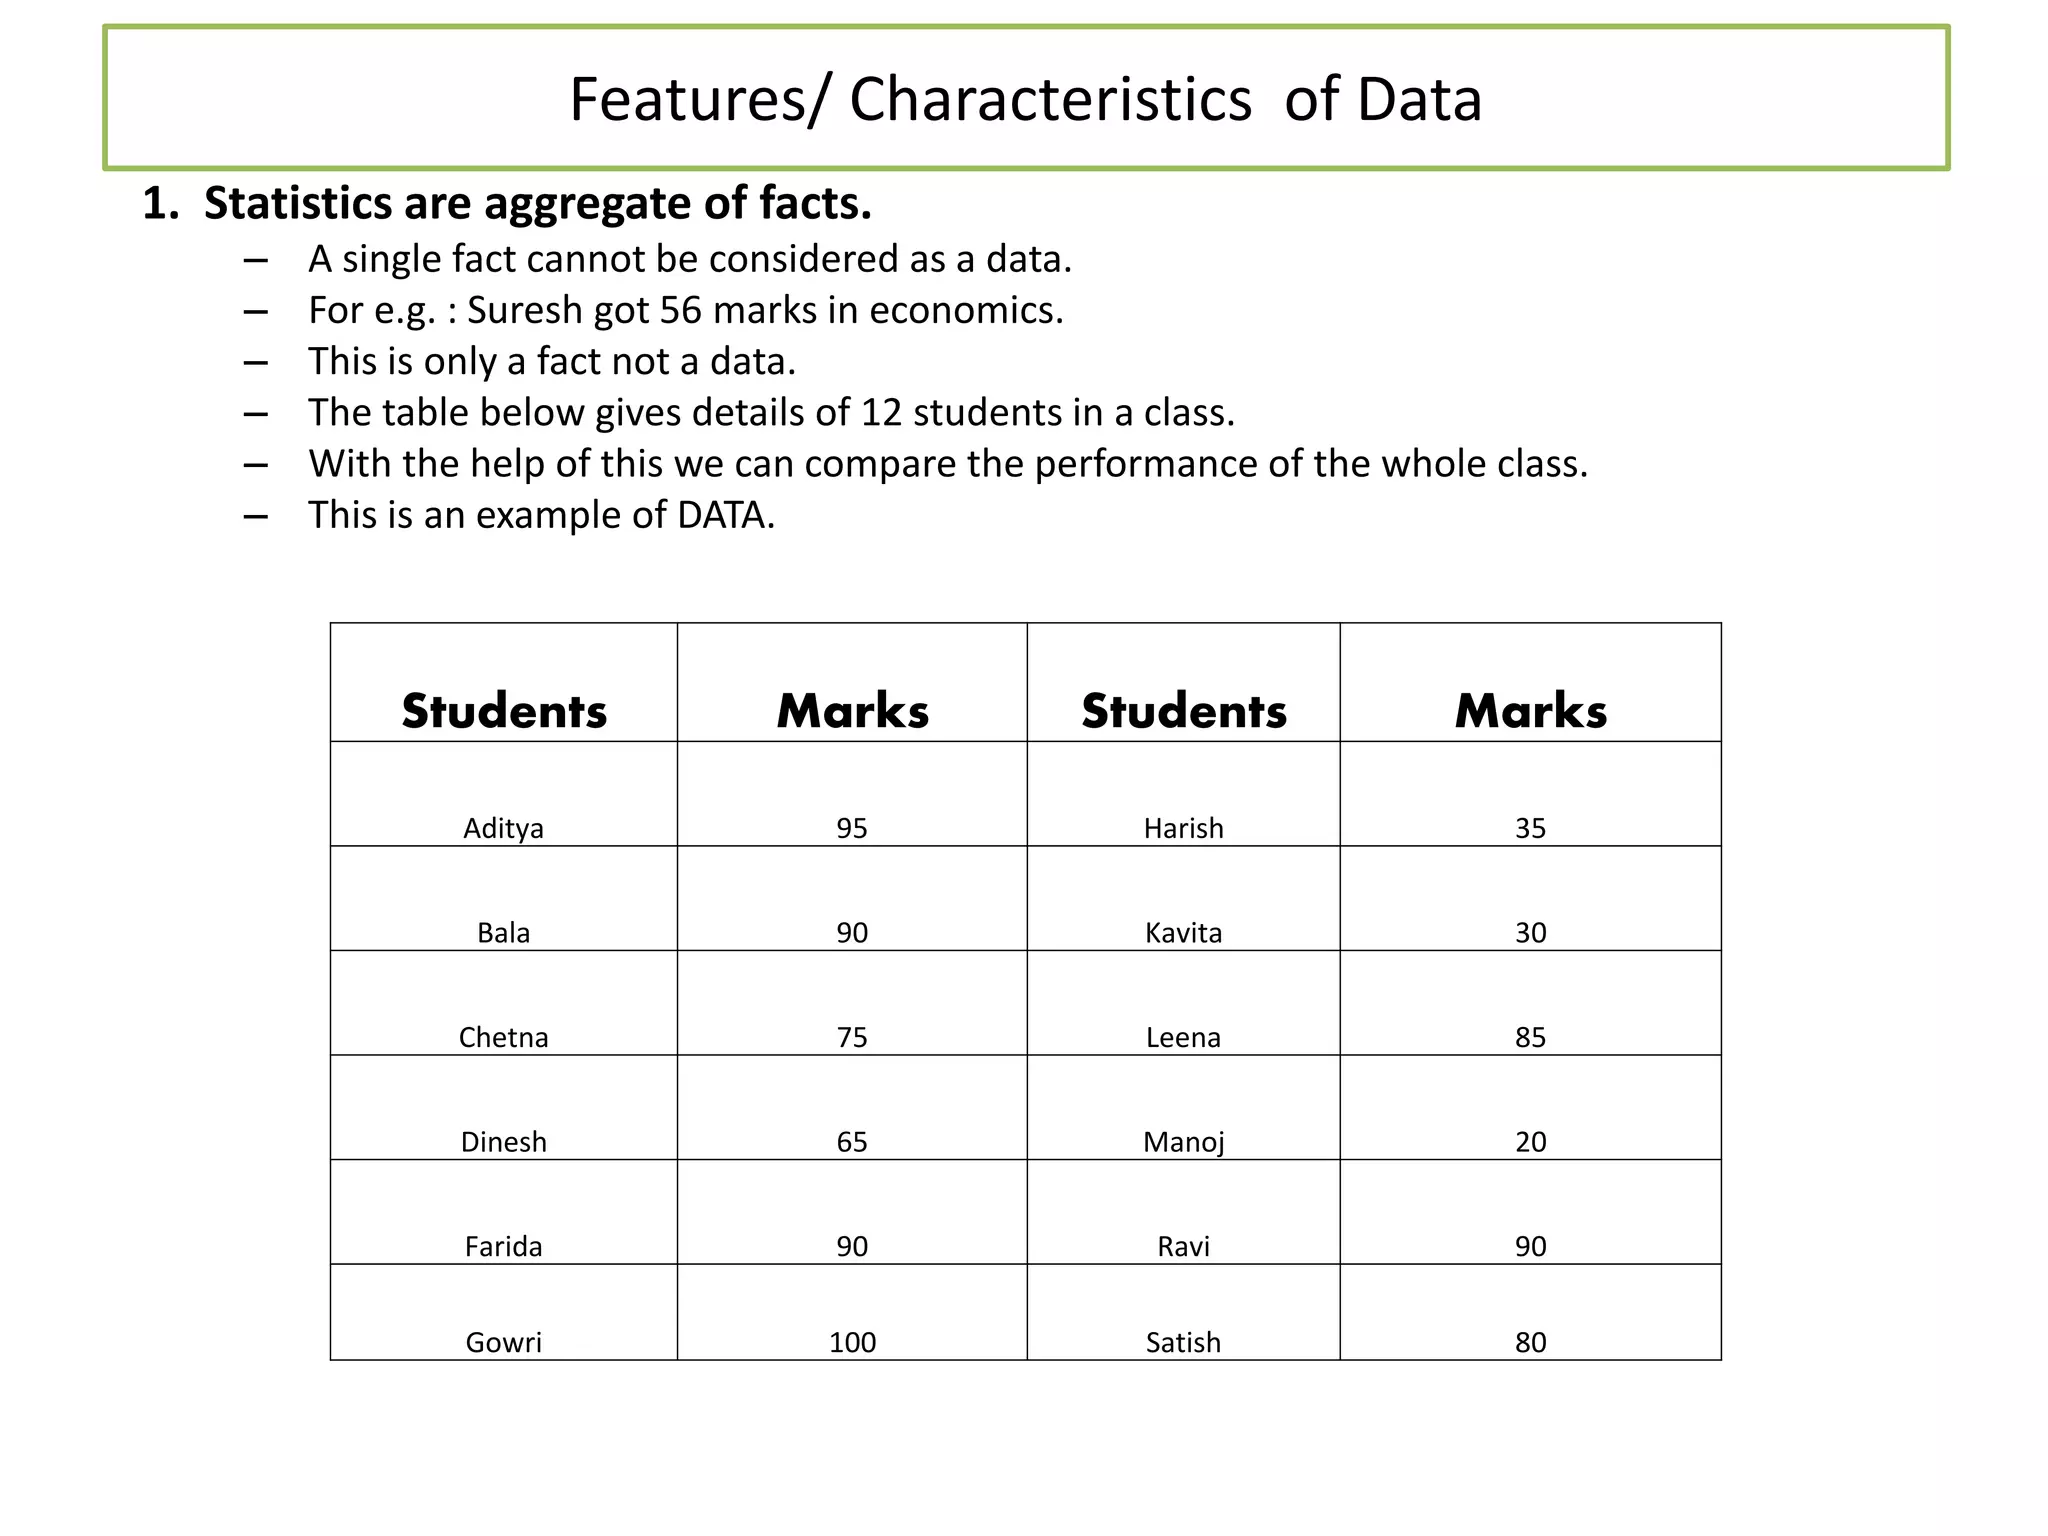

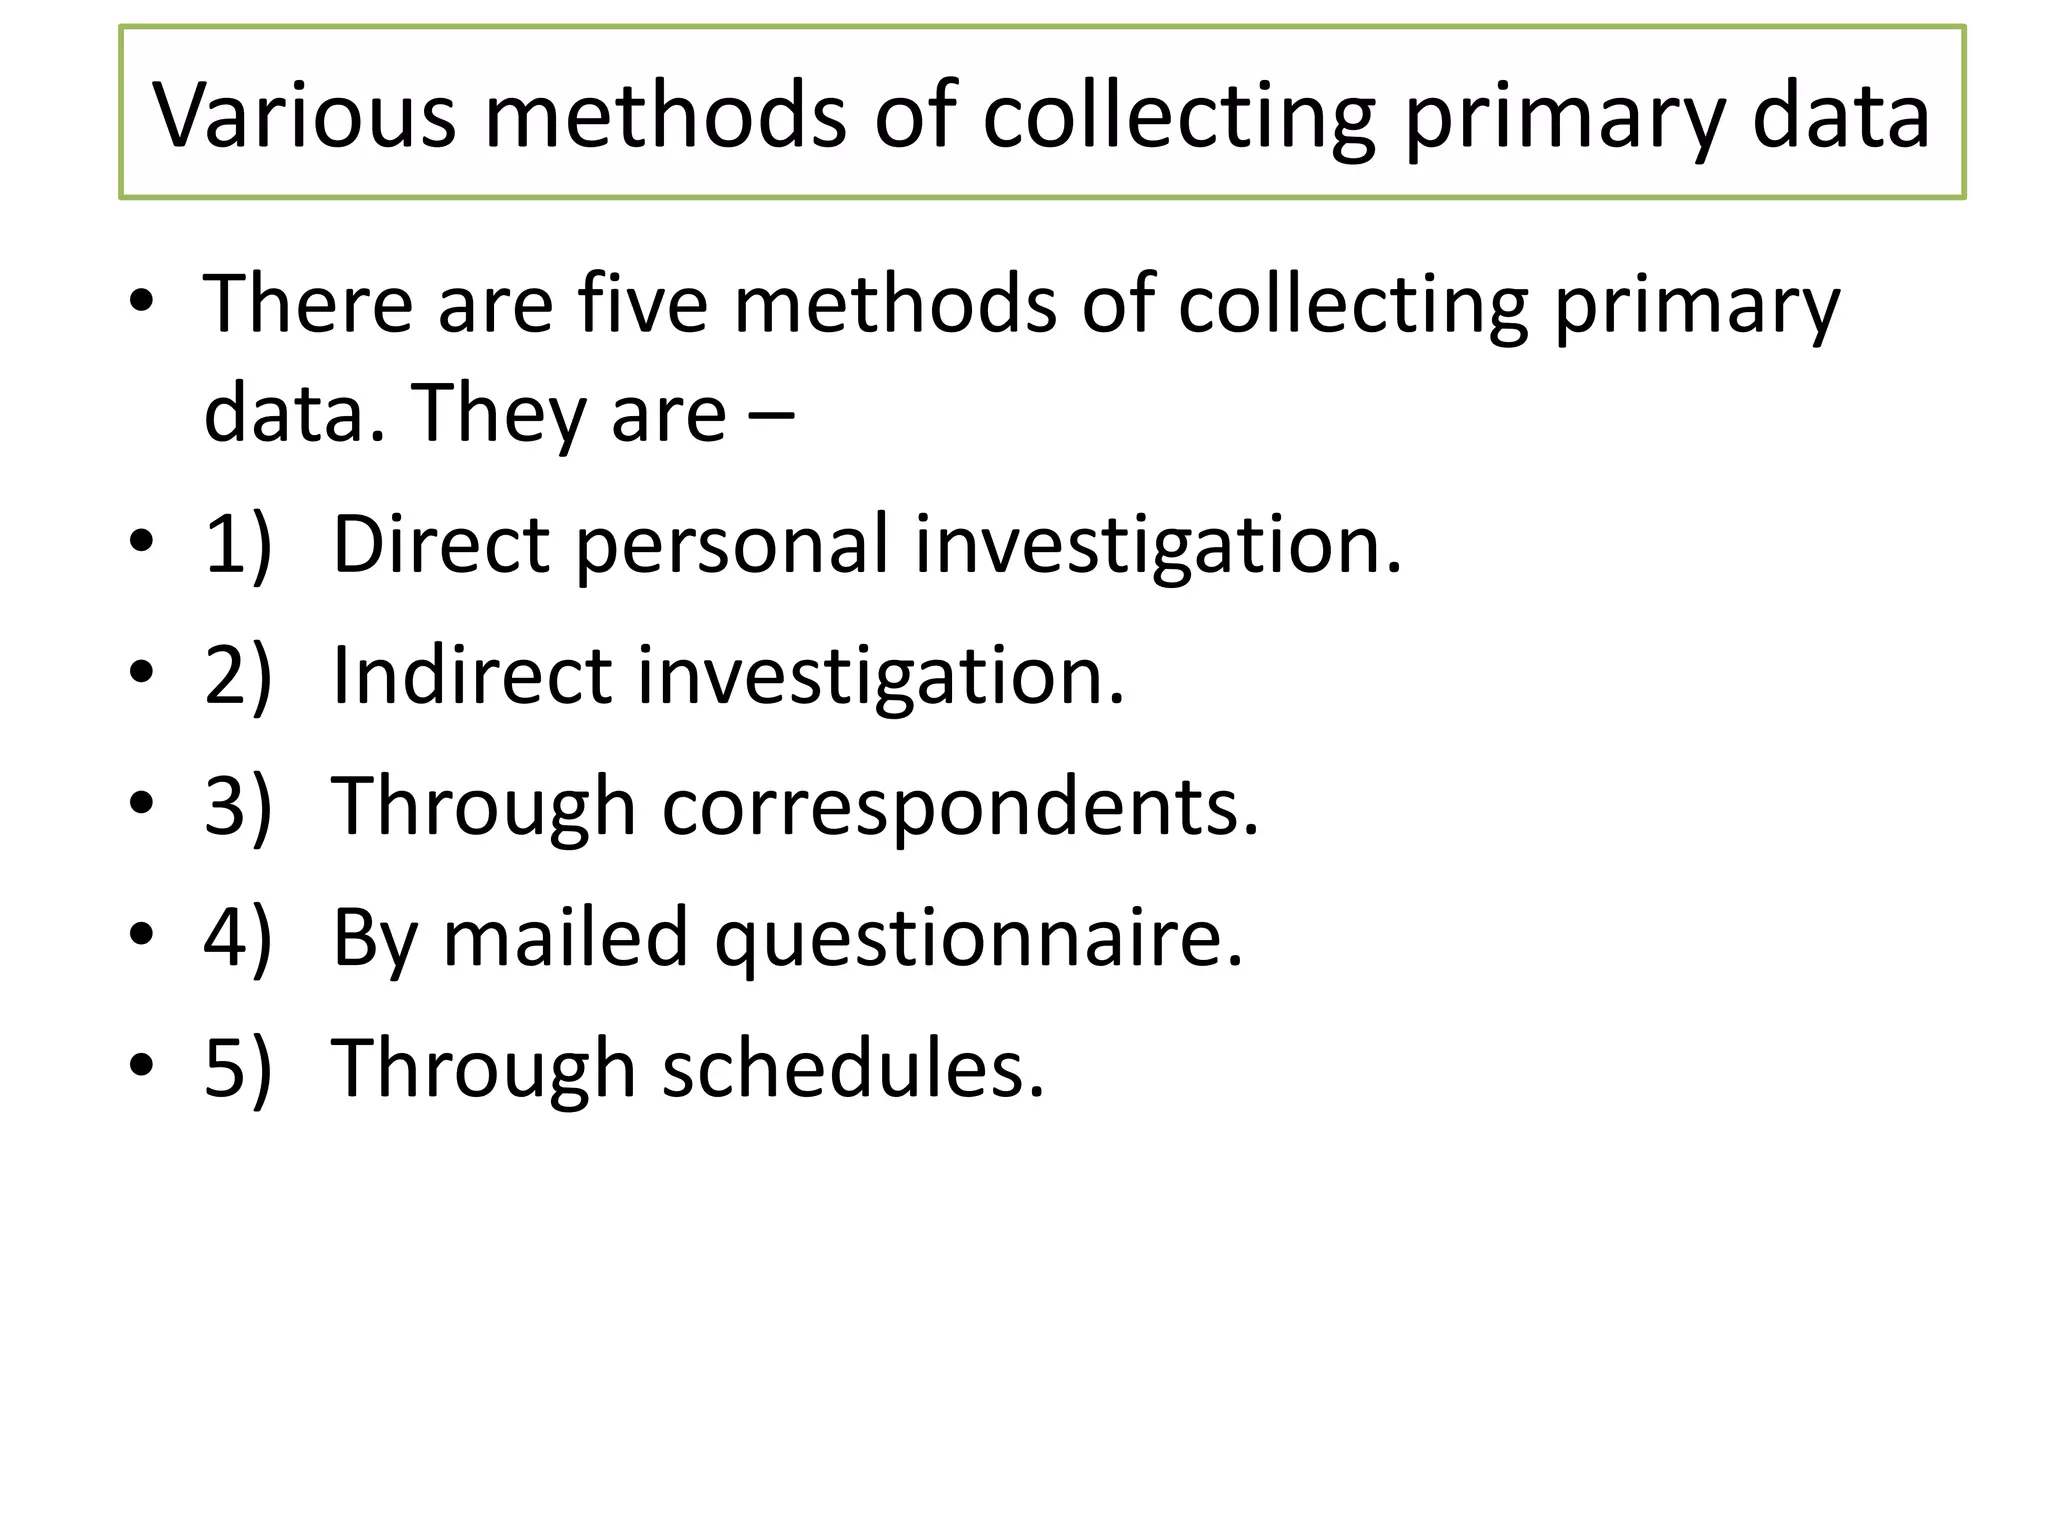
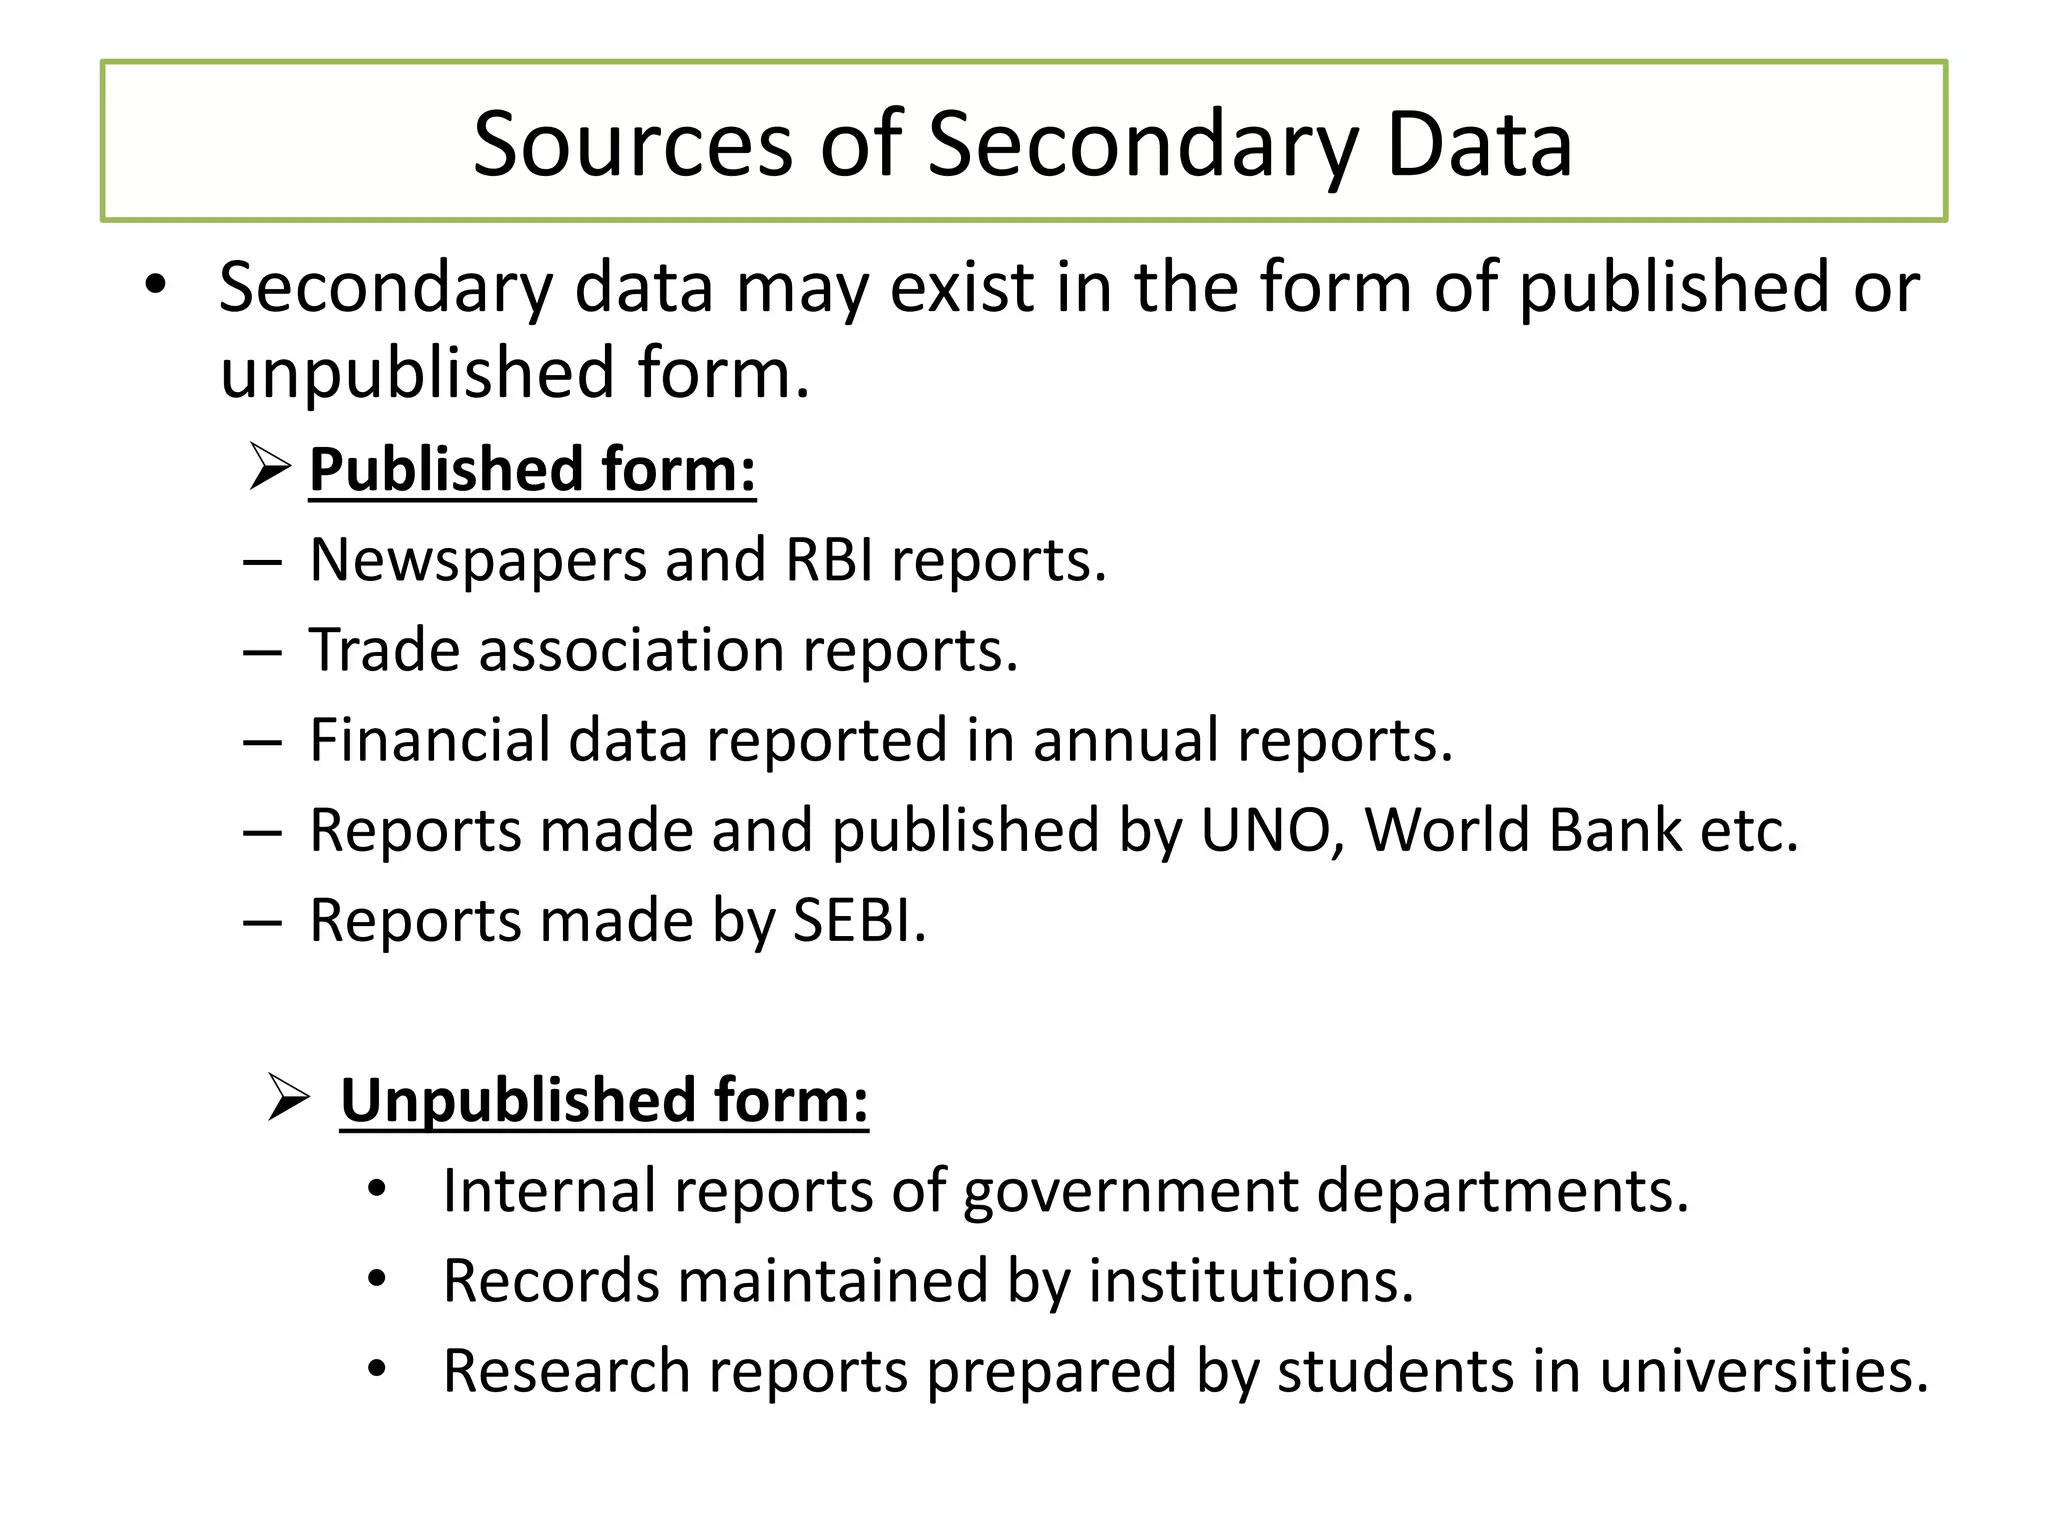
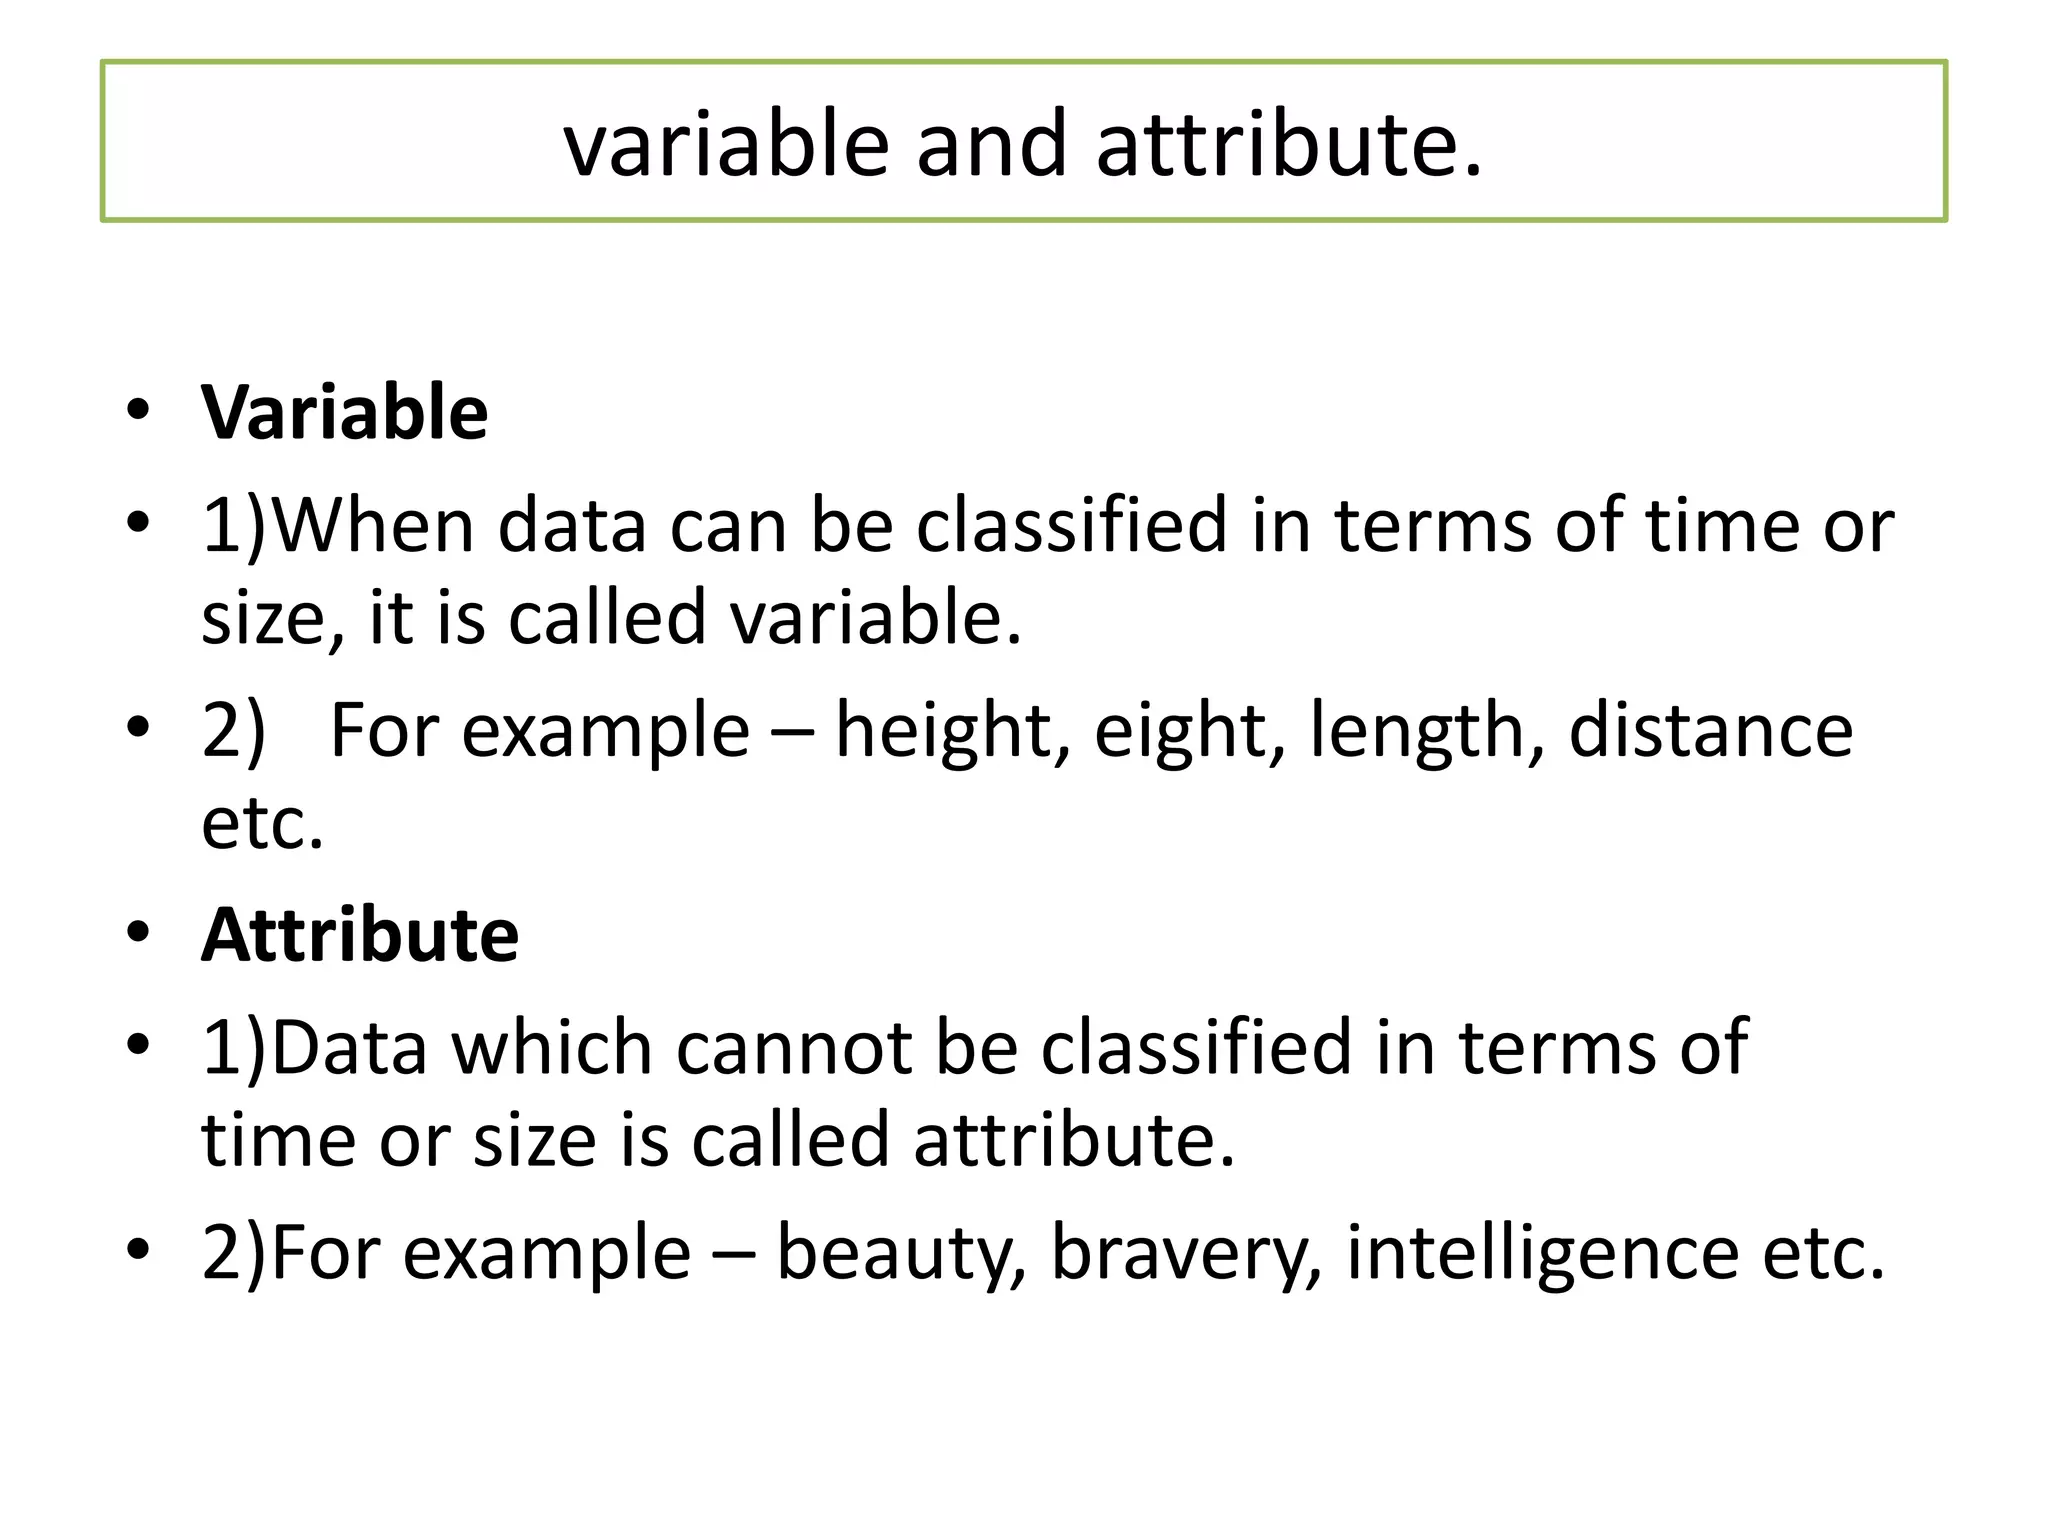
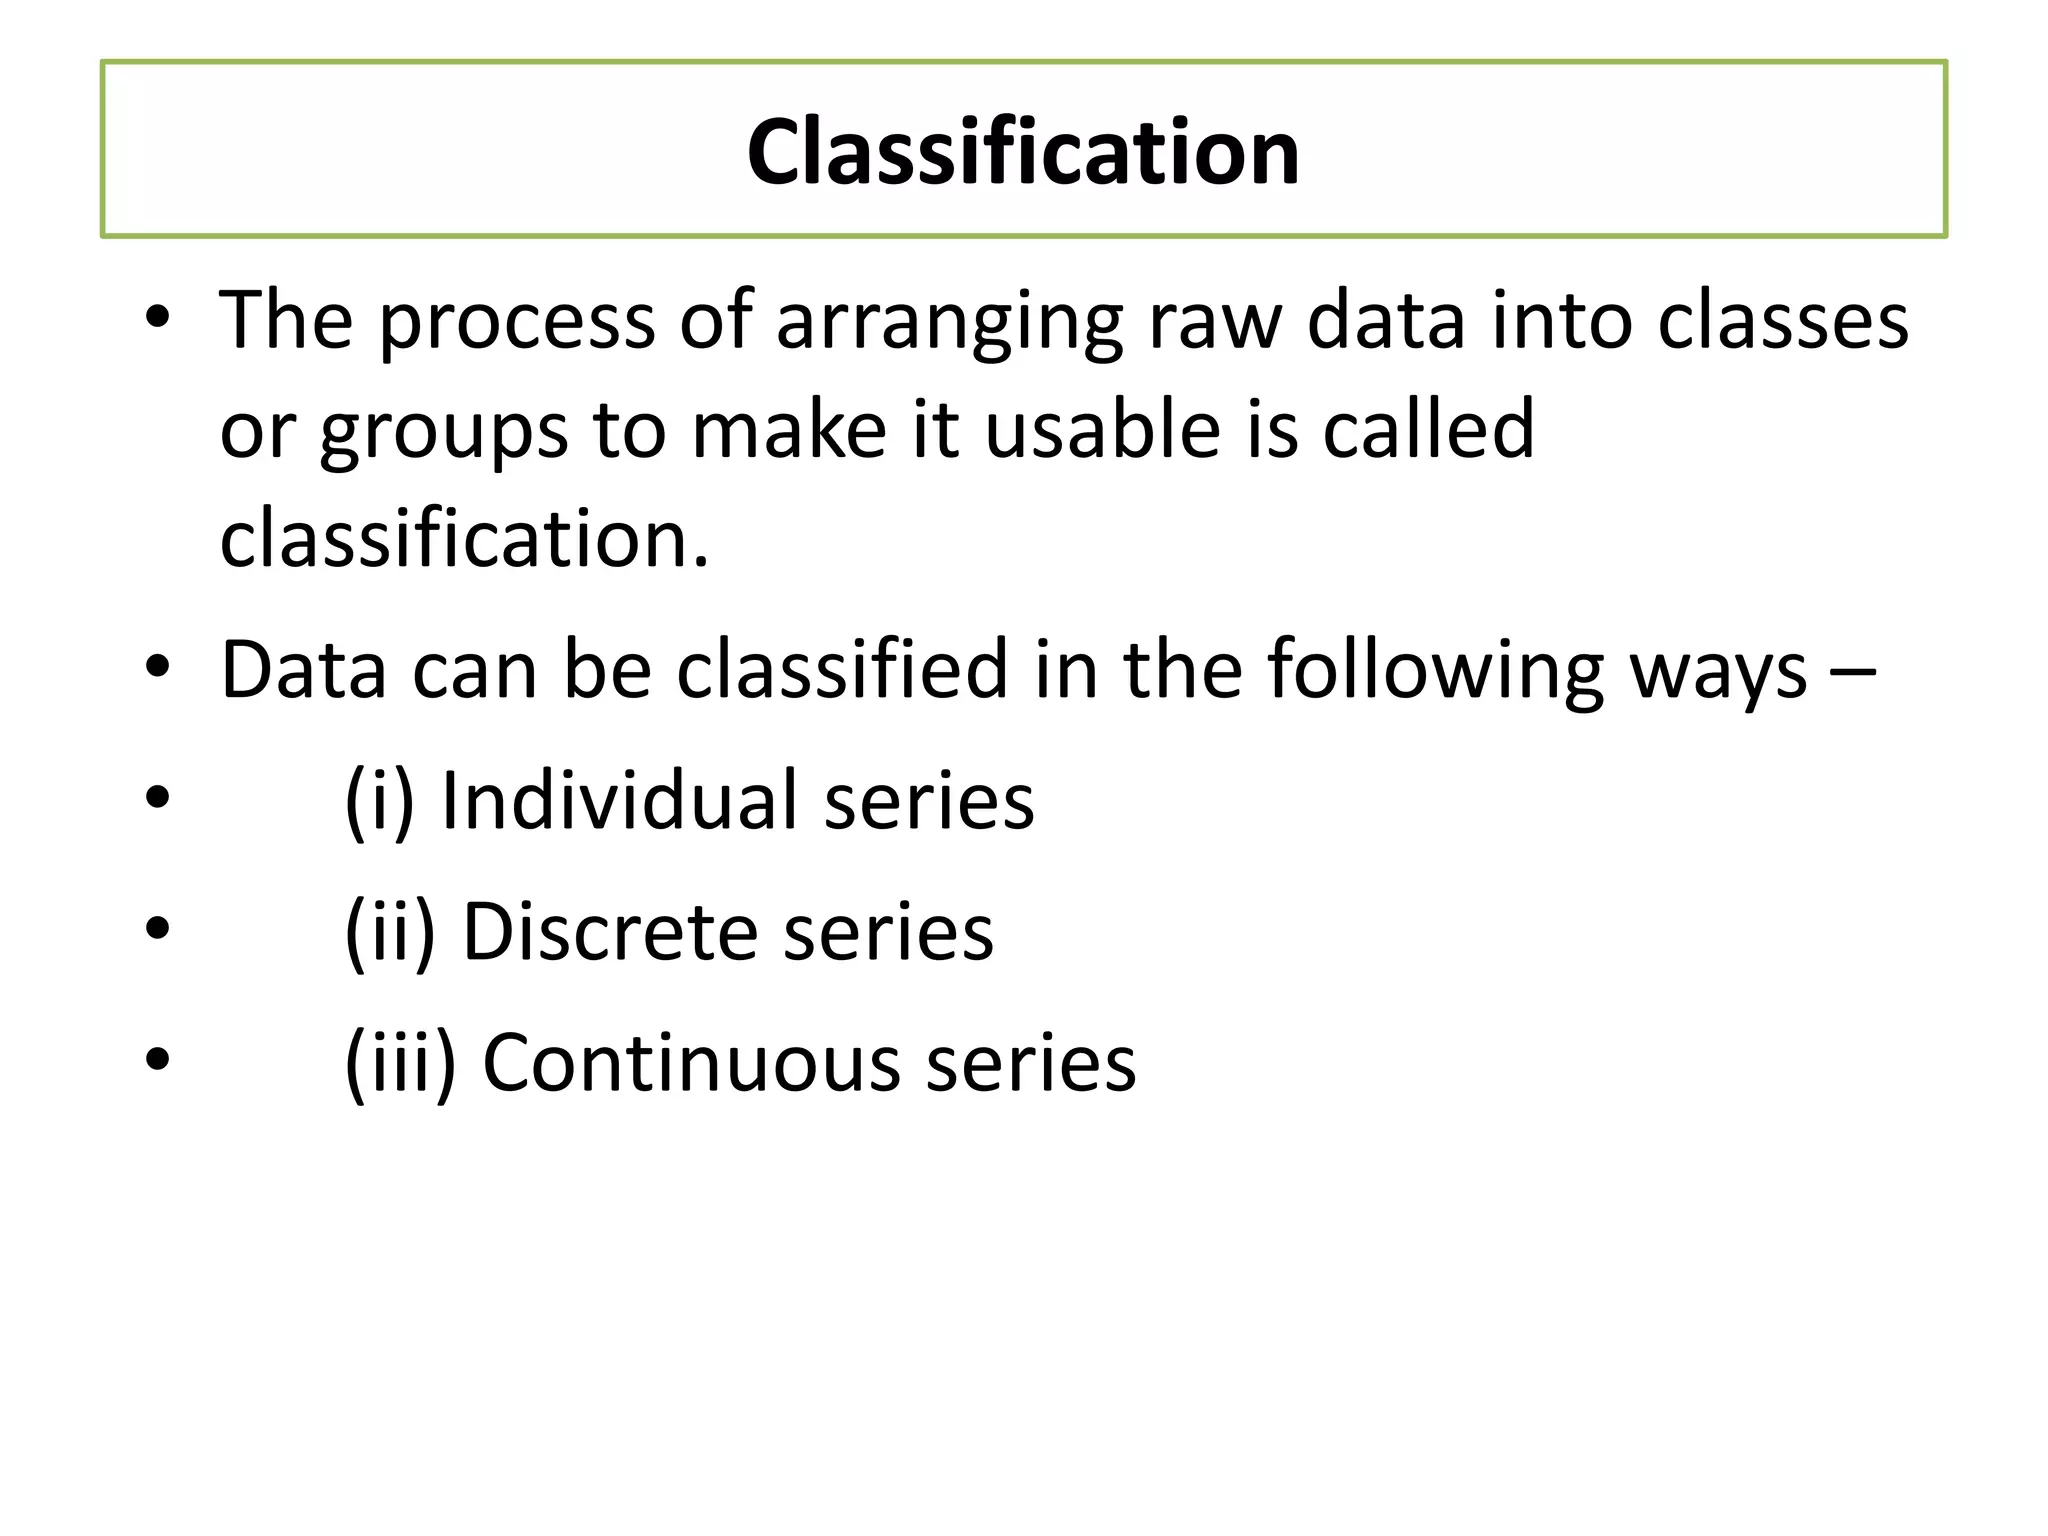
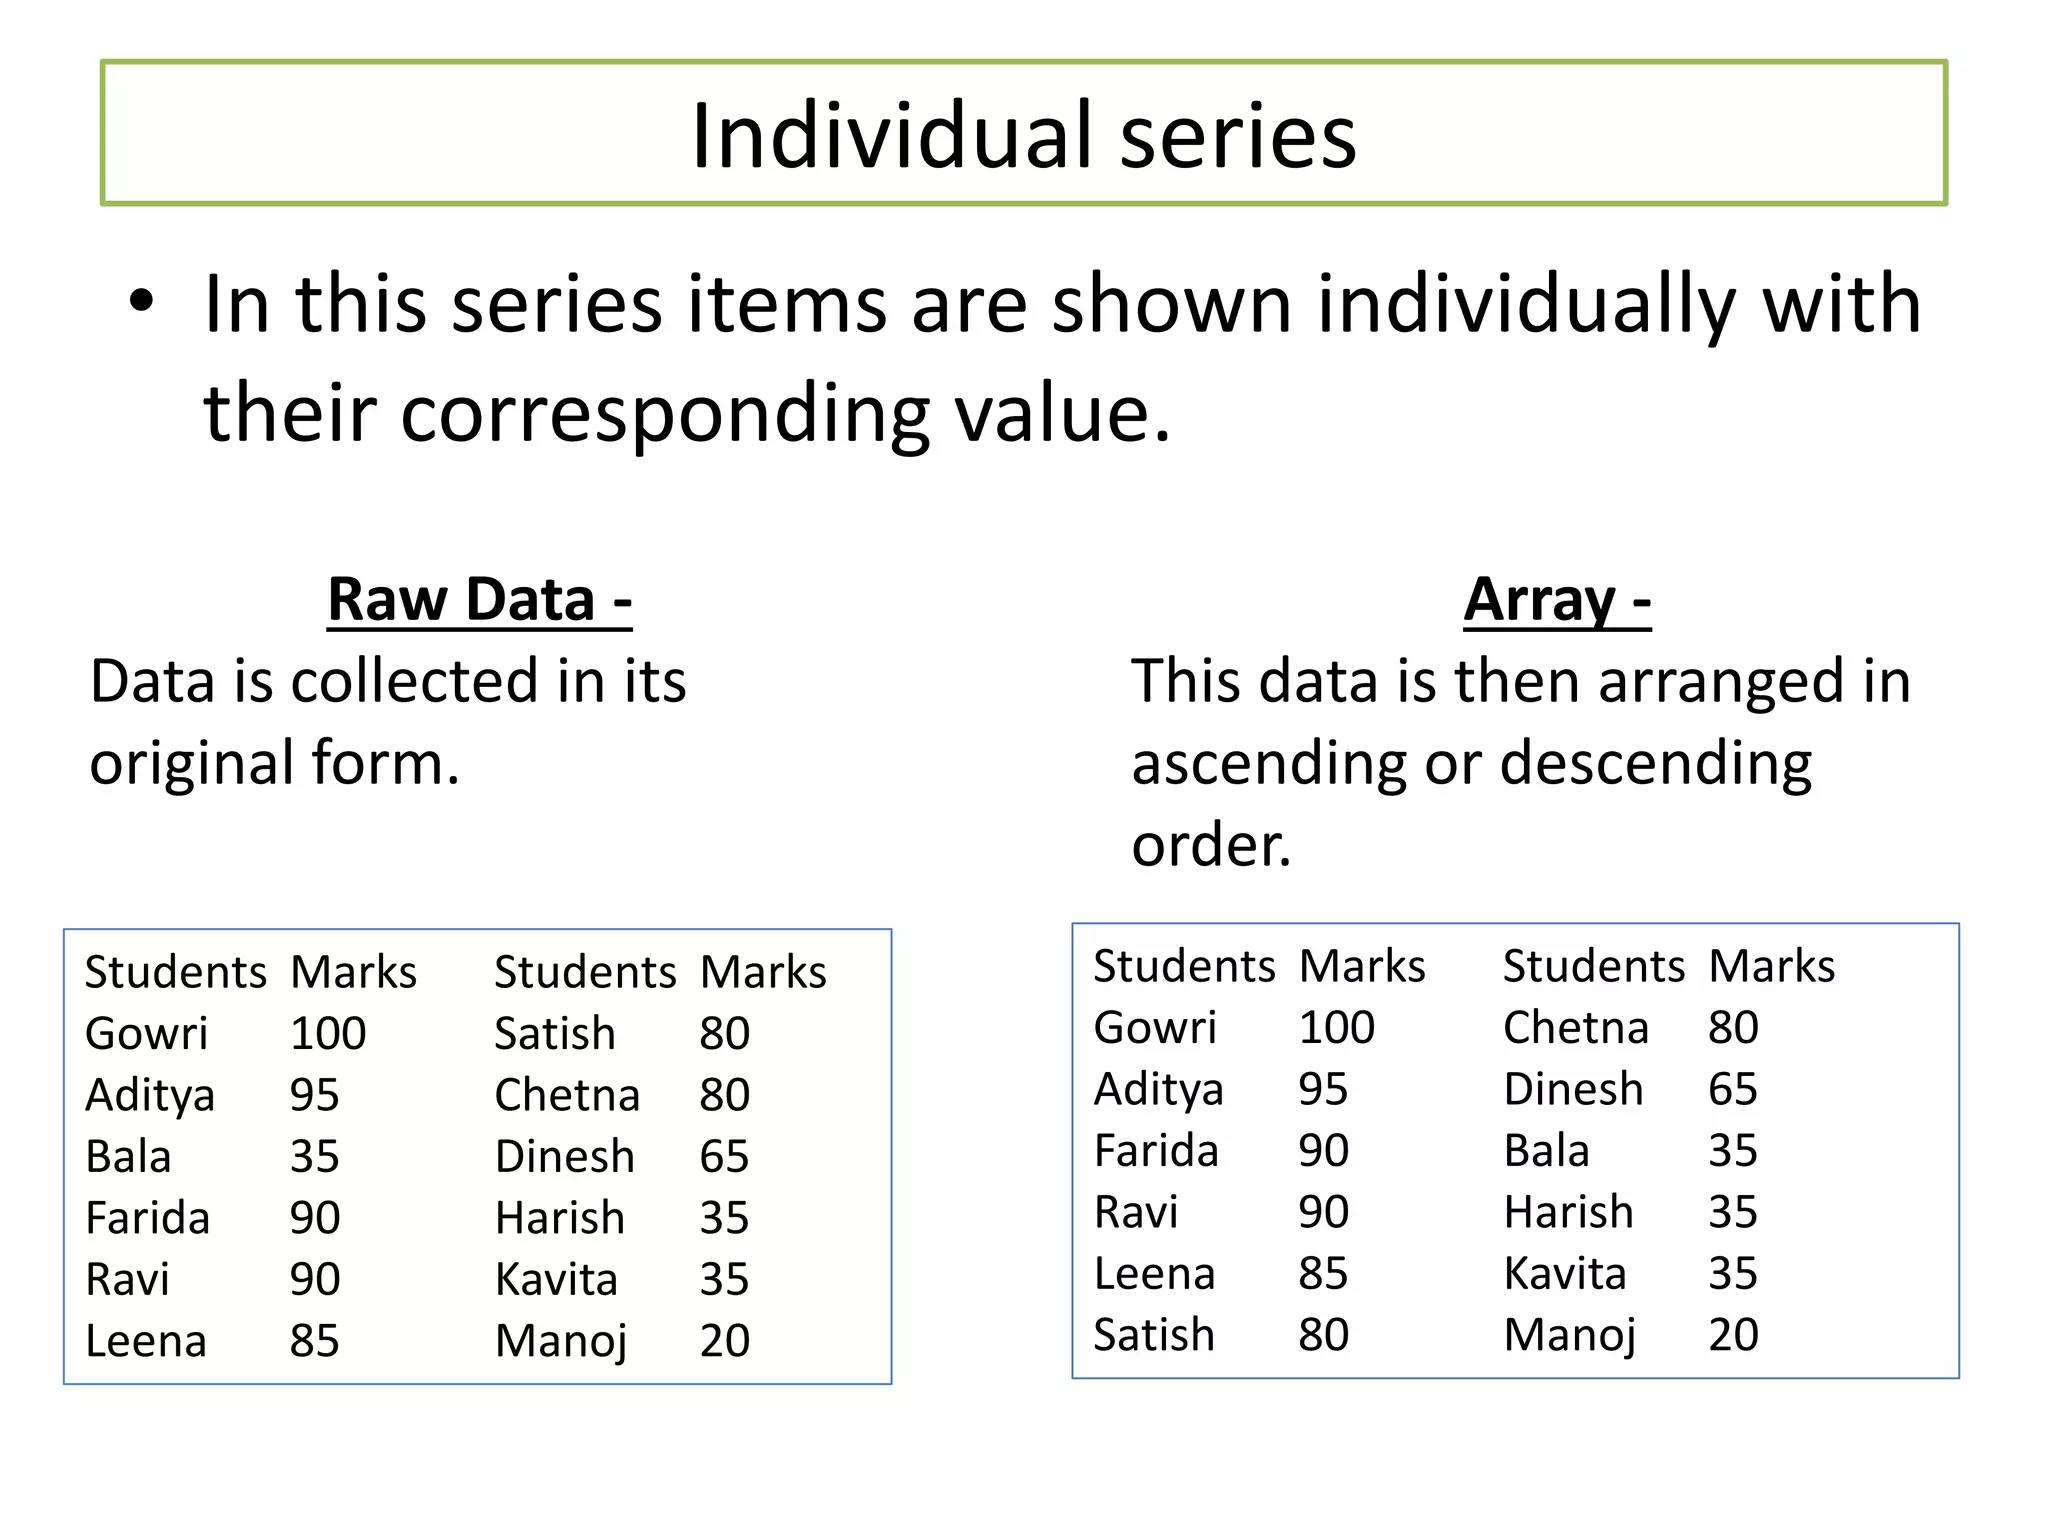

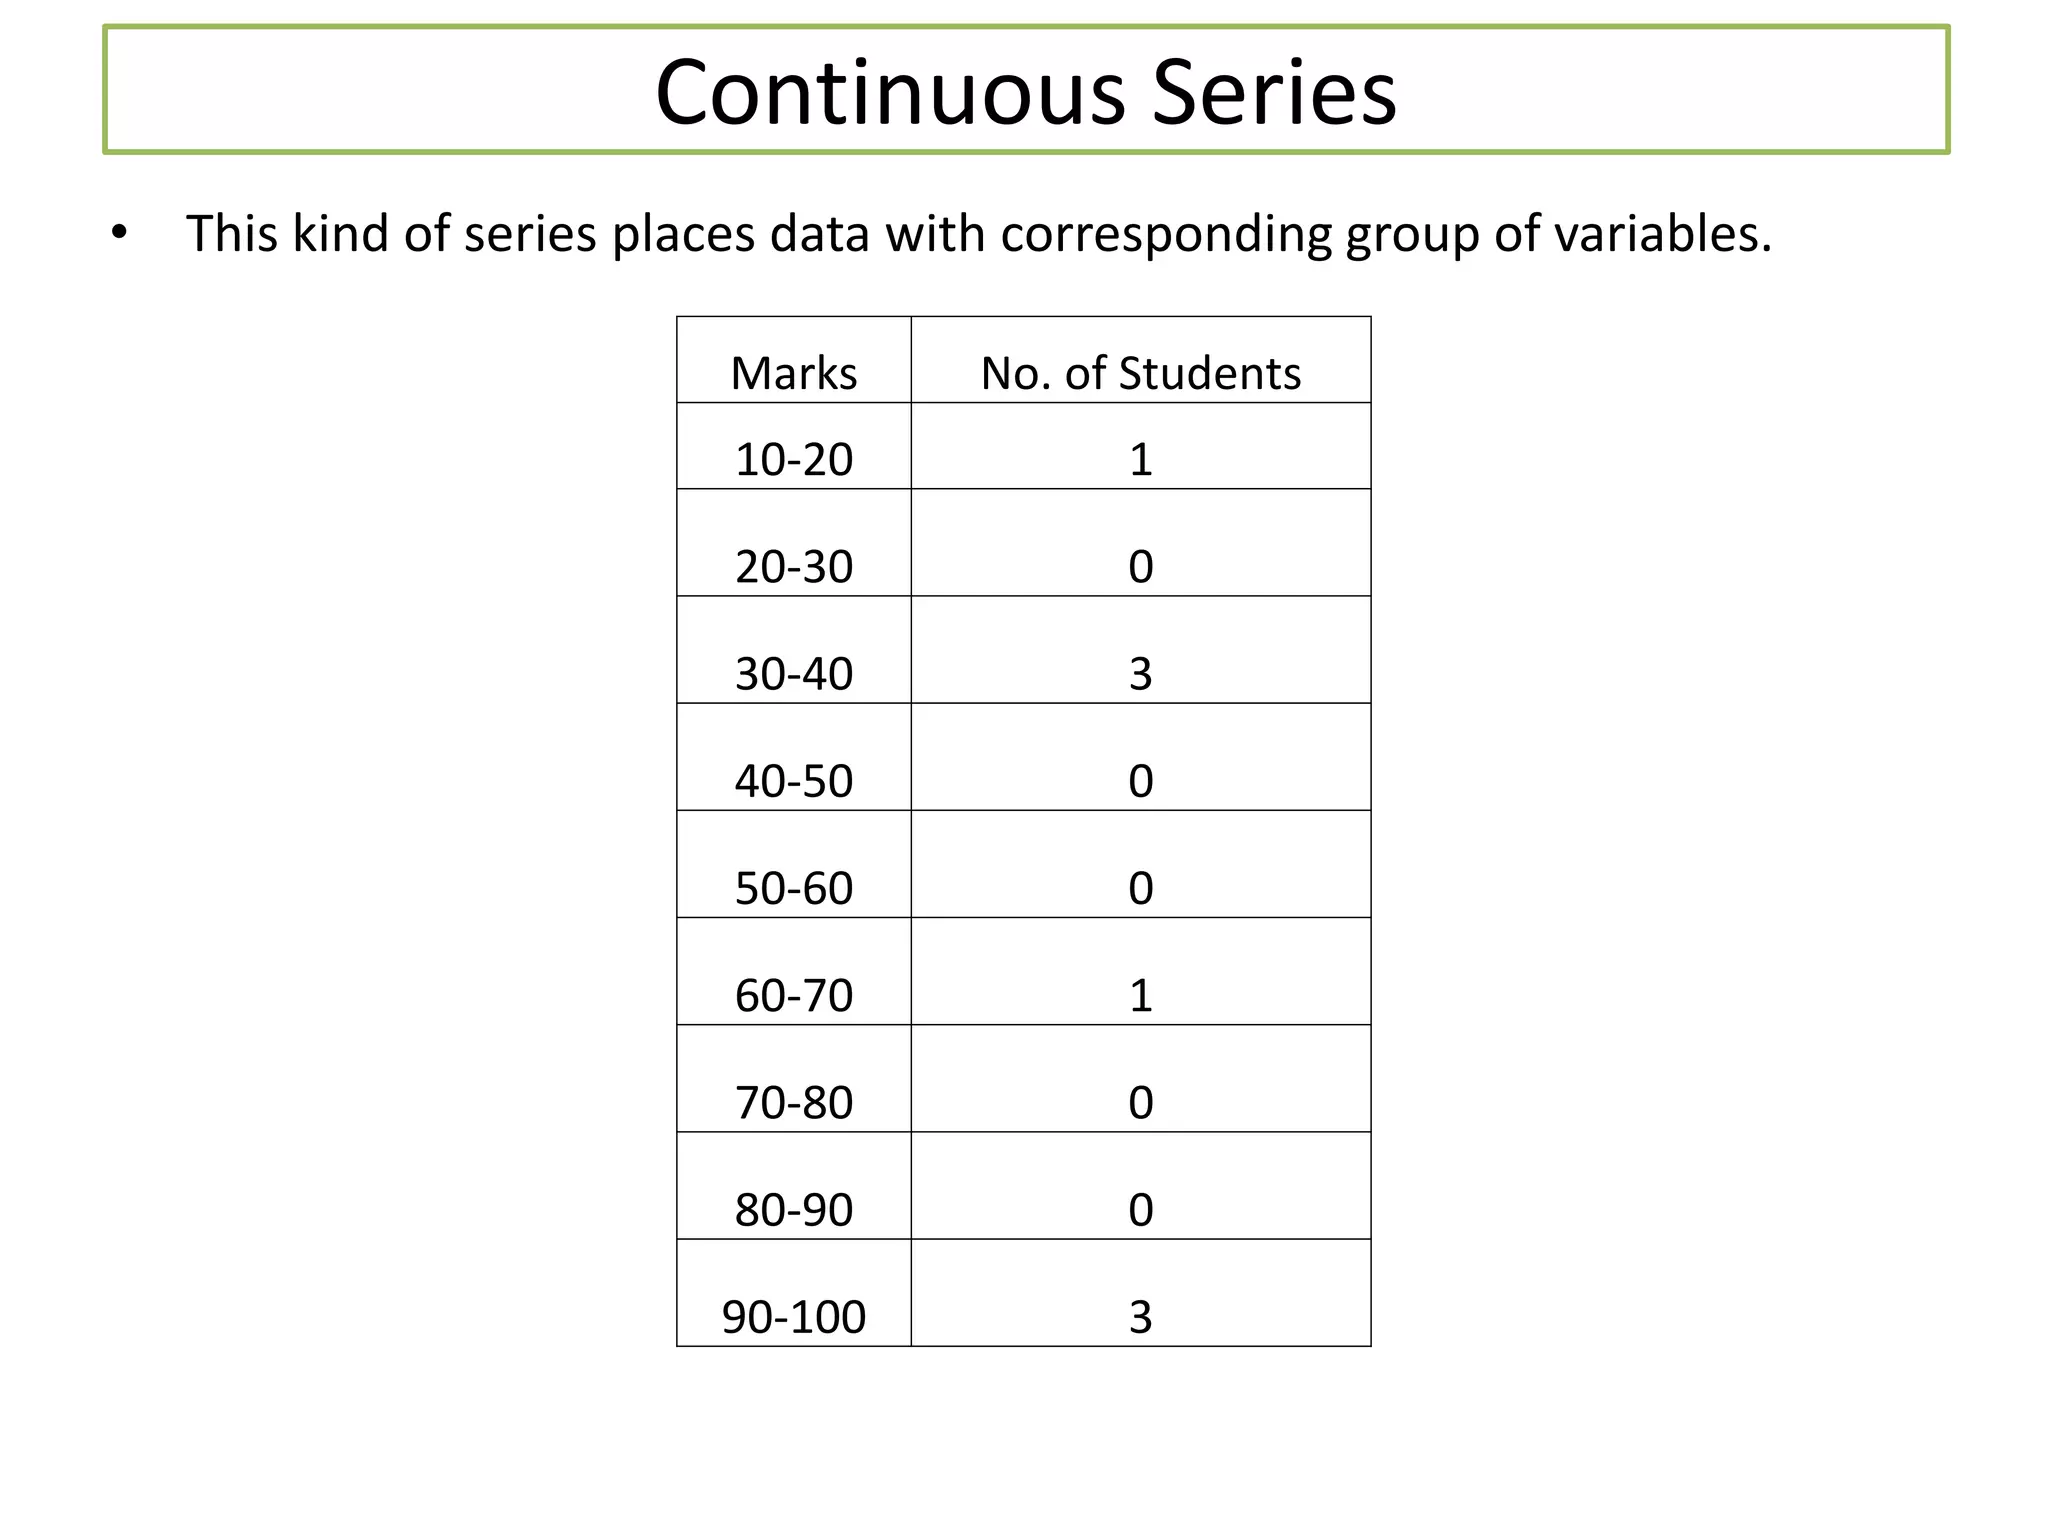
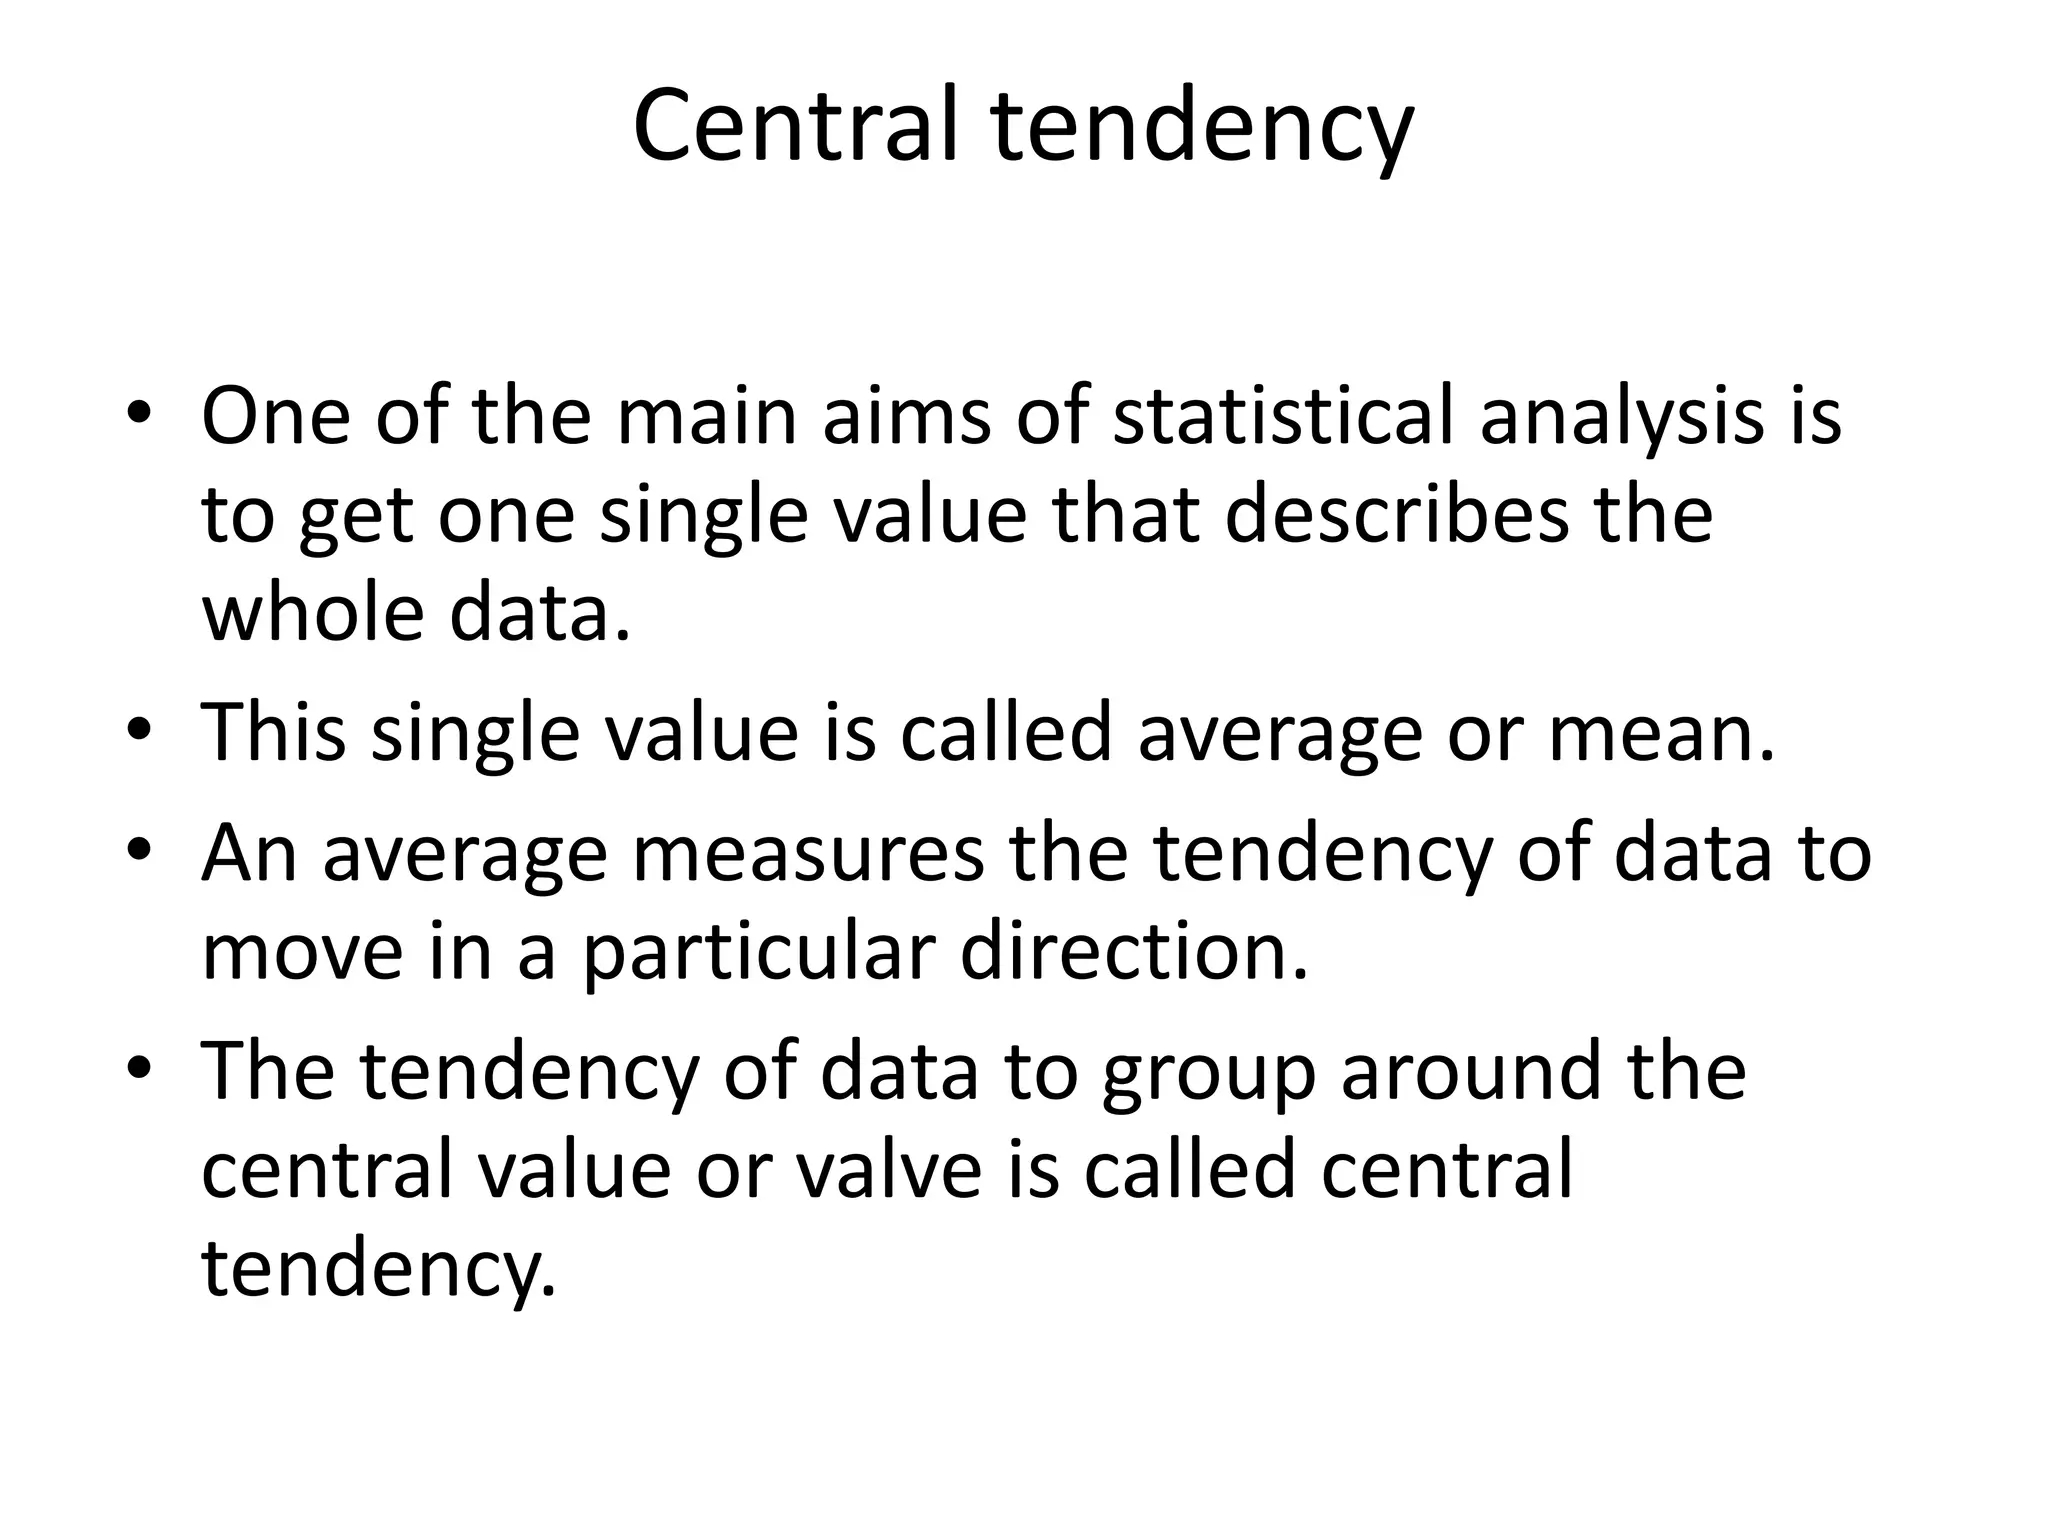
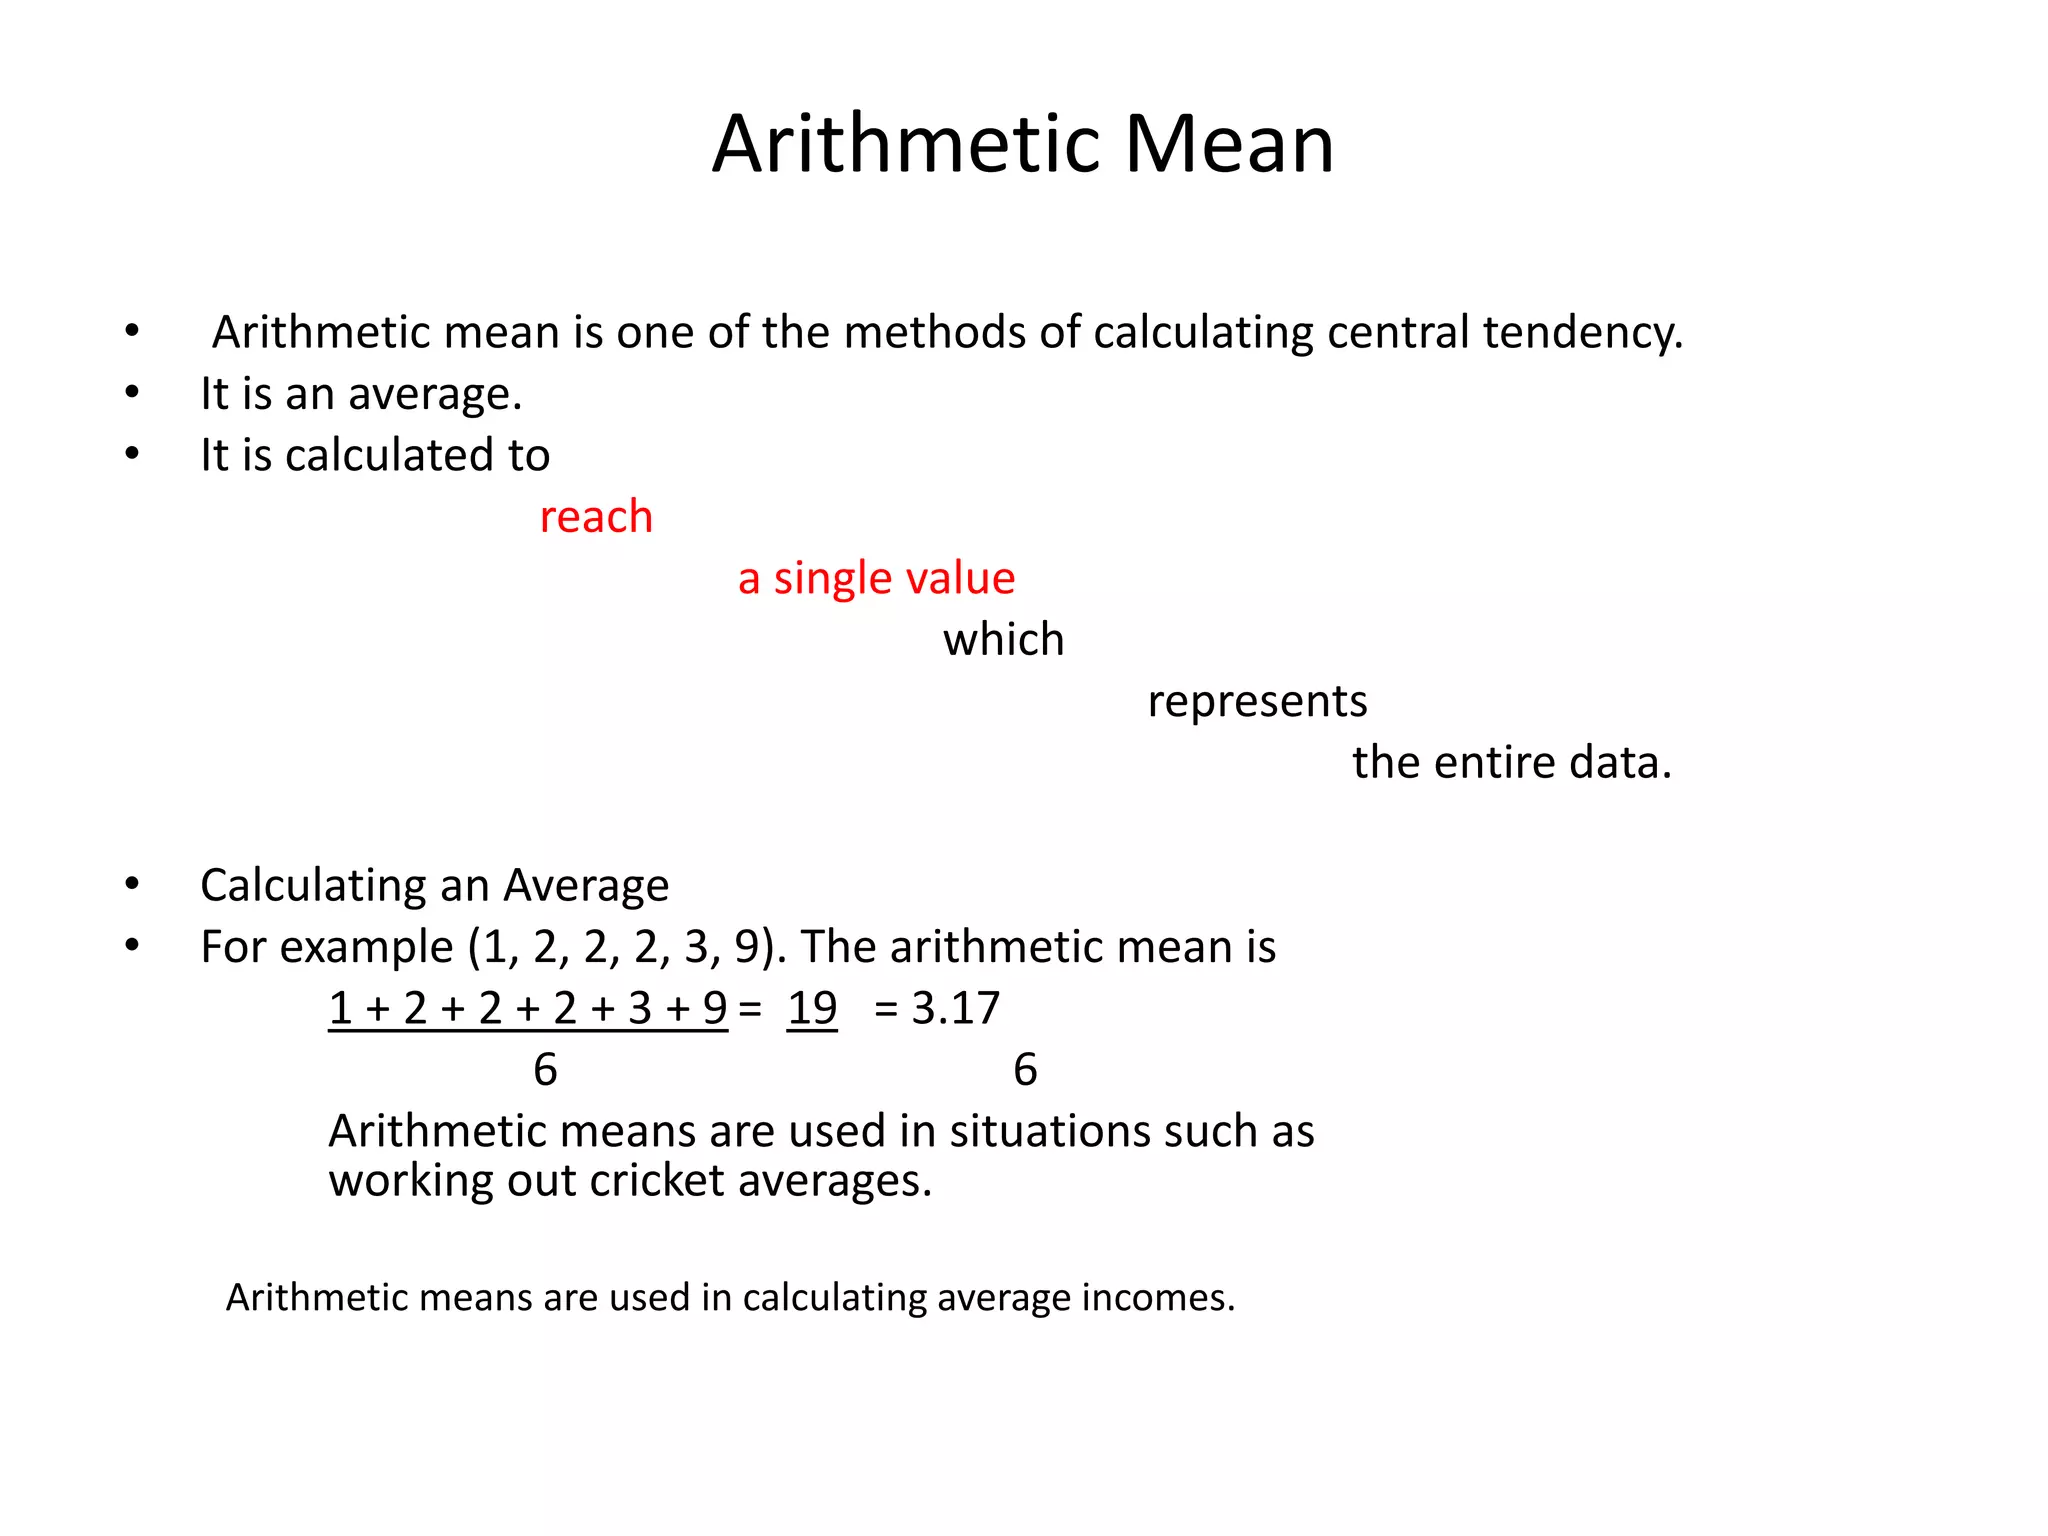
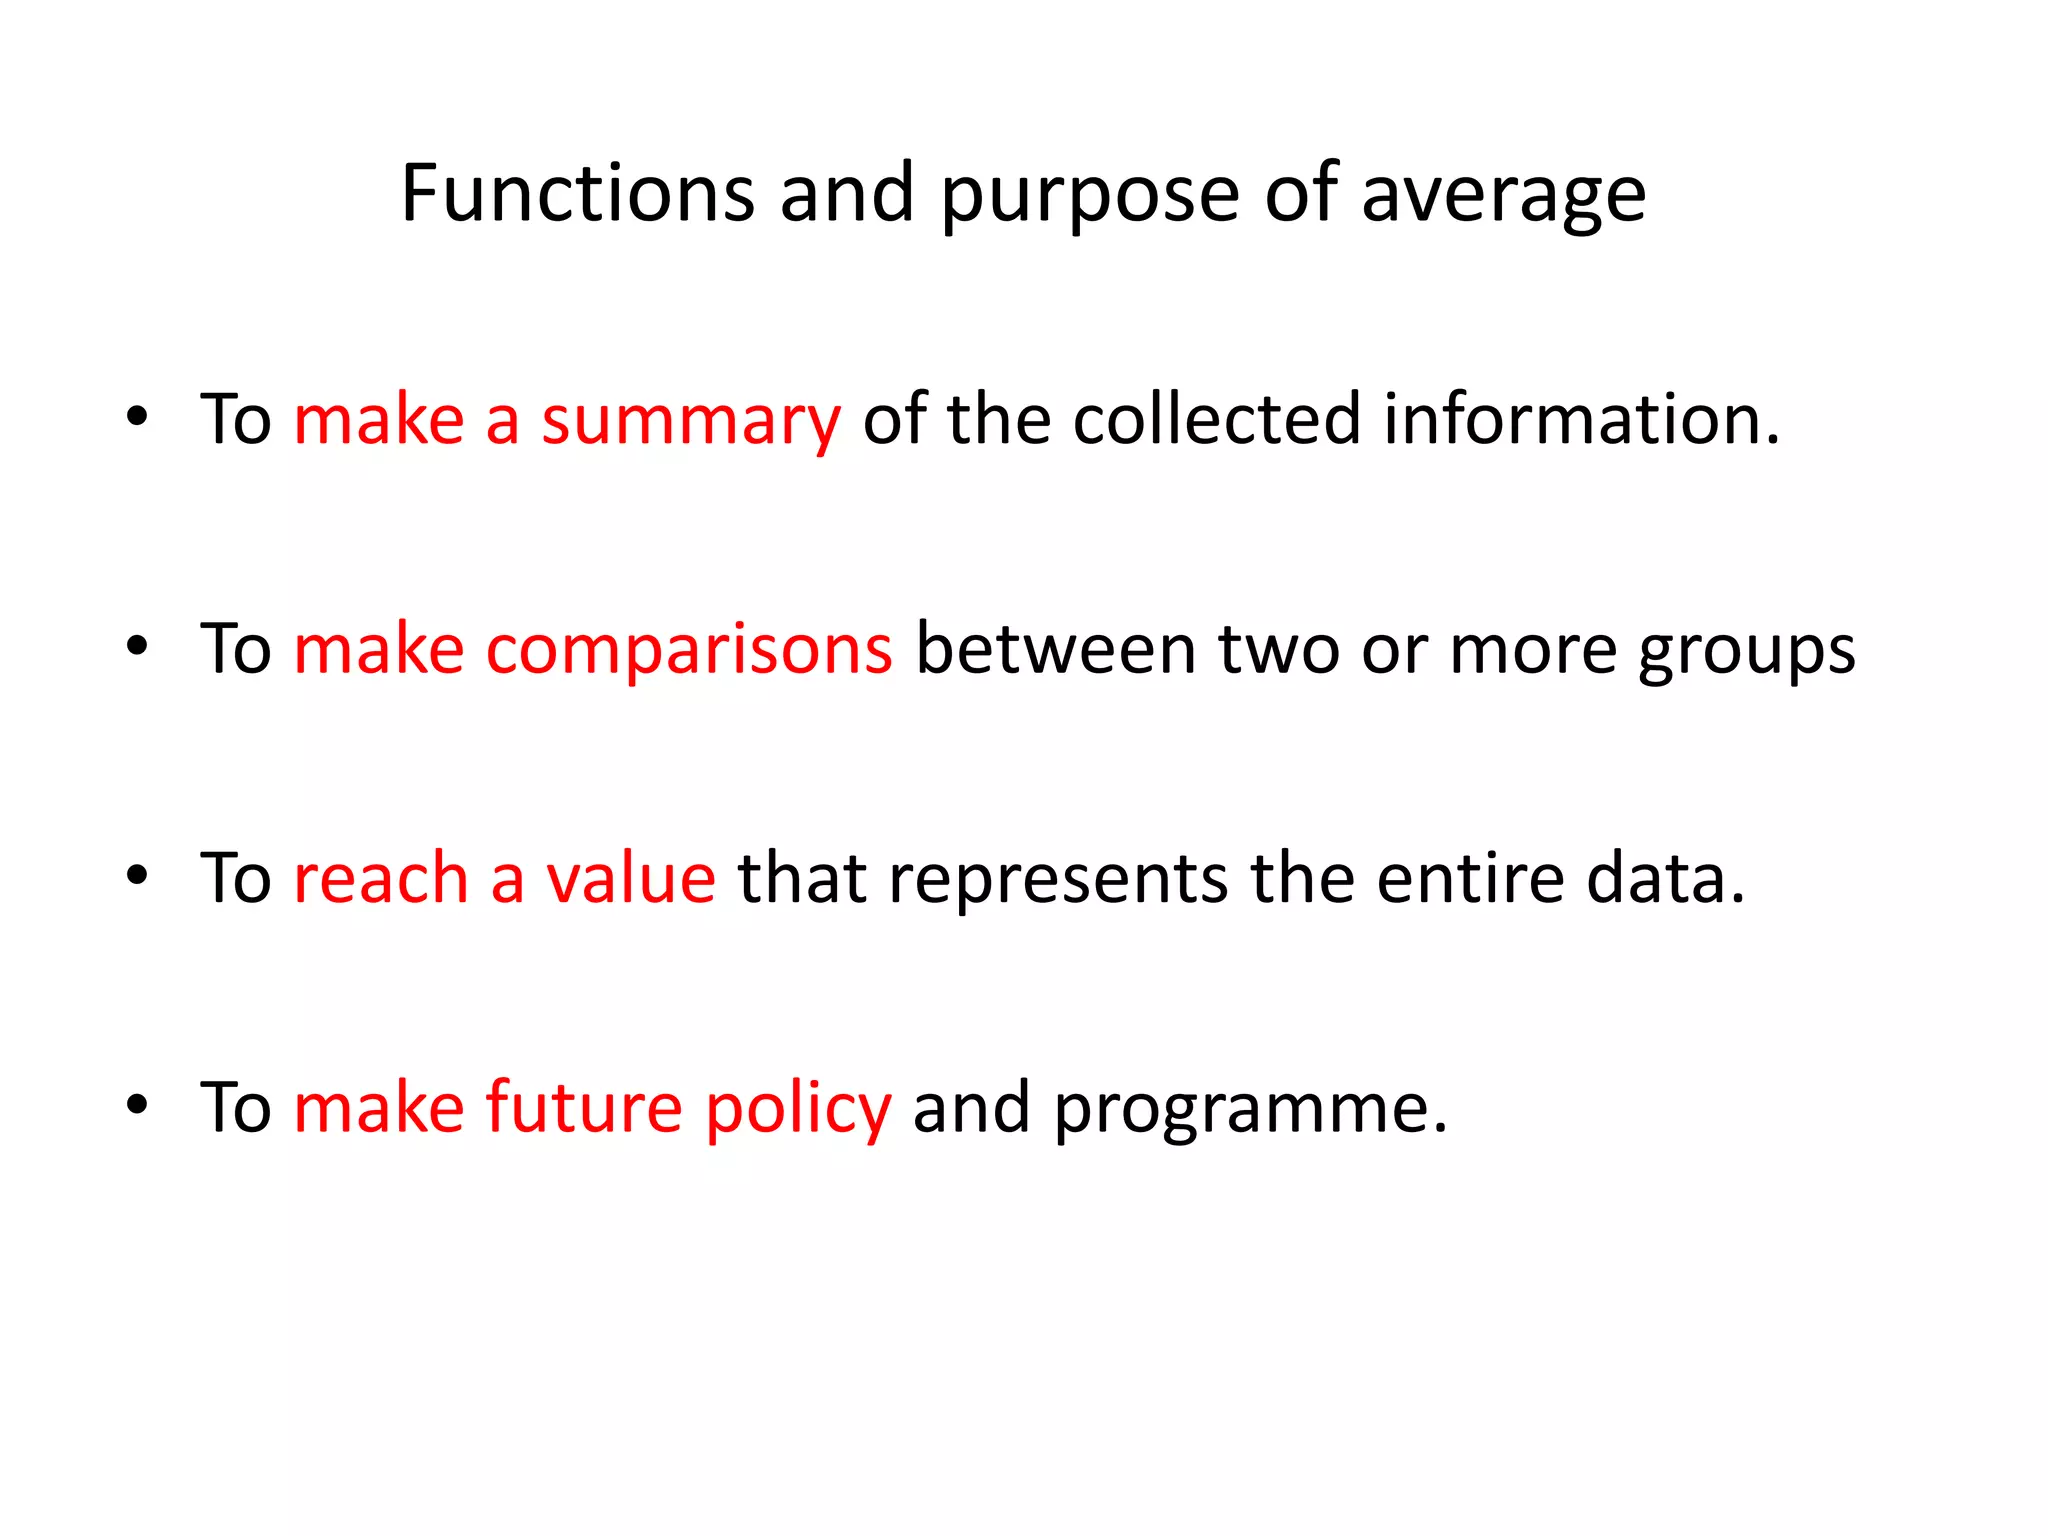
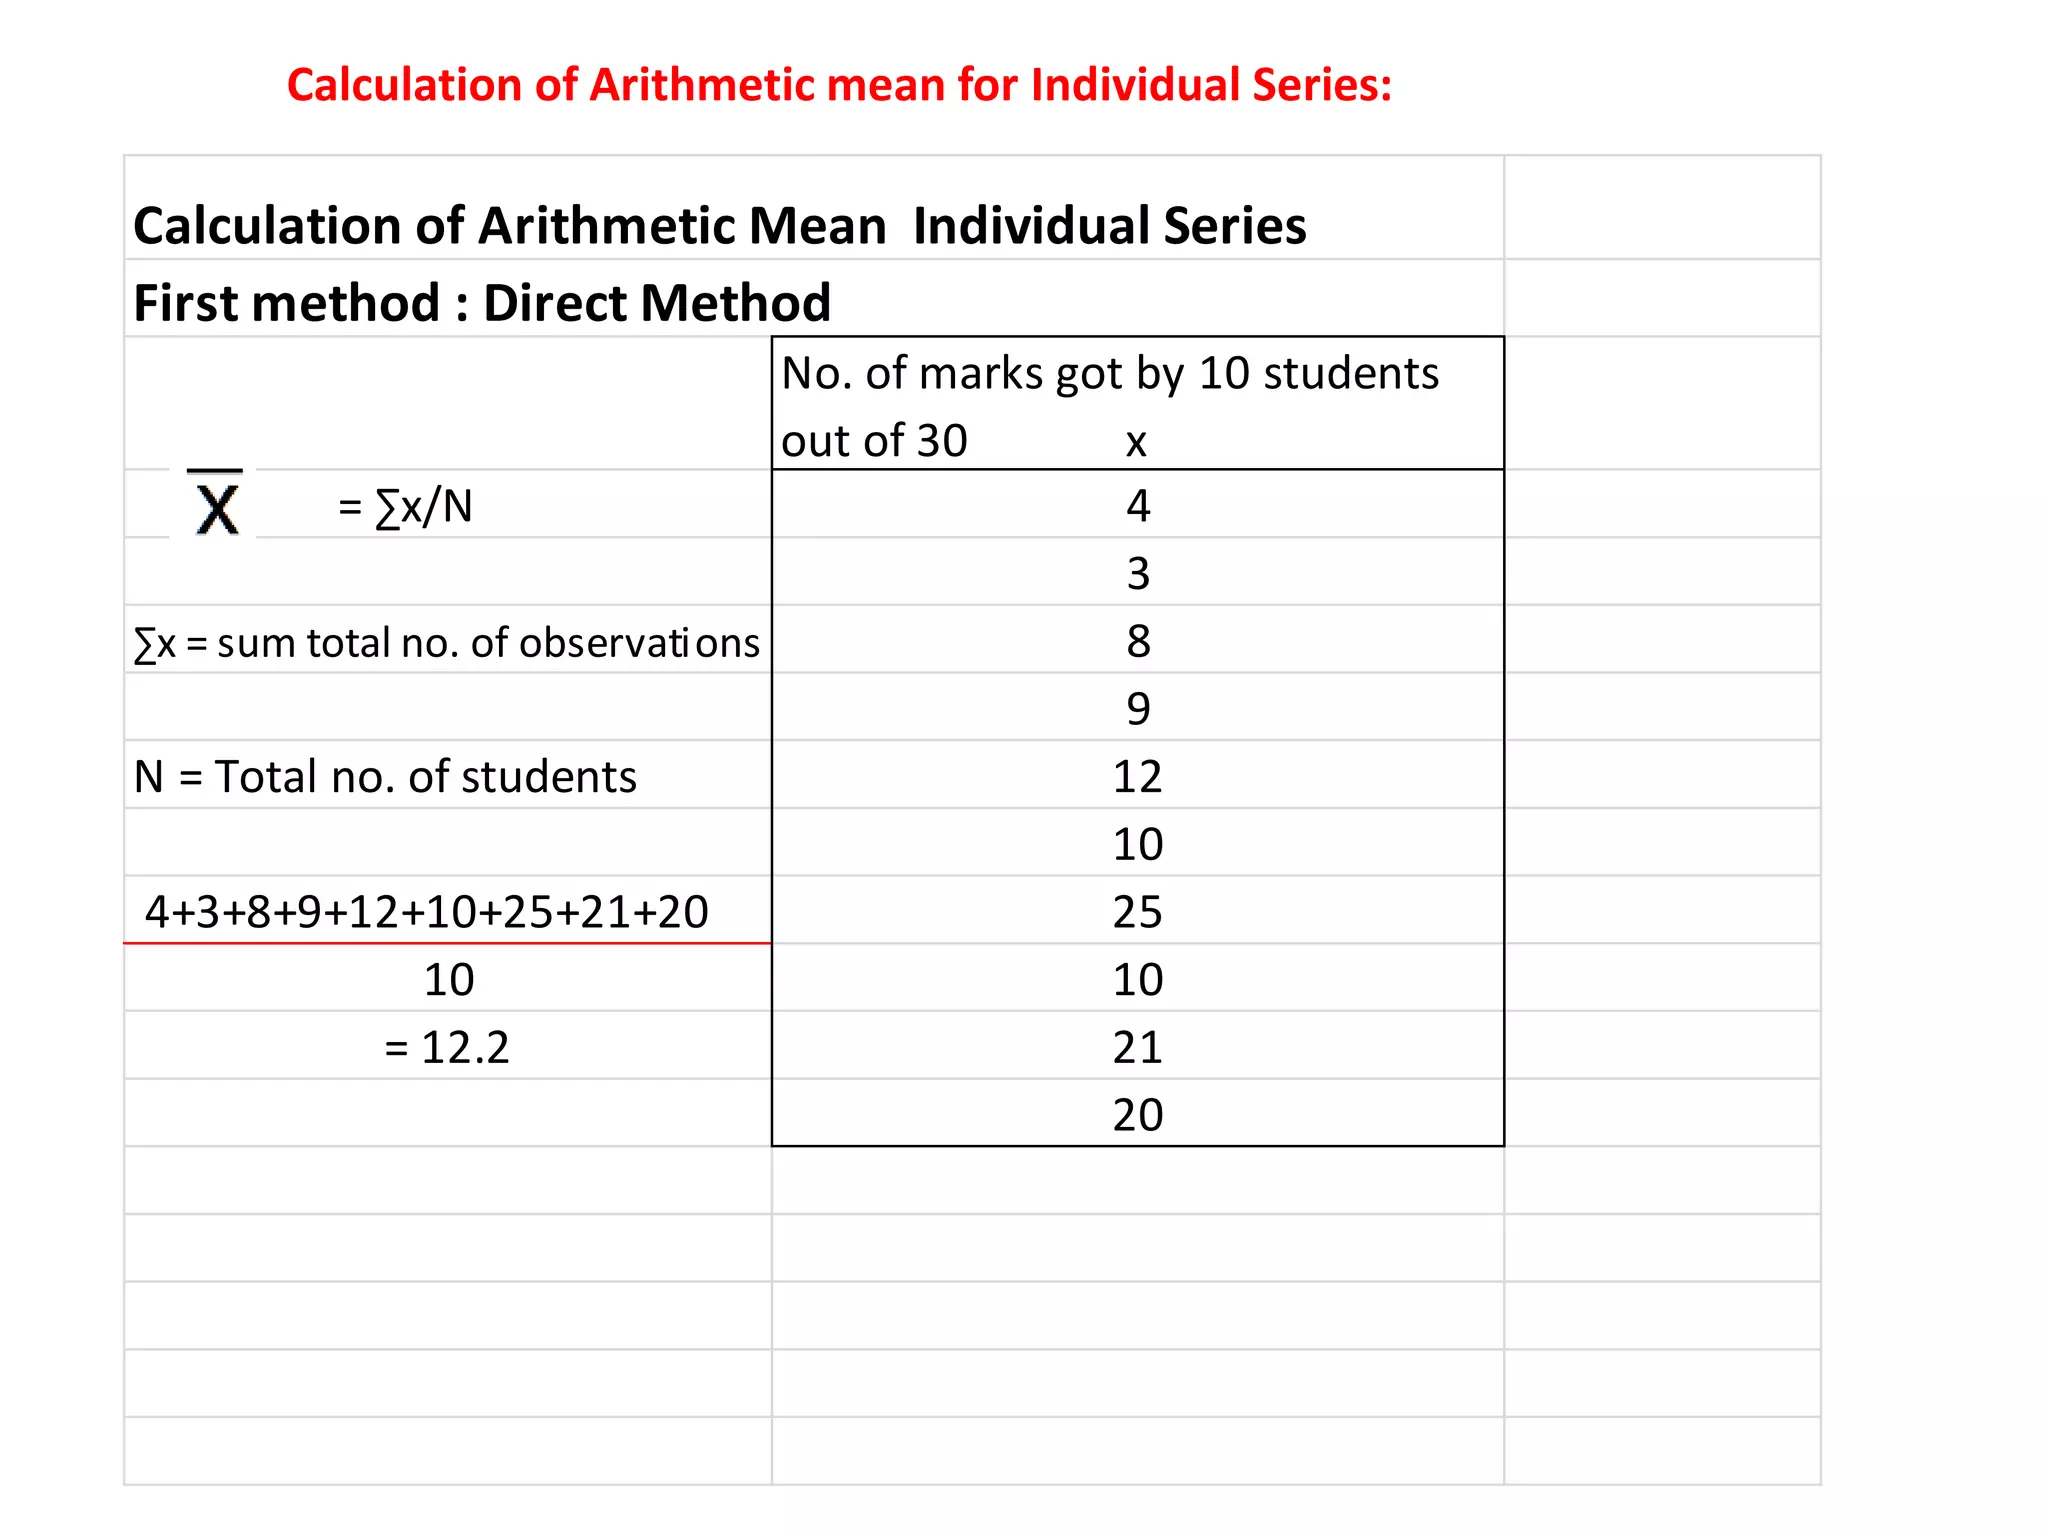
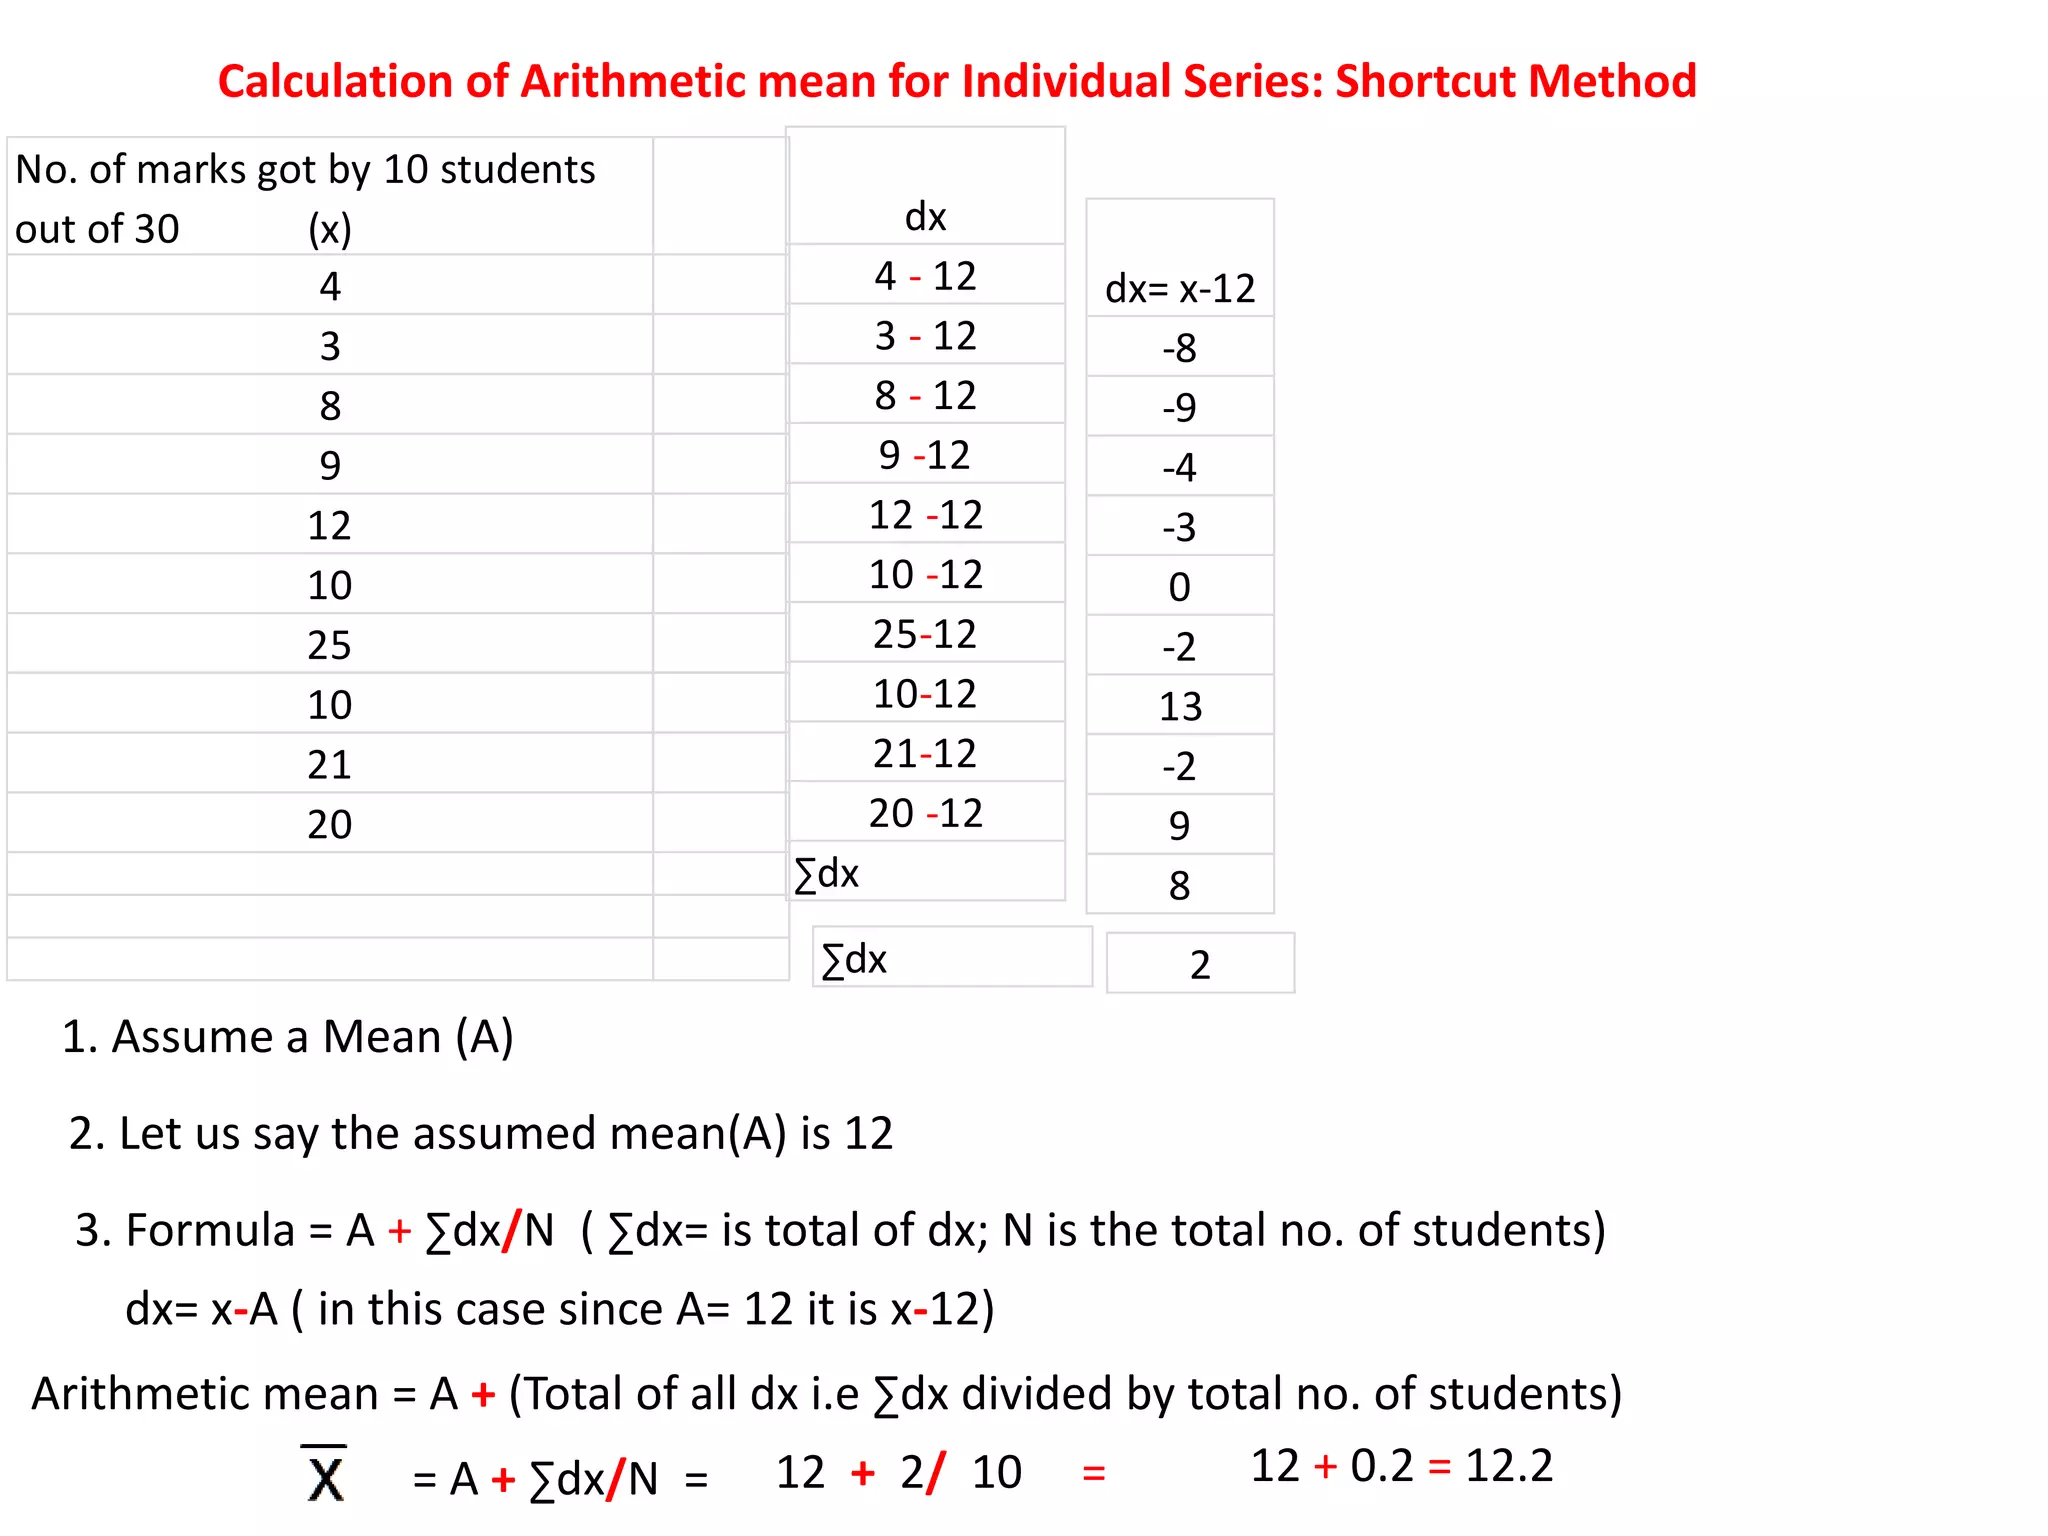
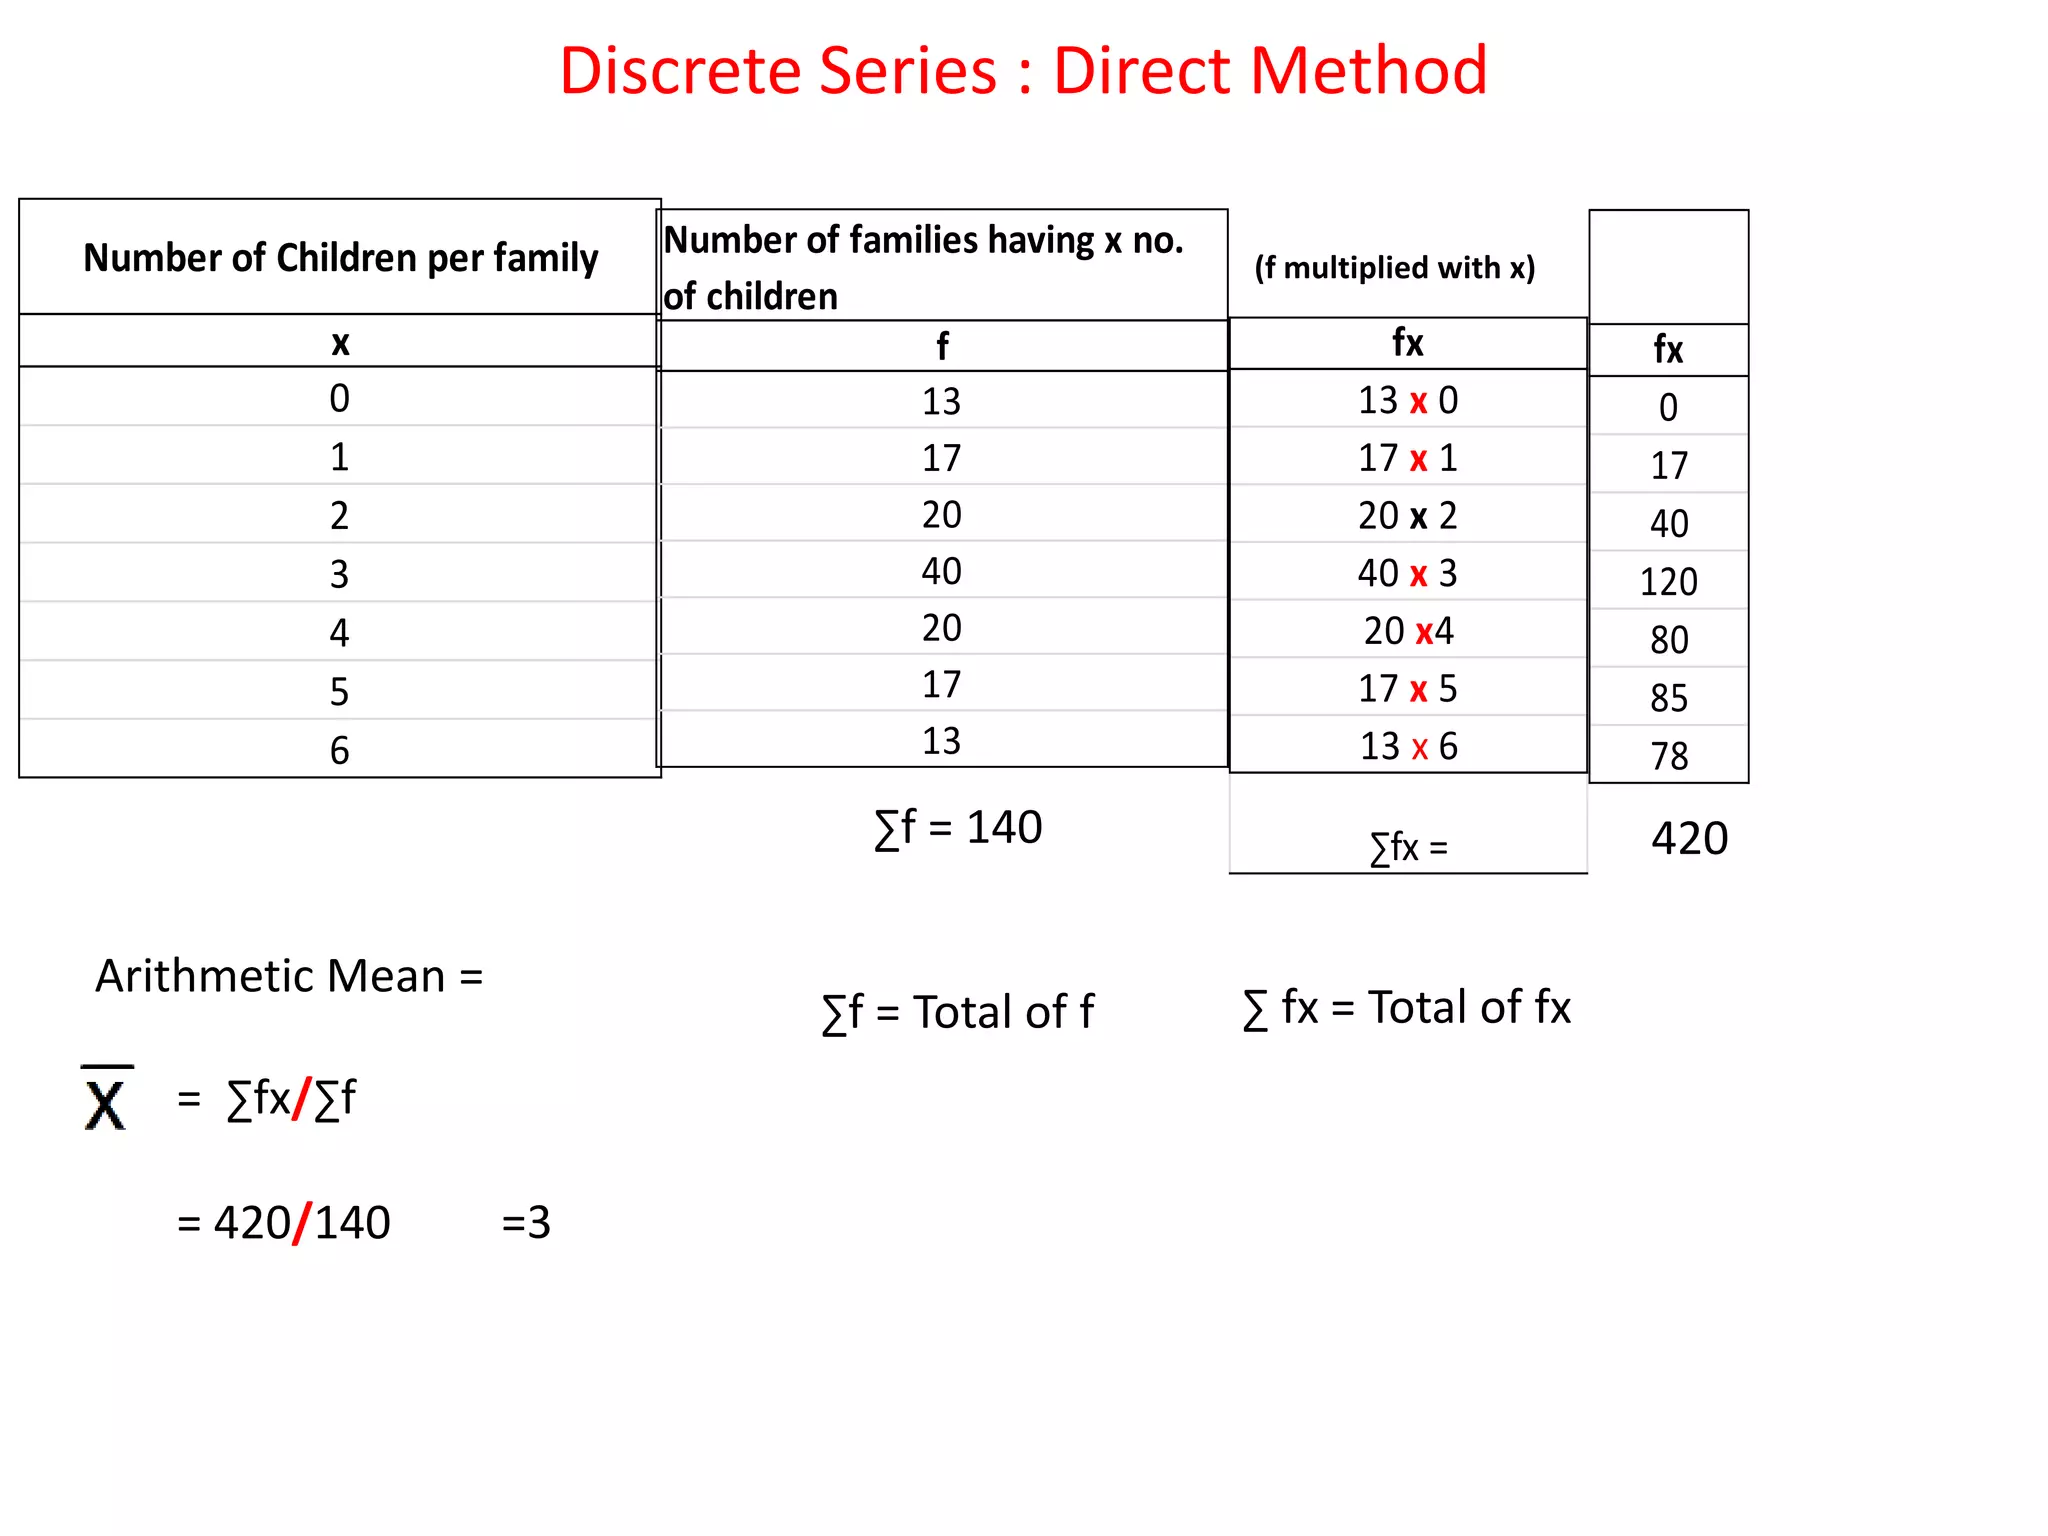
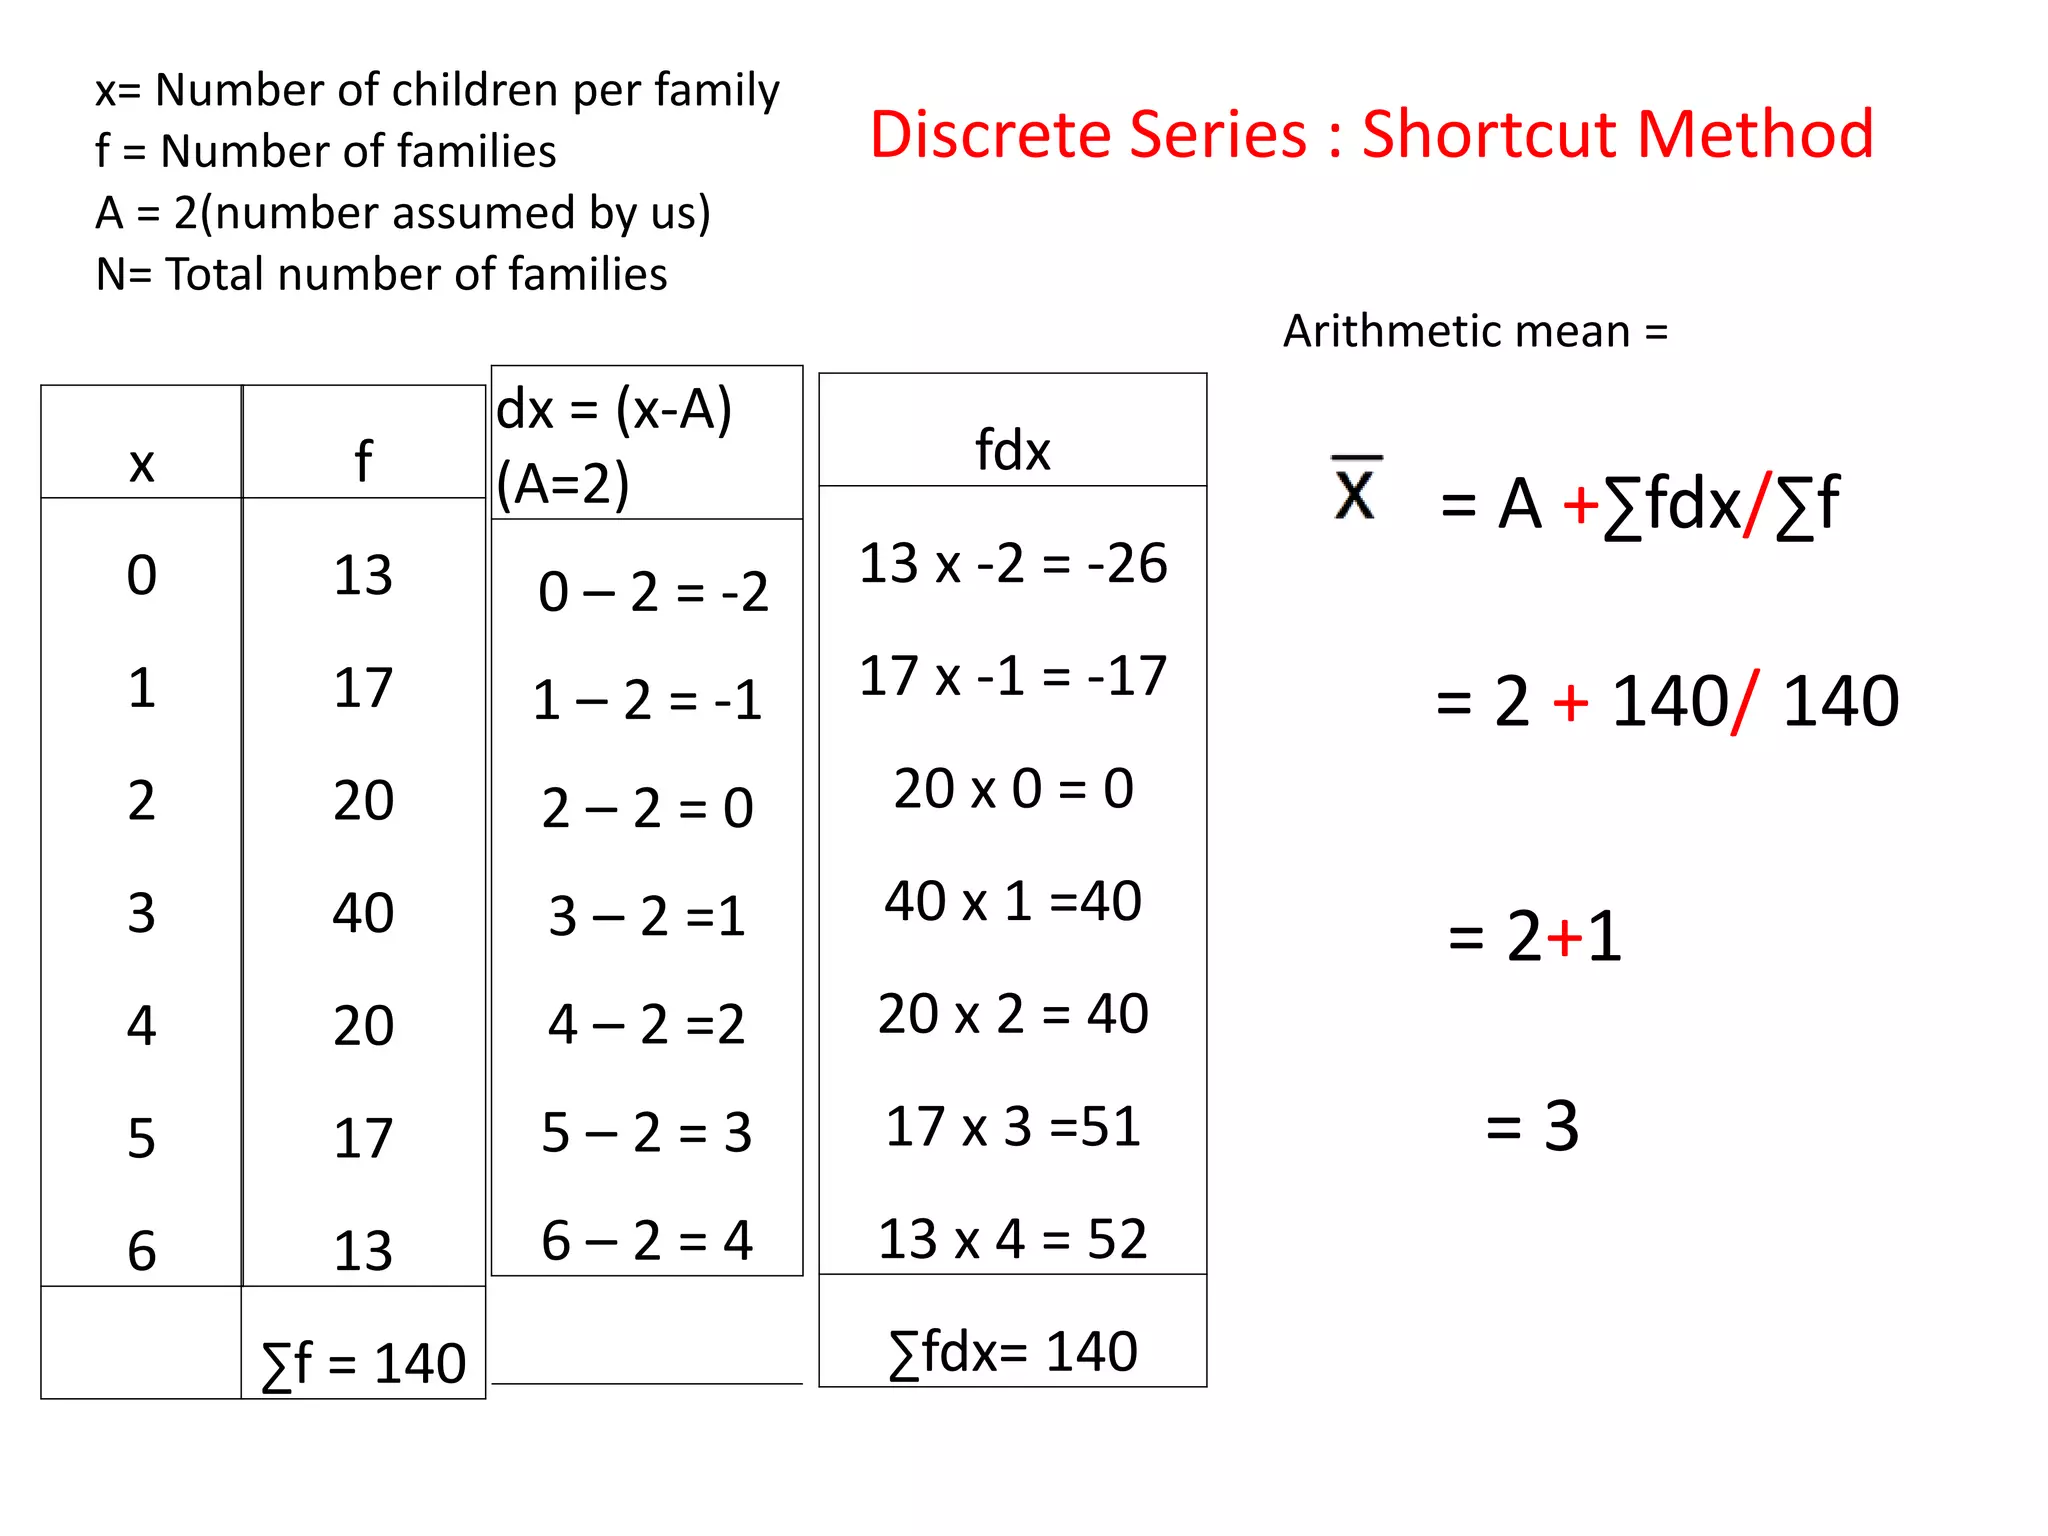
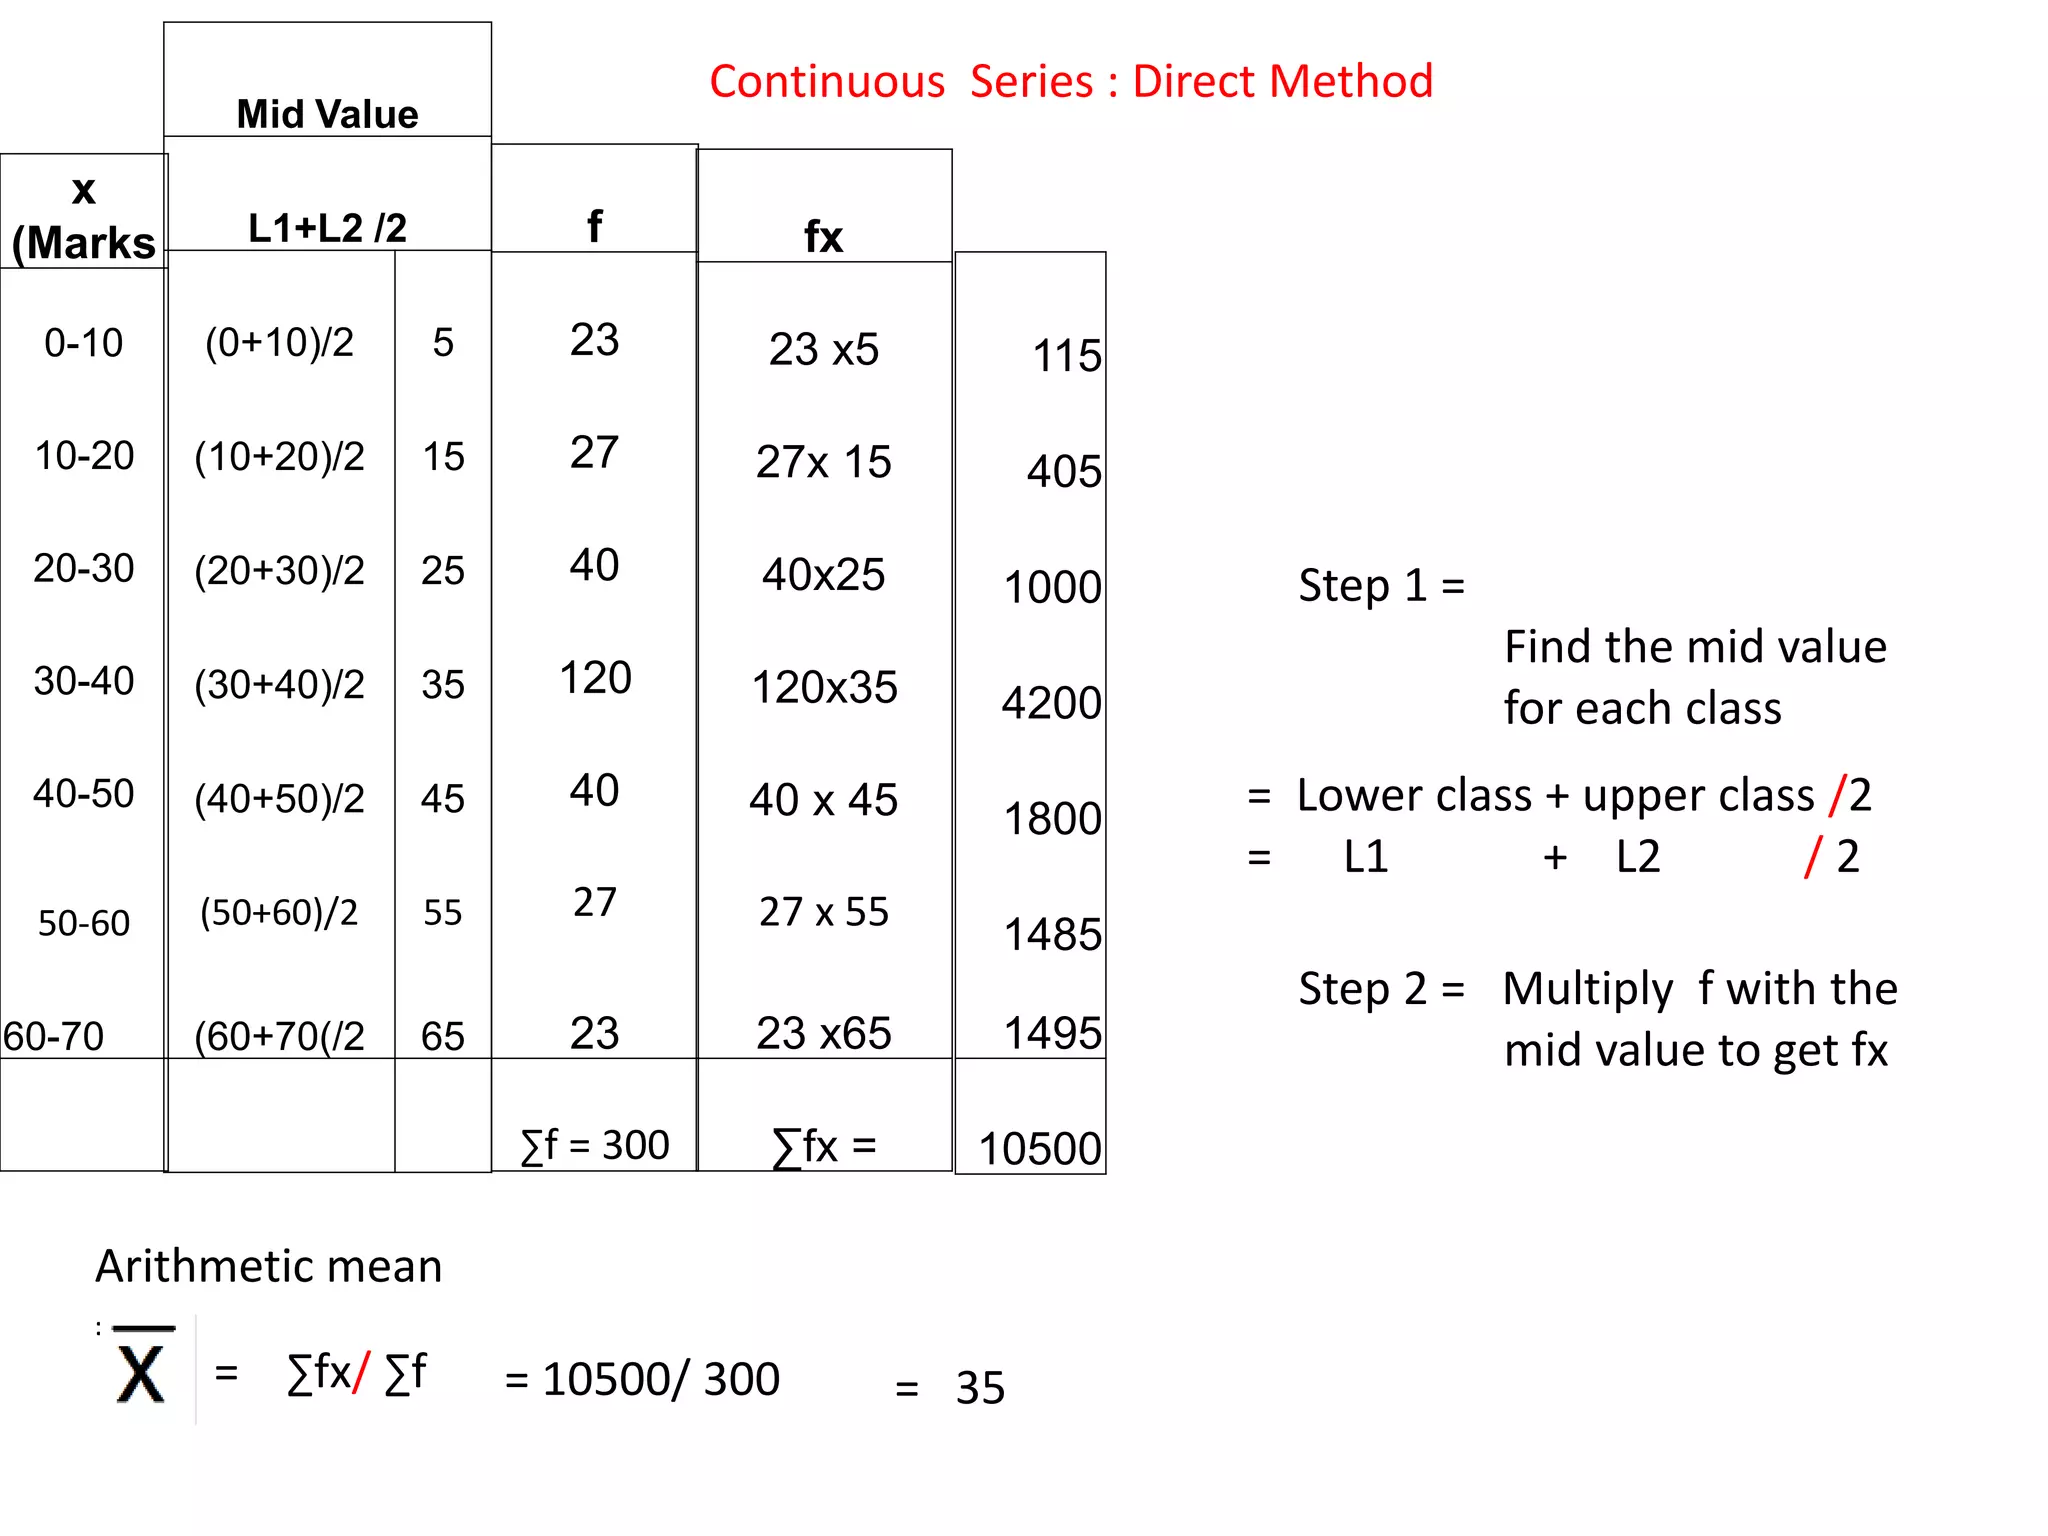
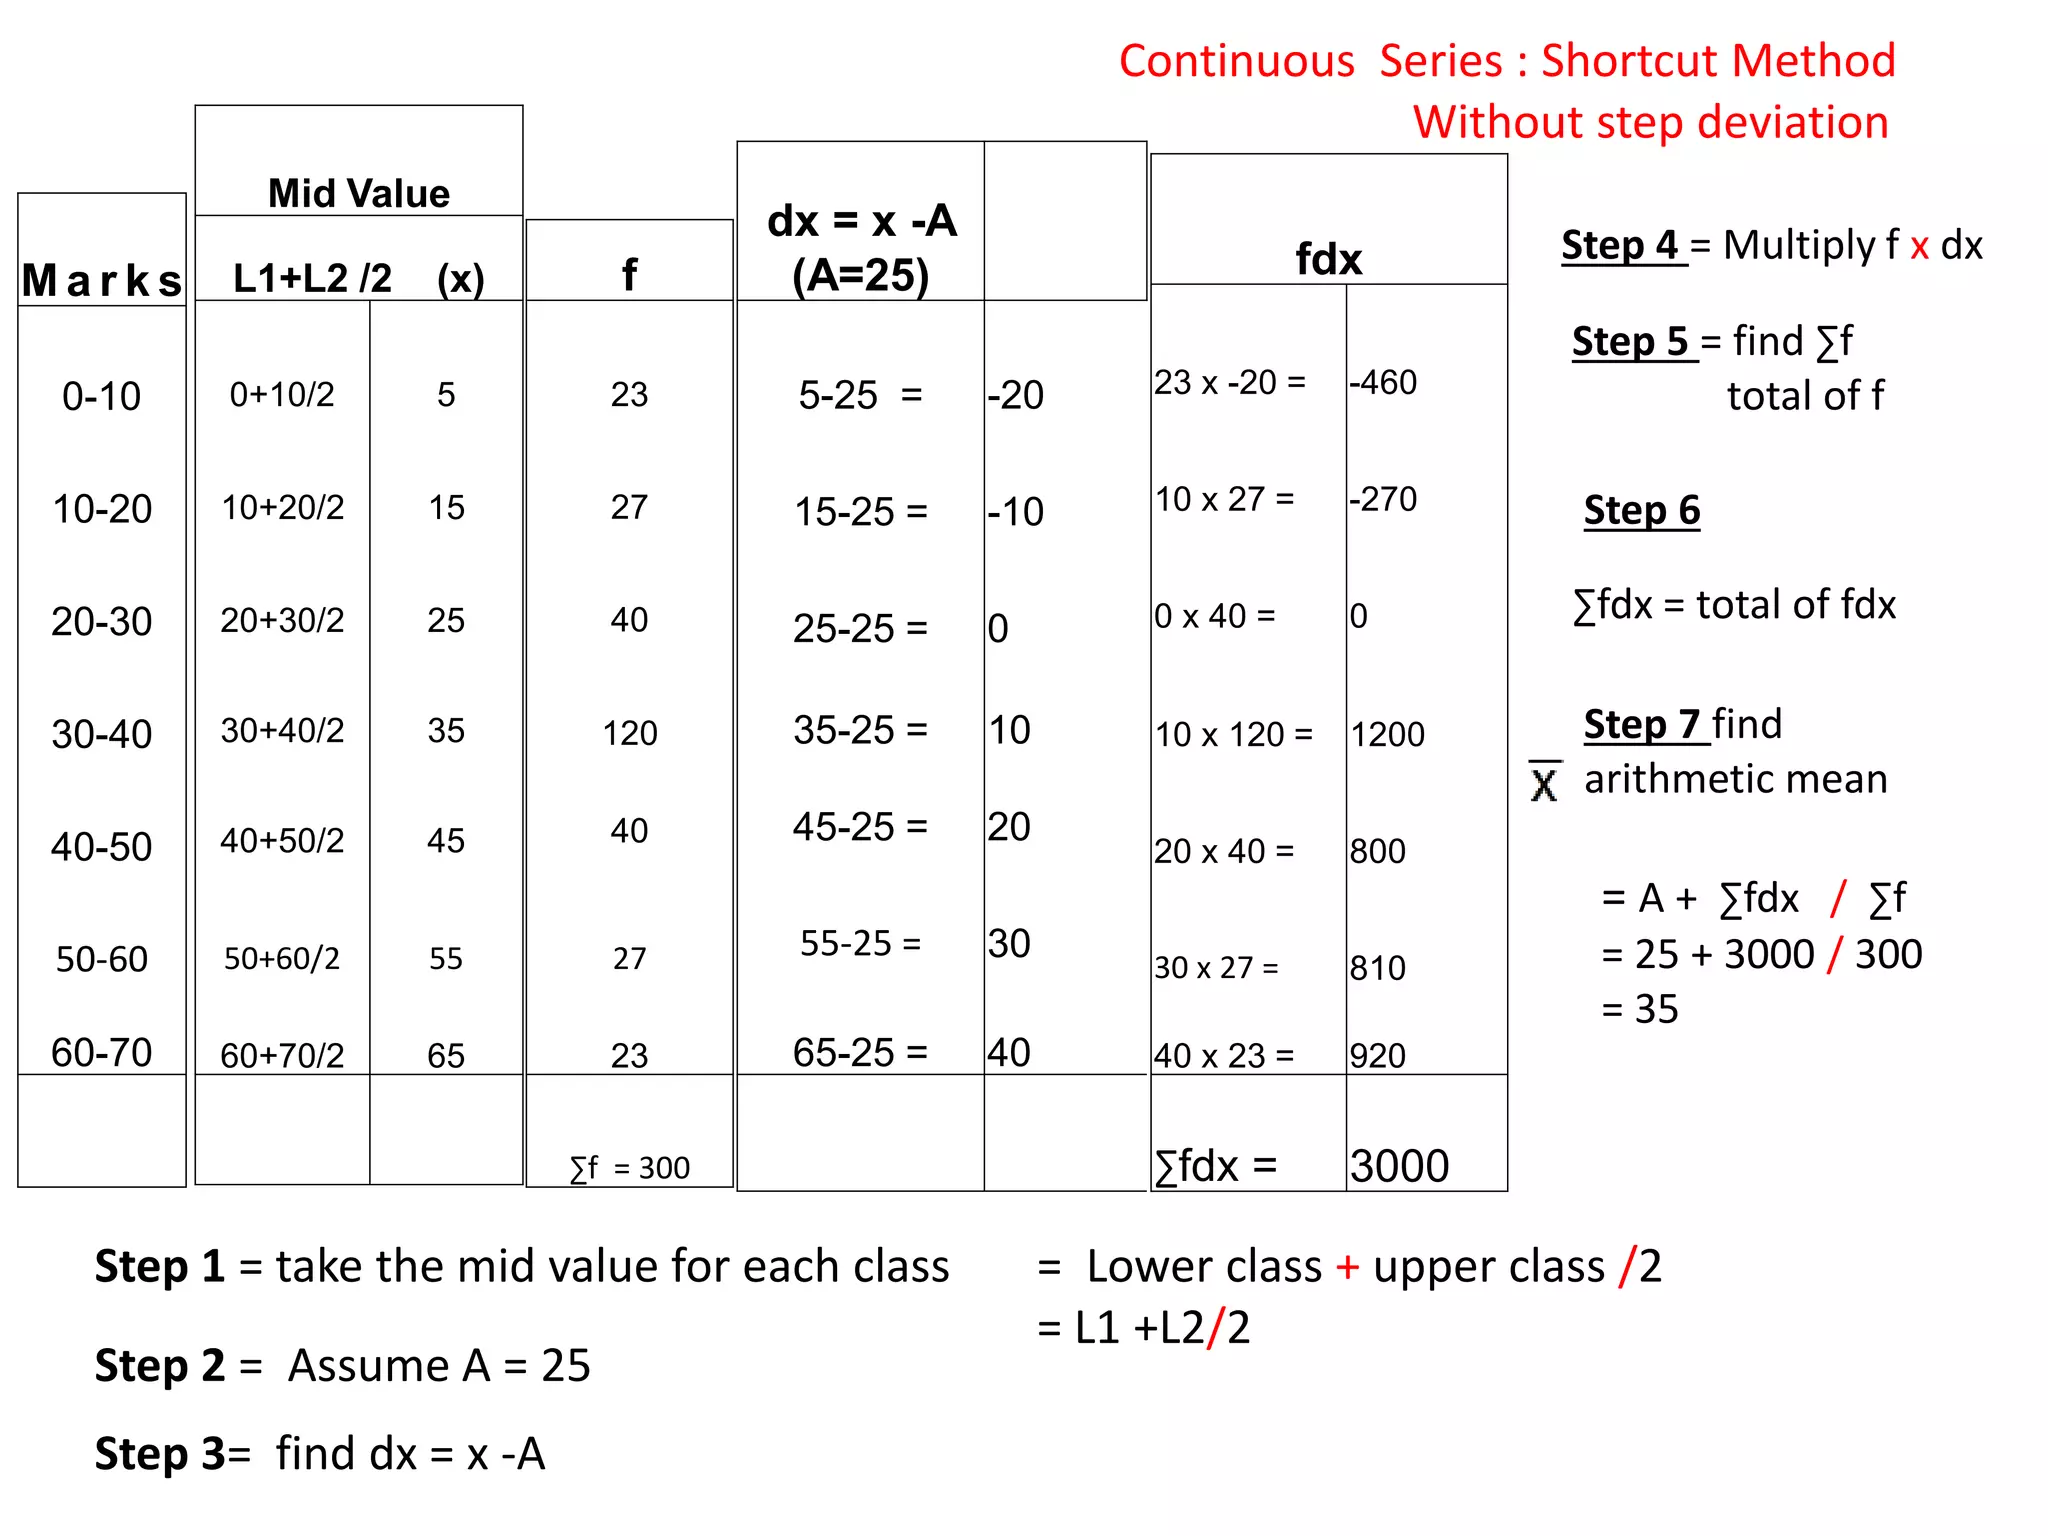
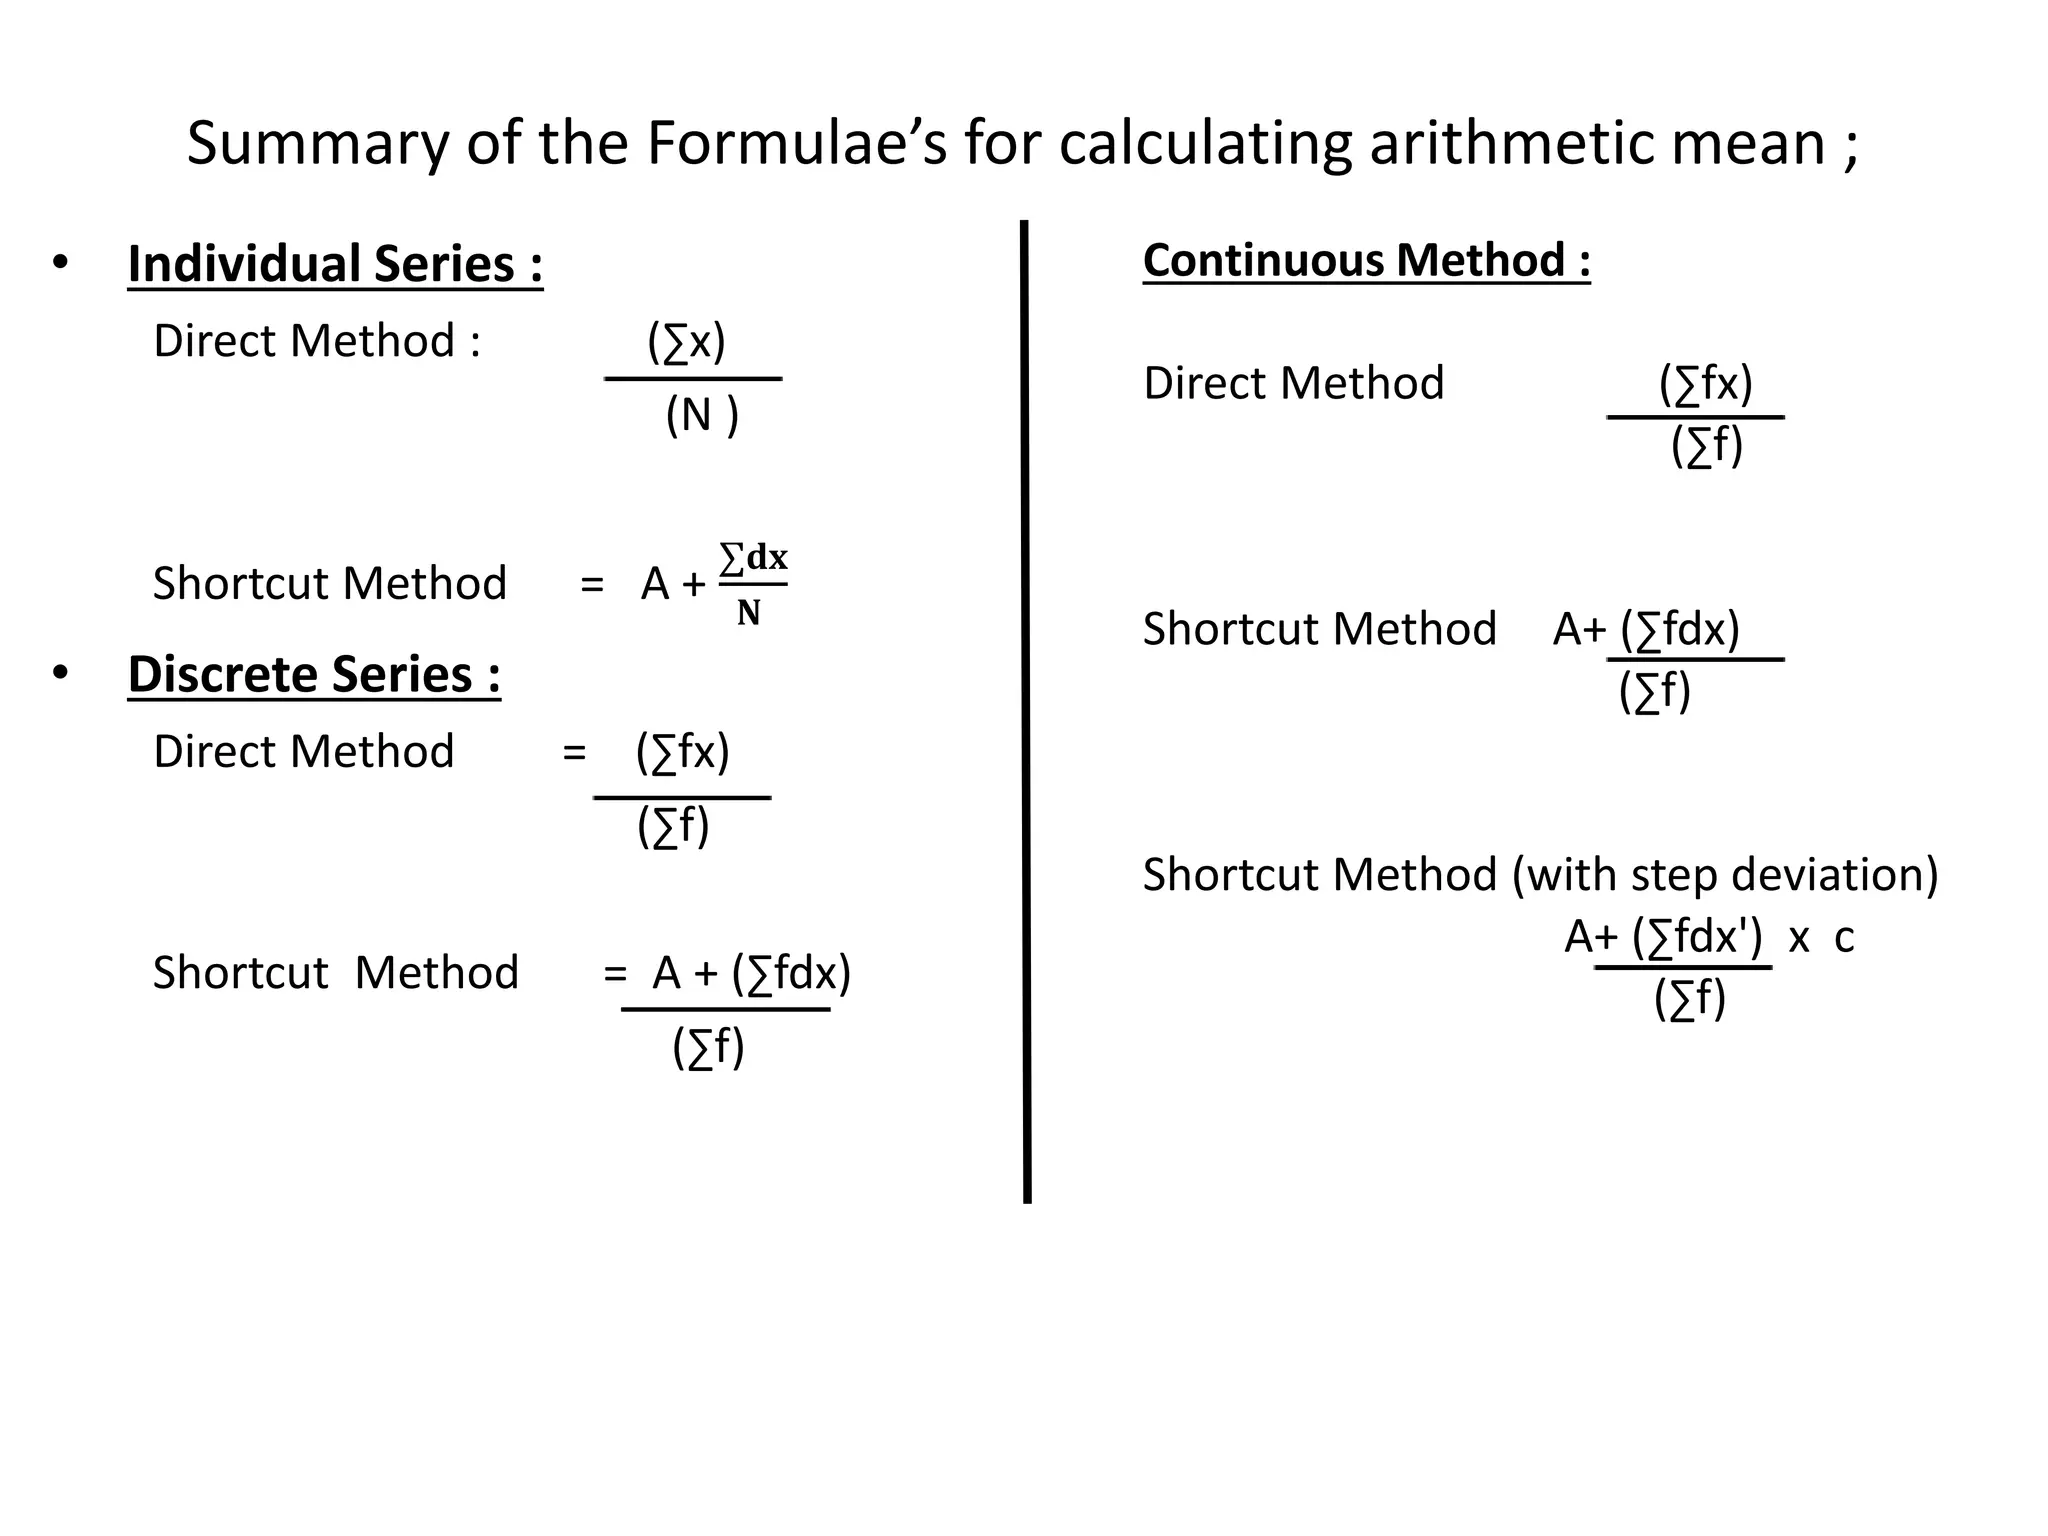


The document discusses various methods for collecting, organizing, and analyzing quantitative data. It describes data as facts expressed numerically that are useful for decision making. Common data types include individual series, discrete series, and continuous series. Methods for calculating the arithmetic mean or average as a measure of central tendency are provided for each data type, including direct formulas and shortcut methods. The goal of statistical analysis is to summarize collected data and identify trends or conclusions.


