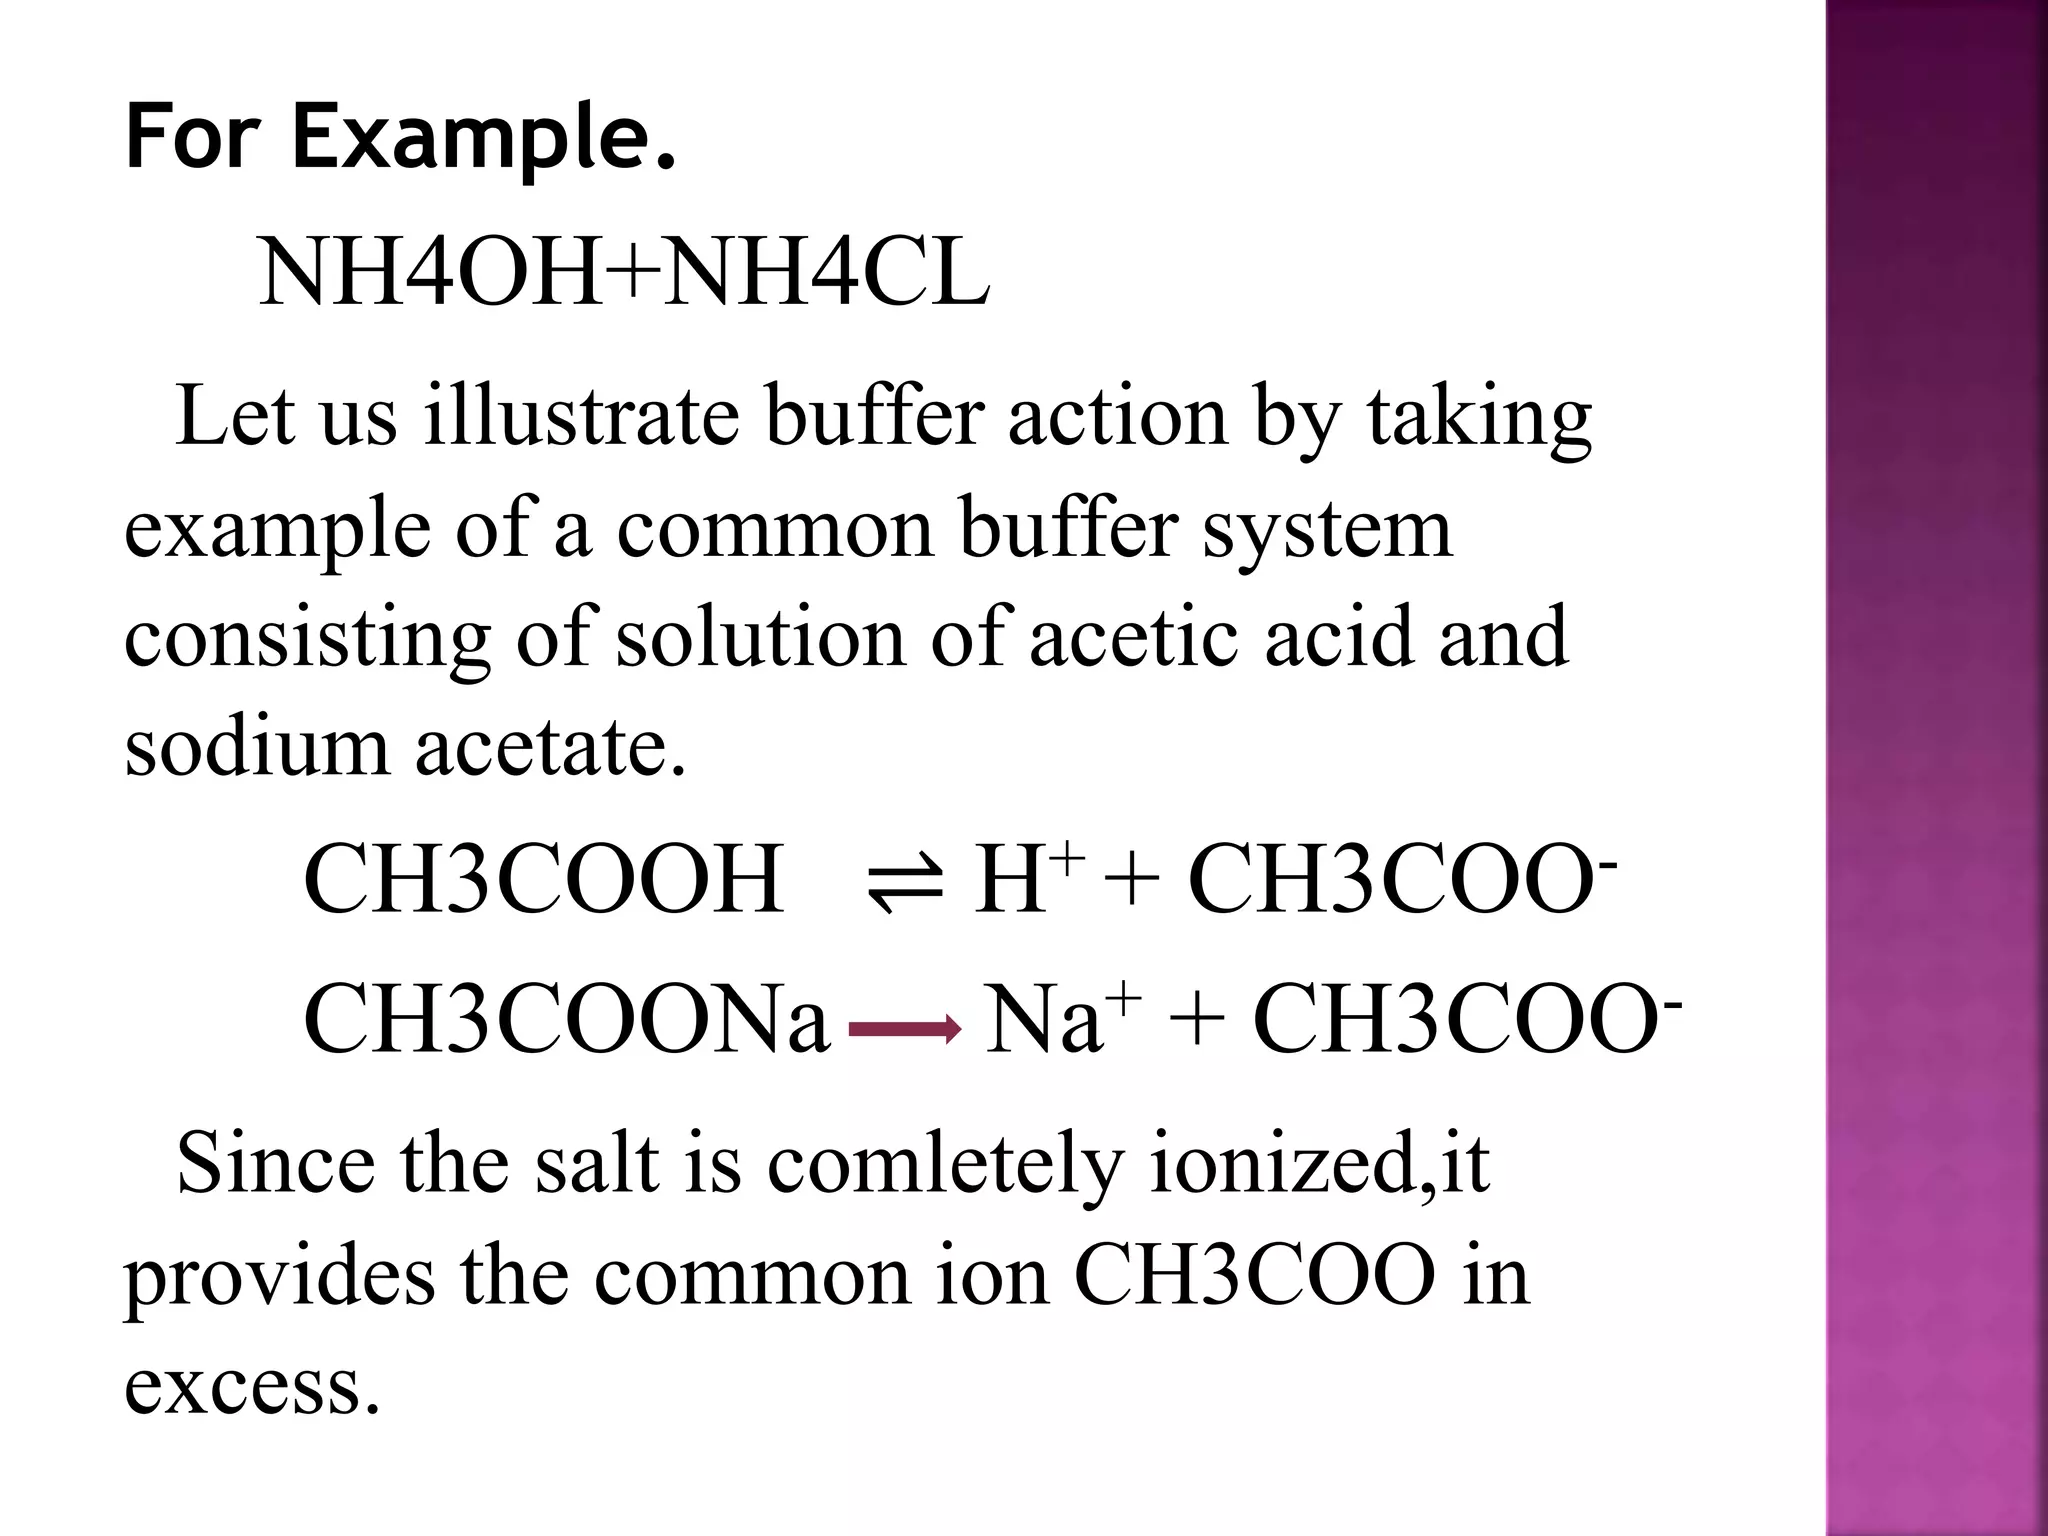
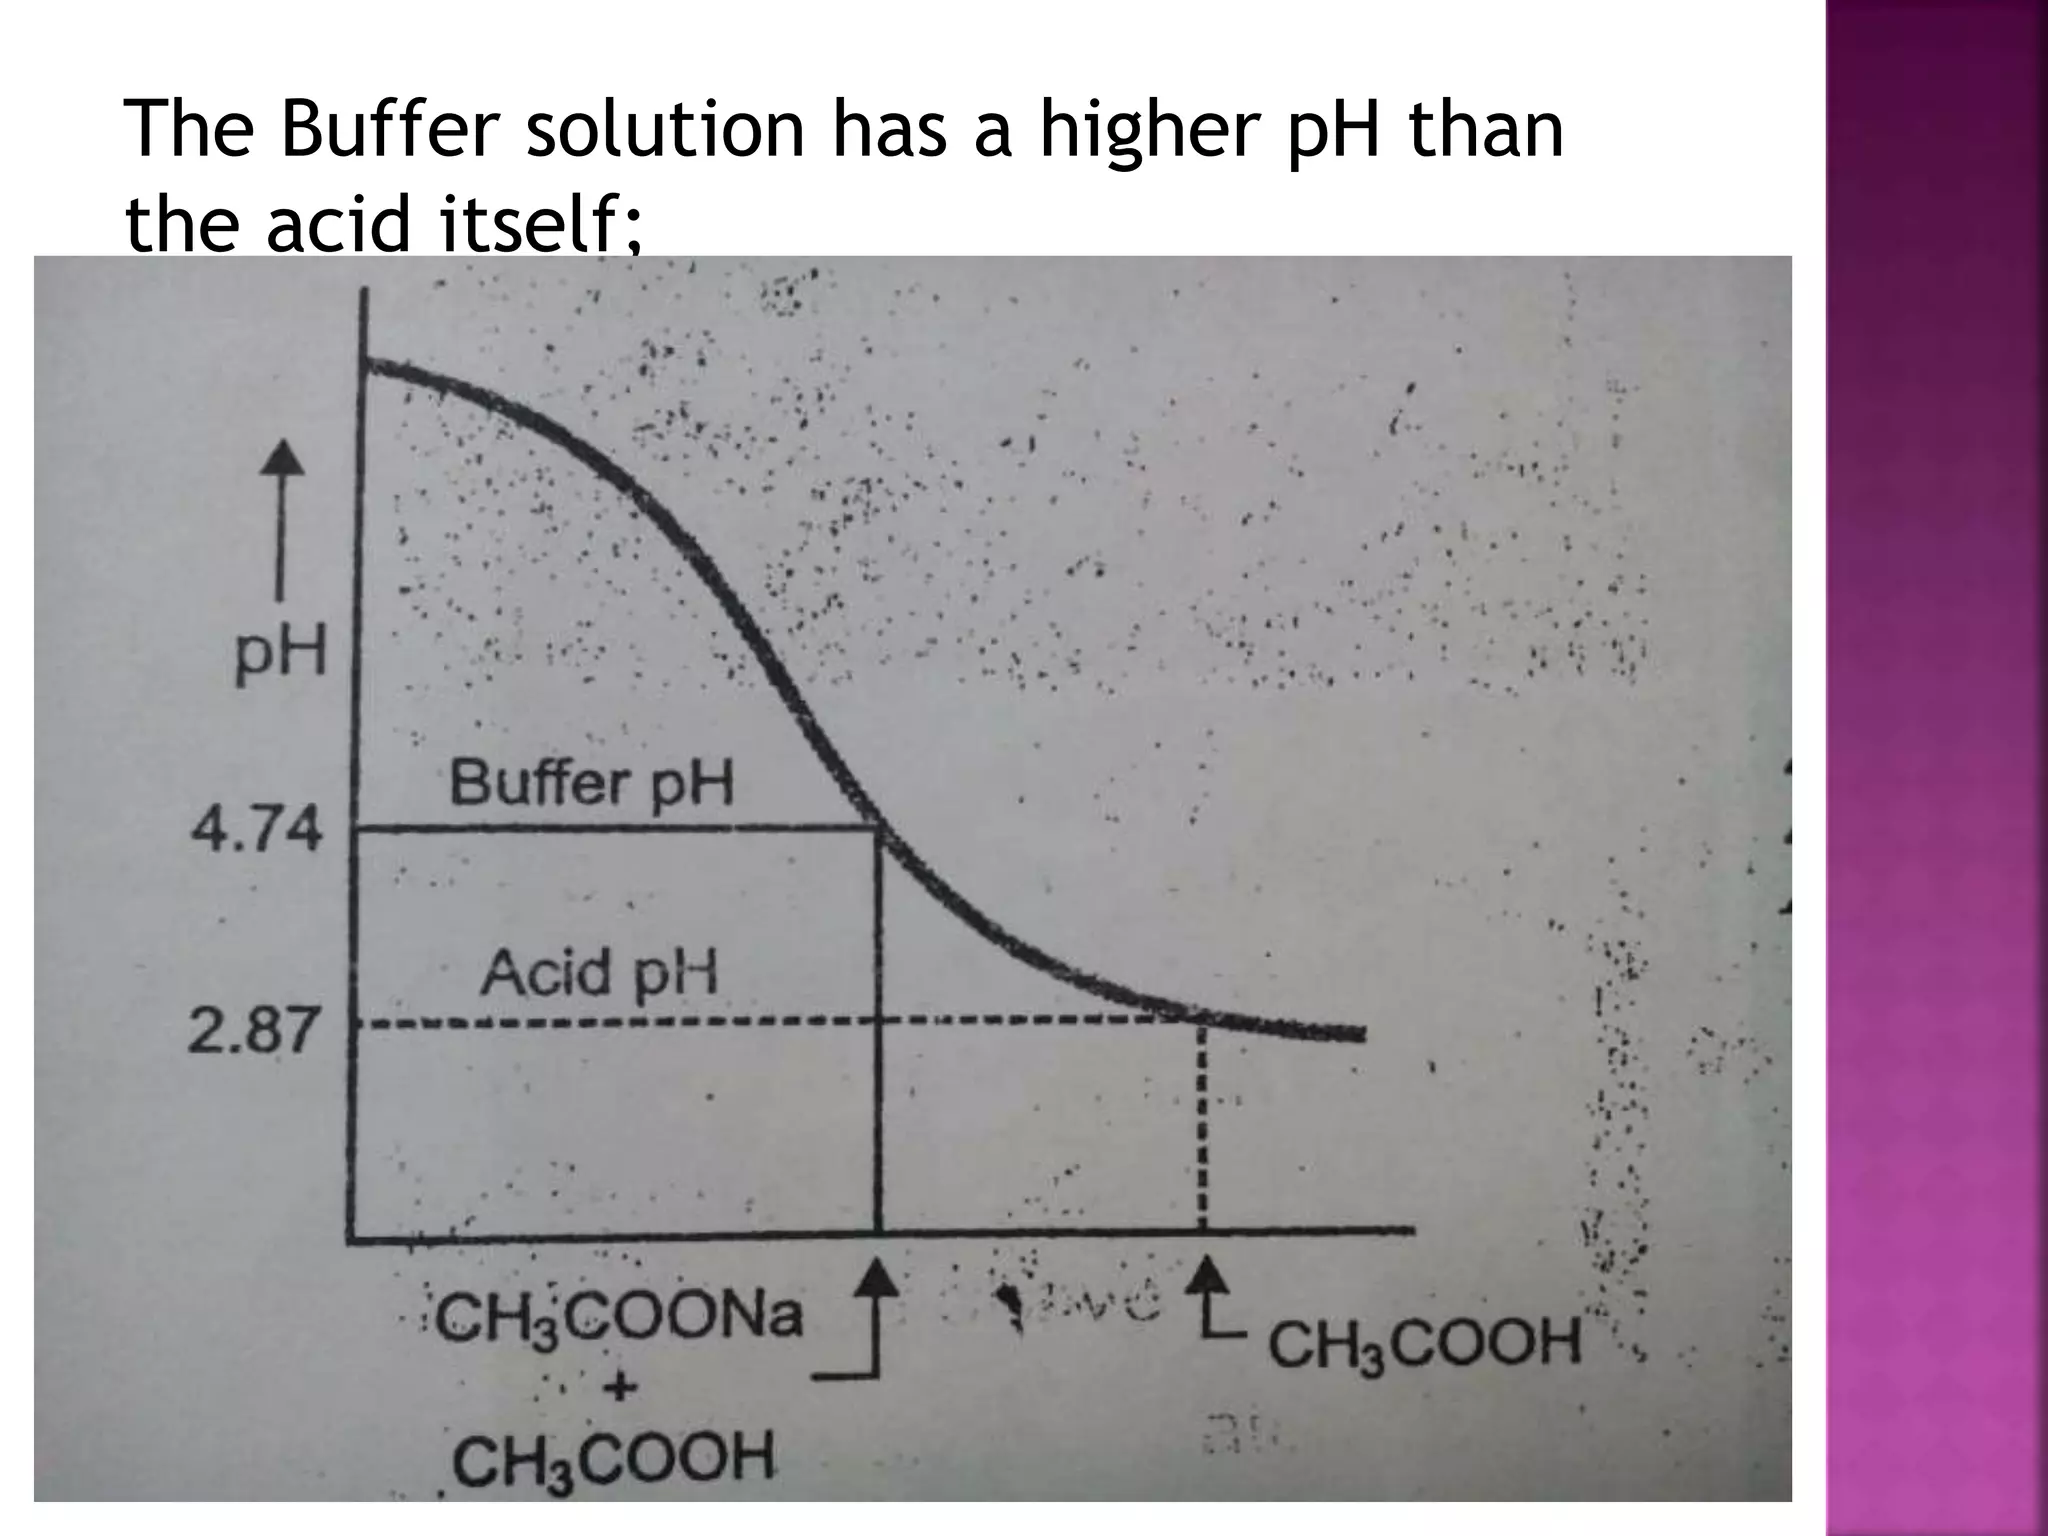
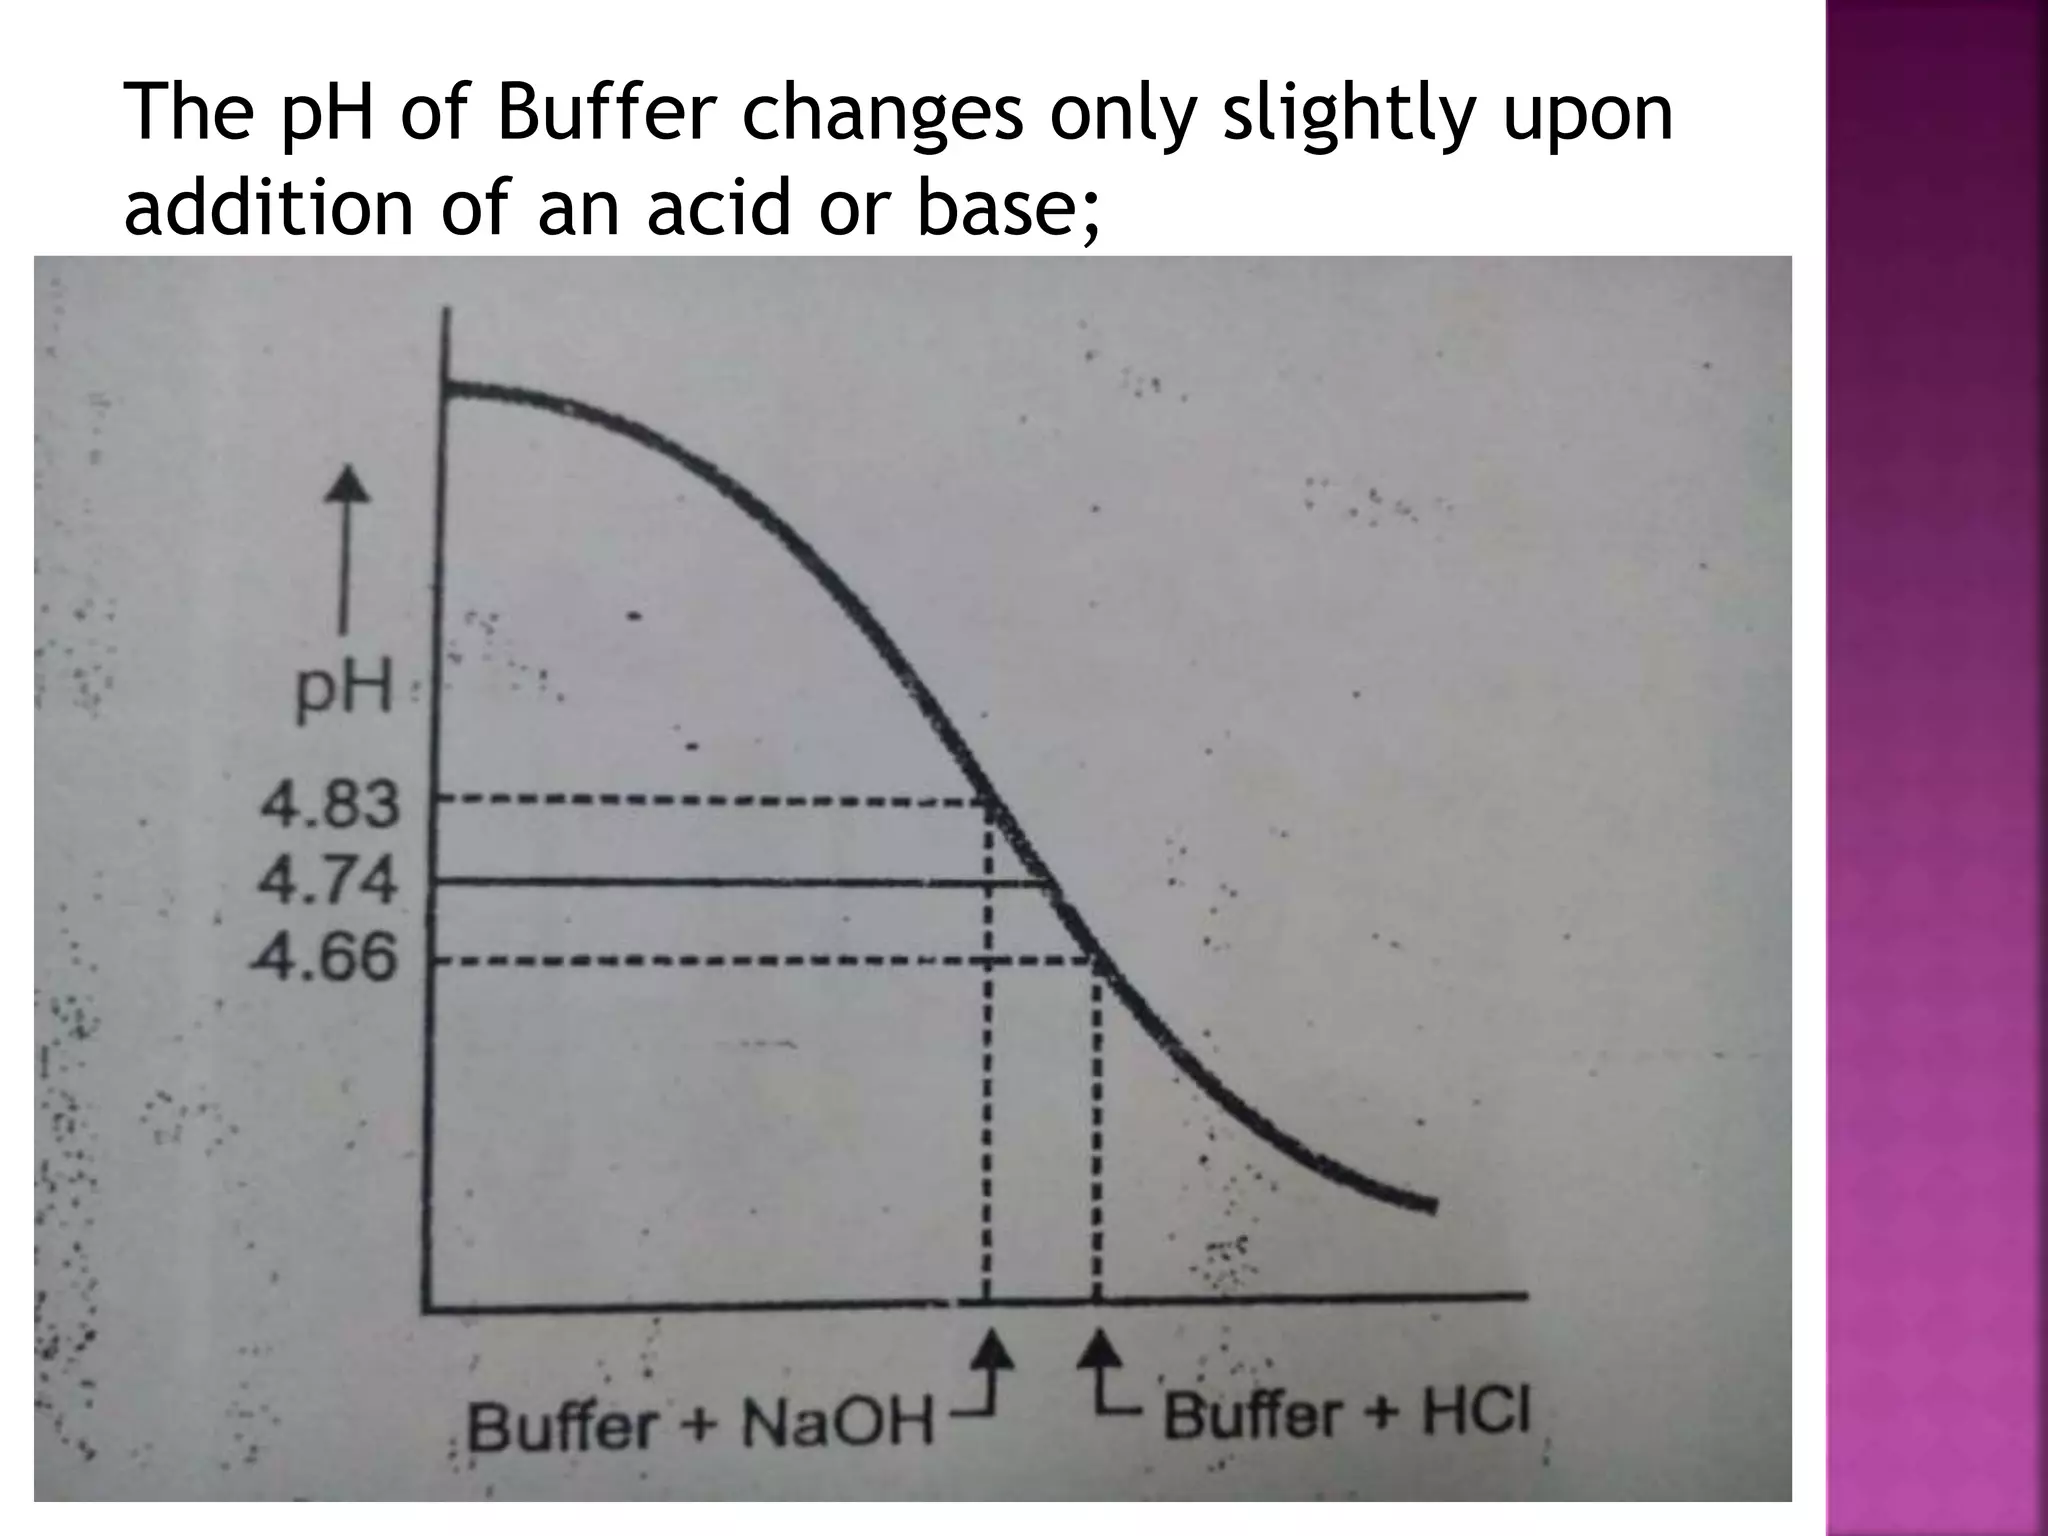
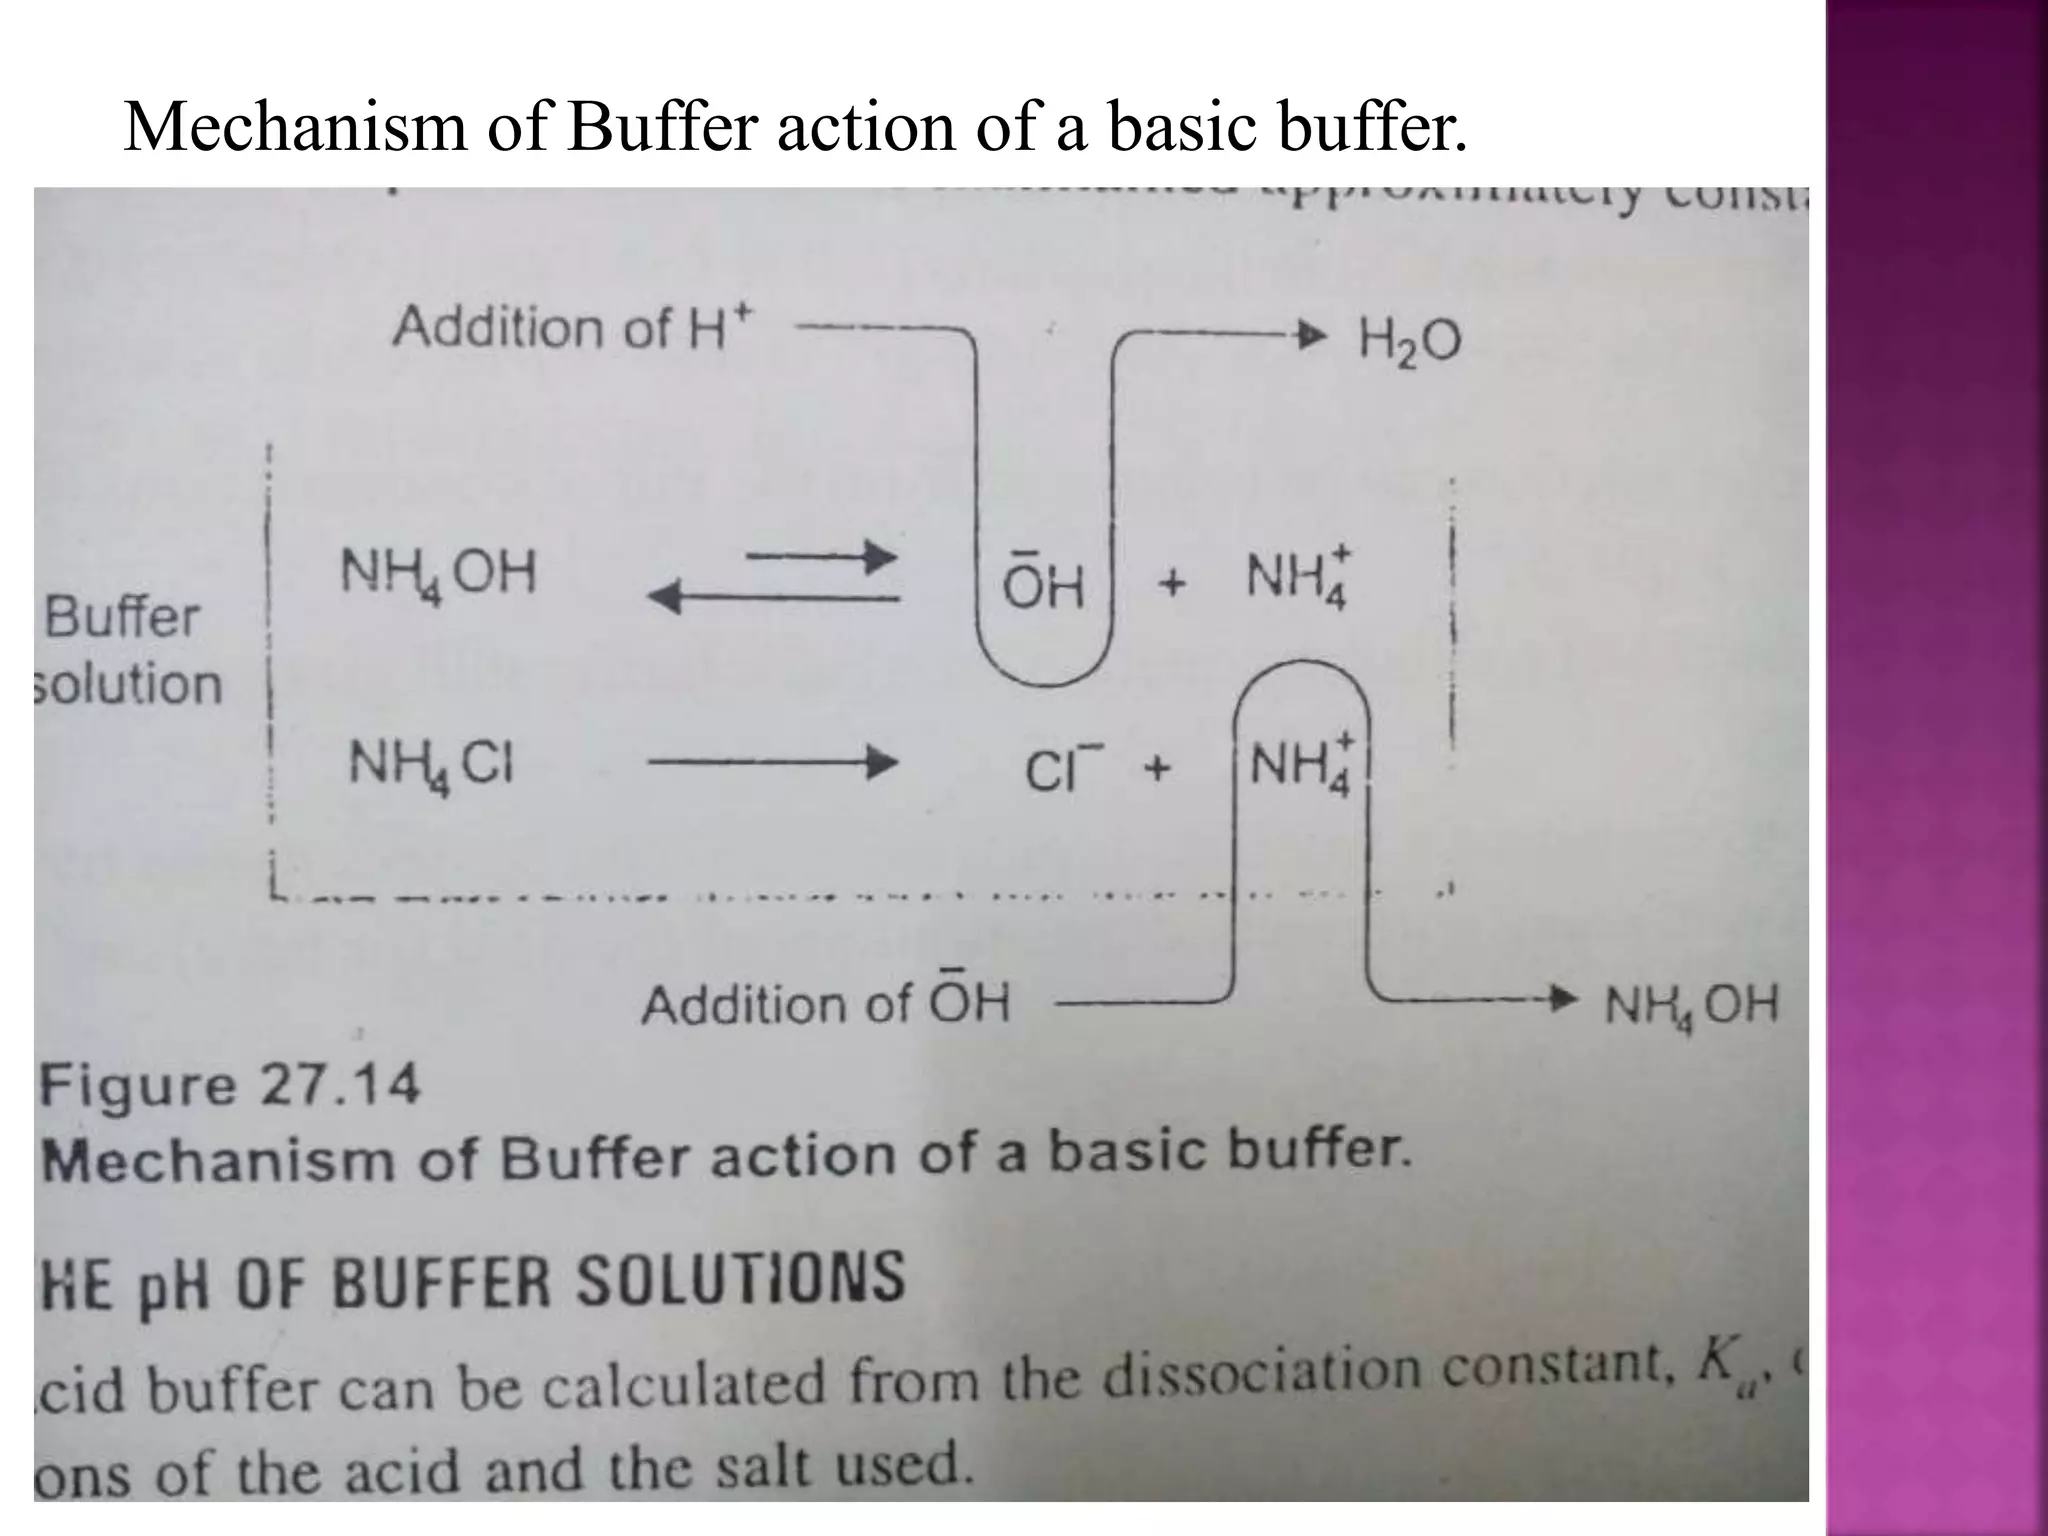
1. A buffer solution maintains a fairly constant pH upon the addition of small amounts of acid or base. There are two types: acidic buffers containing a weak acid and salt of that acid, and basic buffers containing a weak base and salt of that base.
2. Buffer solutions resist changes in pH when acids or bases are added. The buffer capacity depends on the concentrations of the buffer components and how close the pKa is to the solution's pH.
3. Common acid-base indicators like phenolphthalein and methyl orange change color over a specific pH range, signaling the endpoint in acid-base titrations.
Buffers are compounds or mixtures
of compounds that by their presence
in the solution resist changes in the
pH upon the addition of small
quantities of acid or alkali.
Buffers are compounds or mixtures
of compounds that by their presence
in the solution resist changes in the
pH upon the addition of small
quantities of acid or alkali.
Buffer is a mixture of weak acid and salt of conjugate base that resist the change in pH upon the addition of acid or base.BUFFER + H+ H+ BUFFER.
TYPES OF BIOLOGICAL BUFFER1. Bicarbonate Buffer2. Phosphate Buffer3.Protein Buffer4. Haemoglobin
In chemistry, acids and bases have been defined differently by three sets of theories. One is the Arrhenius definition, which revolves around the idea that acids are substances that ionize (break off) in an aqueous solution to produce hydrogen (H+) ions while bases produce hydroxide (OH-) ions in solution.
Describe in this slide the four theories of acid and base.1) Traditional theory 2) arrhenius theory 3) bronsted and lowry theory 4) lewis theory. also explained neutalisation reaction and amphoteric reactions.
Marker Assisted Selection in Crop BreedingPawan Chauhan
Marker Assisted Selection is a value addition to conventional methods of Crop Breeding. It has been gaining importance in plant breeding with new generation of plant breeders and to get accurate and fast desired result from plant breeding.
A New molecular biology techniques for gene therapyVanessa Chappell
The CRISPR (clustered, regularly interspaced, short palindromic repeats)-Cas9 (CRISPR-associated protein 9) system is a targeted nuclease technology which allows precise genome editing. Since the discovery of this system there has been great interest in its potential for human gene therapy. The CRISPR-Cas9 system has many advantages in comparison to other targeted nucleases transcription activator-like effector nucleases and zinc finger nucleases. As a relatively new genome editing platform, safety issues such as off-target editing have yet to be fully investigated.This presentation addresses the challenges as well as the socio-ethical considerations that surround the use of human genome editing.
Molecular Breeding in Plants is an introduction to the fundamental techniques...UNIVERSITI MALAYSIA SABAH
This slide describe the process of molecular breeding in plants which involves the application of molecular markers for Marker Assisted Selection and Marker Assisted Breeding.
I would like to share this presentation file.
Some basics information regarding to molecular plant breeding, hope this help the beginner who start working in this field.
Thanks for many original source of information (mainly from slideshare.net, IRRI, CIMMYT and any paper received from professor and some over the internet)
this presentation is about the molecular markers as we all know the molecular markers are the DNA sequences it can be easily detected and its inheritance is easily monitored.so the main basics of the molecular markers is the polymorphic nature so it can used as molecular markers.and this will gives you the idea about AFLP, RFLP, RAPD, SNPS,ETC.
preparation of buffers, buffers and isotonic systems. Methods for adjustment of tonicity of solutions. Buffers in pharmaceutical and biological systems.
It is an informative article about the pH and buffer system which is related to technology and science. It consist information about the pH and buffer solution which is widely used in the fields of pharmaceuticals as well as science and technology .
Maintenance of pH of body fluids and its disorders for undergraduate medical students and postgraduate students in medicine, paediatrics, respiratory medicine etc
A buffer is a solution of a weak acid and its conjugate base (salt) that resists changes in pH in both directions—either up or down, when small quantities of an acid and a base(alkali) are added to it.
Ionic equilibria: ph, determination of ph of different acids and bases, salt solutions and
buffers. Titration curves of acids and bases and indicators.
Deep Behavioral Phenotyping in Systems Neuroscience for Functional Atlasing a...Ana Luísa Pinho
Functional Magnetic Resonance Imaging (fMRI) provides means to characterize brain activations in response to behavior. However, cognitive neuroscience has been limited to group-level effects referring to the performance of specific tasks. To obtain the functional profile of elementary cognitive mechanisms, the combination of brain responses to many tasks is required. Yet, to date, both structural atlases and parcellation-based activations do not fully account for cognitive function and still present several limitations. Further, they do not adapt overall to individual characteristics. In this talk, I will give an account of deep-behavioral phenotyping strategies, namely data-driven methods in large task-fMRI datasets, to optimize functional brain-data collection and improve inference of effects-of-interest related to mental processes. Key to this approach is the employment of fast multi-functional paradigms rich on features that can be well parametrized and, consequently, facilitate the creation of psycho-physiological constructs to be modelled with imaging data. Particular emphasis will be given to music stimuli when studying high-order cognitive mechanisms, due to their ecological nature and quality to enable complex behavior compounded by discrete entities. I will also discuss how deep-behavioral phenotyping and individualized models applied to neuroimaging data can better account for the subject-specific organization of domain-general cognitive systems in the human brain. Finally, the accumulation of functional brain signatures brings the possibility to clarify relationships among tasks and create a univocal link between brain systems and mental functions through: (1) the development of ontologies proposing an organization of cognitive processes; and (2) brain-network taxonomies describing functional specialization. To this end, tools to improve commensurability in cognitive science are necessary, such as public repositories, ontology-based platforms and automated meta-analysis tools. I will thus discuss some brain-atlasing resources currently under development, and their applicability in cognitive as well as clinical neuroscience.
Comparing Evolved Extractive Text Summary Scores of Bidirectional Encoder Rep...University of Maribor
Slides from:
11th International Conference on Electrical, Electronics and Computer Engineering (IcETRAN), Niš, 3-6 June 2024
Track: Artificial Intelligence
https://www.etran.rs/2024/en/home-english/
Multi-source connectivity as the driver of solar wind variability in the heli...Sérgio Sacani
The ambient solar wind that flls the heliosphere originates from multiple
sources in the solar corona and is highly structured. It is often described
as high-speed, relatively homogeneous, plasma streams from coronal
holes and slow-speed, highly variable, streams whose source regions are
under debate. A key goal of ESA/NASA’s Solar Orbiter mission is to identify
solar wind sources and understand what drives the complexity seen in the
heliosphere. By combining magnetic feld modelling and spectroscopic
techniques with high-resolution observations and measurements, we show
that the solar wind variability detected in situ by Solar Orbiter in March
2022 is driven by spatio-temporal changes in the magnetic connectivity to
multiple sources in the solar atmosphere. The magnetic feld footpoints
connected to the spacecraft moved from the boundaries of a coronal hole
to one active region (12961) and then across to another region (12957). This
is refected in the in situ measurements, which show the transition from fast
to highly Alfvénic then to slow solar wind that is disrupted by the arrival of
a coronal mass ejection. Our results describe solar wind variability at 0.5 au
but are applicable to near-Earth observatories.
Earliest Galaxies in the JADES Origins Field: Luminosity Function and Cosmic ...Sérgio Sacani
We characterize the earliest galaxy population in the JADES Origins Field (JOF), the deepest
imaging field observed with JWST. We make use of the ancillary Hubble optical images (5 filters
spanning 0.4−0.9µm) and novel JWST images with 14 filters spanning 0.8−5µm, including 7 mediumband filters, and reaching total exposure times of up to 46 hours per filter. We combine all our data
at > 2.3µm to construct an ultradeep image, reaching as deep as ≈ 31.4 AB mag in the stack and
30.3-31.0 AB mag (5σ, r = 0.1” circular aperture) in individual filters. We measure photometric
redshifts and use robust selection criteria to identify a sample of eight galaxy candidates at redshifts
z = 11.5 − 15. These objects show compact half-light radii of R1/2 ∼ 50 − 200pc, stellar masses of
M⋆ ∼ 107−108M⊙, and star-formation rates of SFR ∼ 0.1−1 M⊙ yr−1
. Our search finds no candidates
at 15 < z < 20, placing upper limits at these redshifts. We develop a forward modeling approach to
infer the properties of the evolving luminosity function without binning in redshift or luminosity that
marginalizes over the photometric redshift uncertainty of our candidate galaxies and incorporates the
impact of non-detections. We find a z = 12 luminosity function in good agreement with prior results,
and that the luminosity function normalization and UV luminosity density decline by a factor of ∼ 2.5
from z = 12 to z = 14. We discuss the possible implications of our results in the context of theoretical
models for evolution of the dark matter halo mass function.
Introduction:
RNA interference (RNAi) or Post-Transcriptional Gene Silencing (PTGS) is an important biological process for modulating eukaryotic gene expression.
It is highly conserved process of posttranscriptional gene silencing by which double stranded RNA (dsRNA) causes sequence-specific degradation of mRNA sequences.
dsRNA-induced gene silencing (RNAi) is reported in a wide range of eukaryotes ranging from worms, insects, mammals and plants.
This process mediates resistance to both endogenous parasitic and exogenous pathogenic nucleic acids, and regulates the expression of protein-coding genes.
What are small ncRNAs?
micro RNA (miRNA)
short interfering RNA (siRNA)
Properties of small non-coding RNA:
Involved in silencing mRNA transcripts.
Called “small” because they are usually only about 21-24 nucleotides long.
Synthesized by first cutting up longer precursor sequences (like the 61nt one that Lee discovered).
Silence an mRNA by base pairing with some sequence on the mRNA.
Discovery of siRNA?
The first small RNA:
In 1993 Rosalind Lee (Victor Ambros lab) was studying a non- coding gene in C. elegans, lin-4, that was involved in silencing of another gene, lin-14, at the appropriate time in the
development of the worm C. elegans.
Two small transcripts of lin-4 (22nt and 61nt) were found to be complementary to a sequence in the 3' UTR of lin-14.
Because lin-4 encoded no protein, she deduced that it must be these transcripts that are causing the silencing by RNA-RNA interactions.
Types of RNAi ( non coding RNA)
MiRNA
Length (23-25 nt)
Trans acting
Binds with target MRNA in mismatch
Translation inhibition
Si RNA
Length 21 nt.
Cis acting
Bind with target Mrna in perfect complementary sequence
Piwi-RNA
Length ; 25 to 36 nt.
Expressed in Germ Cells
Regulates trnasposomes activity
MECHANISM OF RNAI:
First the double-stranded RNA teams up with a protein complex named Dicer, which cuts the long RNA into short pieces.
Then another protein complex called RISC (RNA-induced silencing complex) discards one of the two RNA strands.
The RISC-docked, single-stranded RNA then pairs with the homologous mRNA and destroys it.
THE RISC COMPLEX:
RISC is large(>500kD) RNA multi- protein Binding complex which triggers MRNA degradation in response to MRNA
Unwinding of double stranded Si RNA by ATP independent Helicase
Active component of RISC is Ago proteins( ENDONUCLEASE) which cleave target MRNA.
DICER: endonuclease (RNase Family III)
Argonaute: Central Component of the RNA-Induced Silencing Complex (RISC)
One strand of the dsRNA produced by Dicer is retained in the RISC complex in association with Argonaute
ARGONAUTE PROTEIN :
1.PAZ(PIWI/Argonaute/ Zwille)- Recognition of target MRNA
2.PIWI (p-element induced wimpy Testis)- breaks Phosphodiester bond of mRNA.)RNAse H activity.
MiRNA:
The Double-stranded RNAs are naturally produced in eukaryotic cells during development, and they have a key role in regulating gene expression .
This pdf is about the Schizophrenia.
For more details visit on YouTube; @SELF-EXPLANATORY;
https://www.youtube.com/channel/UCAiarMZDNhe1A3Rnpr_WkzA/videos
Thanks...!
This presentation explores a brief idea about the structural and functional attributes of nucleotides, the structure and function of genetic materials along with the impact of UV rays and pH upon them.
1. A buffer solution is one which maintains
its pH fairly constant even upon the
addition of small amounts of acid or
base.
There are two types of buffer solution.
1. Acidic Buffer
2. Basic Buffer
2. Acidic Buffer:
A weak acid together with a salt of
the same acid with a strong base.These are
called Acidic Buffer.
For Example.
CH3COOH CH3COONa.
Basic Buffers:
A weak base and its salt with a strong
acid.These are called Basic Buffers.
3. For Example.
NH4OH+NH4CL
Let us illustrate buffer action by taking
example of a common buffer system
consisting of solution of acetic acid and
sodium acetate.
CH3COOH ⇌ H+ + CH3COO-
CH3COONa Na+ + CH3COO-
Since the salt is comletely ionized,it
provides the common ion CH3COO in
excess.
5. The pH of Buffer changes only slightly upon
addition of an acid or base;
6. We have already stated that a buffer solution
containing equimolar amounts (0.10M) of acetic acid
and sodium acetate has pH 4.74.Now we proceed to
discuss how the addition of a small amount of HCl
or NaOH to the buffer solution affects its Ph.
The pH of the buffer is governed by the
equillibrium
CH3COOH ⇌ CH3COO + H
The buffer solution has a large excess of
CH3COO ions produced by complete ionization
of sodium acetate,
7. CH3COONa CH3COO+Na
Addition of HCl:
Upon the addition of HCl,the increase
of H ions is counteracted by association
with the excess of acetate ions to form
unionised CH3COOH.Thus the added H
ions are neutralised and the Ph of the
buffer solution remains virtually
unchanged.However owing to the
increased concentration of CH3COOH,the
equilibrium shifts slightly to the right to
increase H ions.This explains the marginal
increase of Ph of the buffer solution of
HCl.
9. Addition of NaOH:
When NaOH is added to the buffer solution, the
additional OH ions combine with H ions of the buffer to
form water molecules. As a result the equillibrium shifts
to the right to produce more and more H ions till
practically all the excess OH ions are neutralized and the
original buffer Ph restored. However,a new equilibrium
system is set up in which CH3COOH is lower than it was
in the original buffer. Consequently H is also slightly less
and pH slightly higher than the buffer pH values
Operation of a Basic buffer as NH4OH NH4Cl
can also be explained on the same lines as of an acid
buffer upon addition of HCl the H ions combine with OH
ions of the buffer to form water molecules.The
equillibrium,
10. NH4OH NH4 OH
Is shifted to the right till all the additional
H ions are neutralized and the original
buffer Ph restored When NaOH is added to
the buffer solution,OH ions associate with
excess of NH4 ions to form unassociated
NH4OH. Thus the Ph of the buffer is
maintained approximately constant.
12. It can be defined as the ability of a
buffer to resist the change of potential of
hydrogen.
Mathematically it can be expressed as;
How it can be determined?
Buffer capacity of a buffer solution is
determined by the size of actual molarities.
How do you calculate the Buffer Capacity?
Buffer Capacity refers to the maximum
amount of a strong acid or a strong base that is
added so that a significant change in pH occur.
13. IMPORTANCE:
It is important in chemical as well as in
biological term.
Buffer Capacity of water:
As the purity of fresh water increases,the buffer
capacity decreases and 100 percent pure fresh water is no
buffer at all.
What factors determined buffer capacity ?
The concentration of the buffer (the higher the
concentration,the larger the buffering capacity) and how
close the pka of buffer is compared to the pH of solution.
15. An acid base is an organic dye that
signals the end point by a visual change in
colour.
Two common examples of acid base indicator
Phenophthalein
Methyl orange
PH Range:
Most indicators do not change colour at a
particular pH.They do so over a range of pH from
two to three units this is called the pH range.
16. It was different for various indicators.
PH Curve And Indicators Range:
During an acid base titration the pH
of solution in the receiver flask changes with
the addition of the titrant from the burette.A
plot of Ph against the vol. of the solution being
added is known as pH curve or Titration Curve
e.g phenophthaline litmus and methyl orange
may be used as indicators for acid base
titrations.
17. End Point:
In an acid base titration the base solution
can be added gradually from a burette into an acid
solution contained in a receiver flask. When the
amount of base added equals the amount of an acid
in the flask the end point is reached.
The end point of a titration is shown by
colour change of an indicator.
18. we may have the titration of:
a strong acid with a strong base
a weak acid with a strong base
a strong acid with a weak base
a weak acid with a weak base
Titration a strong acid with a strong base:
In this titration both methyl orange and
phenophthalein are suitable indicators
19. Titration a weak acid with a strong base:
In this titration phenophthalein is a suitable
indicator, while methyl orange is not.
Titration a strong acid with a weak base:
In this titration, evidently methyl orange and
methyl red are suitable indicators.
Titration a acid with a weak base:
Under these condition, all indicators change
colour only gradually and no indicator is suitable.
20. These two theories
The Ostwalds theory
The Quinonoid theory
The Ostwalds theory:
1) an acid-base indicator is a weak organic acid or
a weak organic base, where the letter ln stands
for a complex organic group. Methyl orange and
phenophthalein are both weak acids.
2) the unionized indicator , Hln , has a colours
different from the Ln ions produced by the
ionisation of the indicator in aqueous solution.
21. 1) the degree of ionization of the indicator determines
the visible colour of the indicator solution.
How an acid-base indicator works:
Indicator Constant:
dissociation constant of the indicator is called
indicator constant.
Relation of indicator colour to pH:
the indicator colour is controlled by H ion
concentration of Ph of solution.
Indicator action of phenophthalein:
Hln ⇌ H + ln
22. Quinonoid theory of indicator colour change:
the owstwald thery takes care of the
quantitative aspect of indicator action.
While on the hand quinonoid theory tells the
cause of colour change of an indicator in acid-
base solutions.