Download as PDF, PPTX
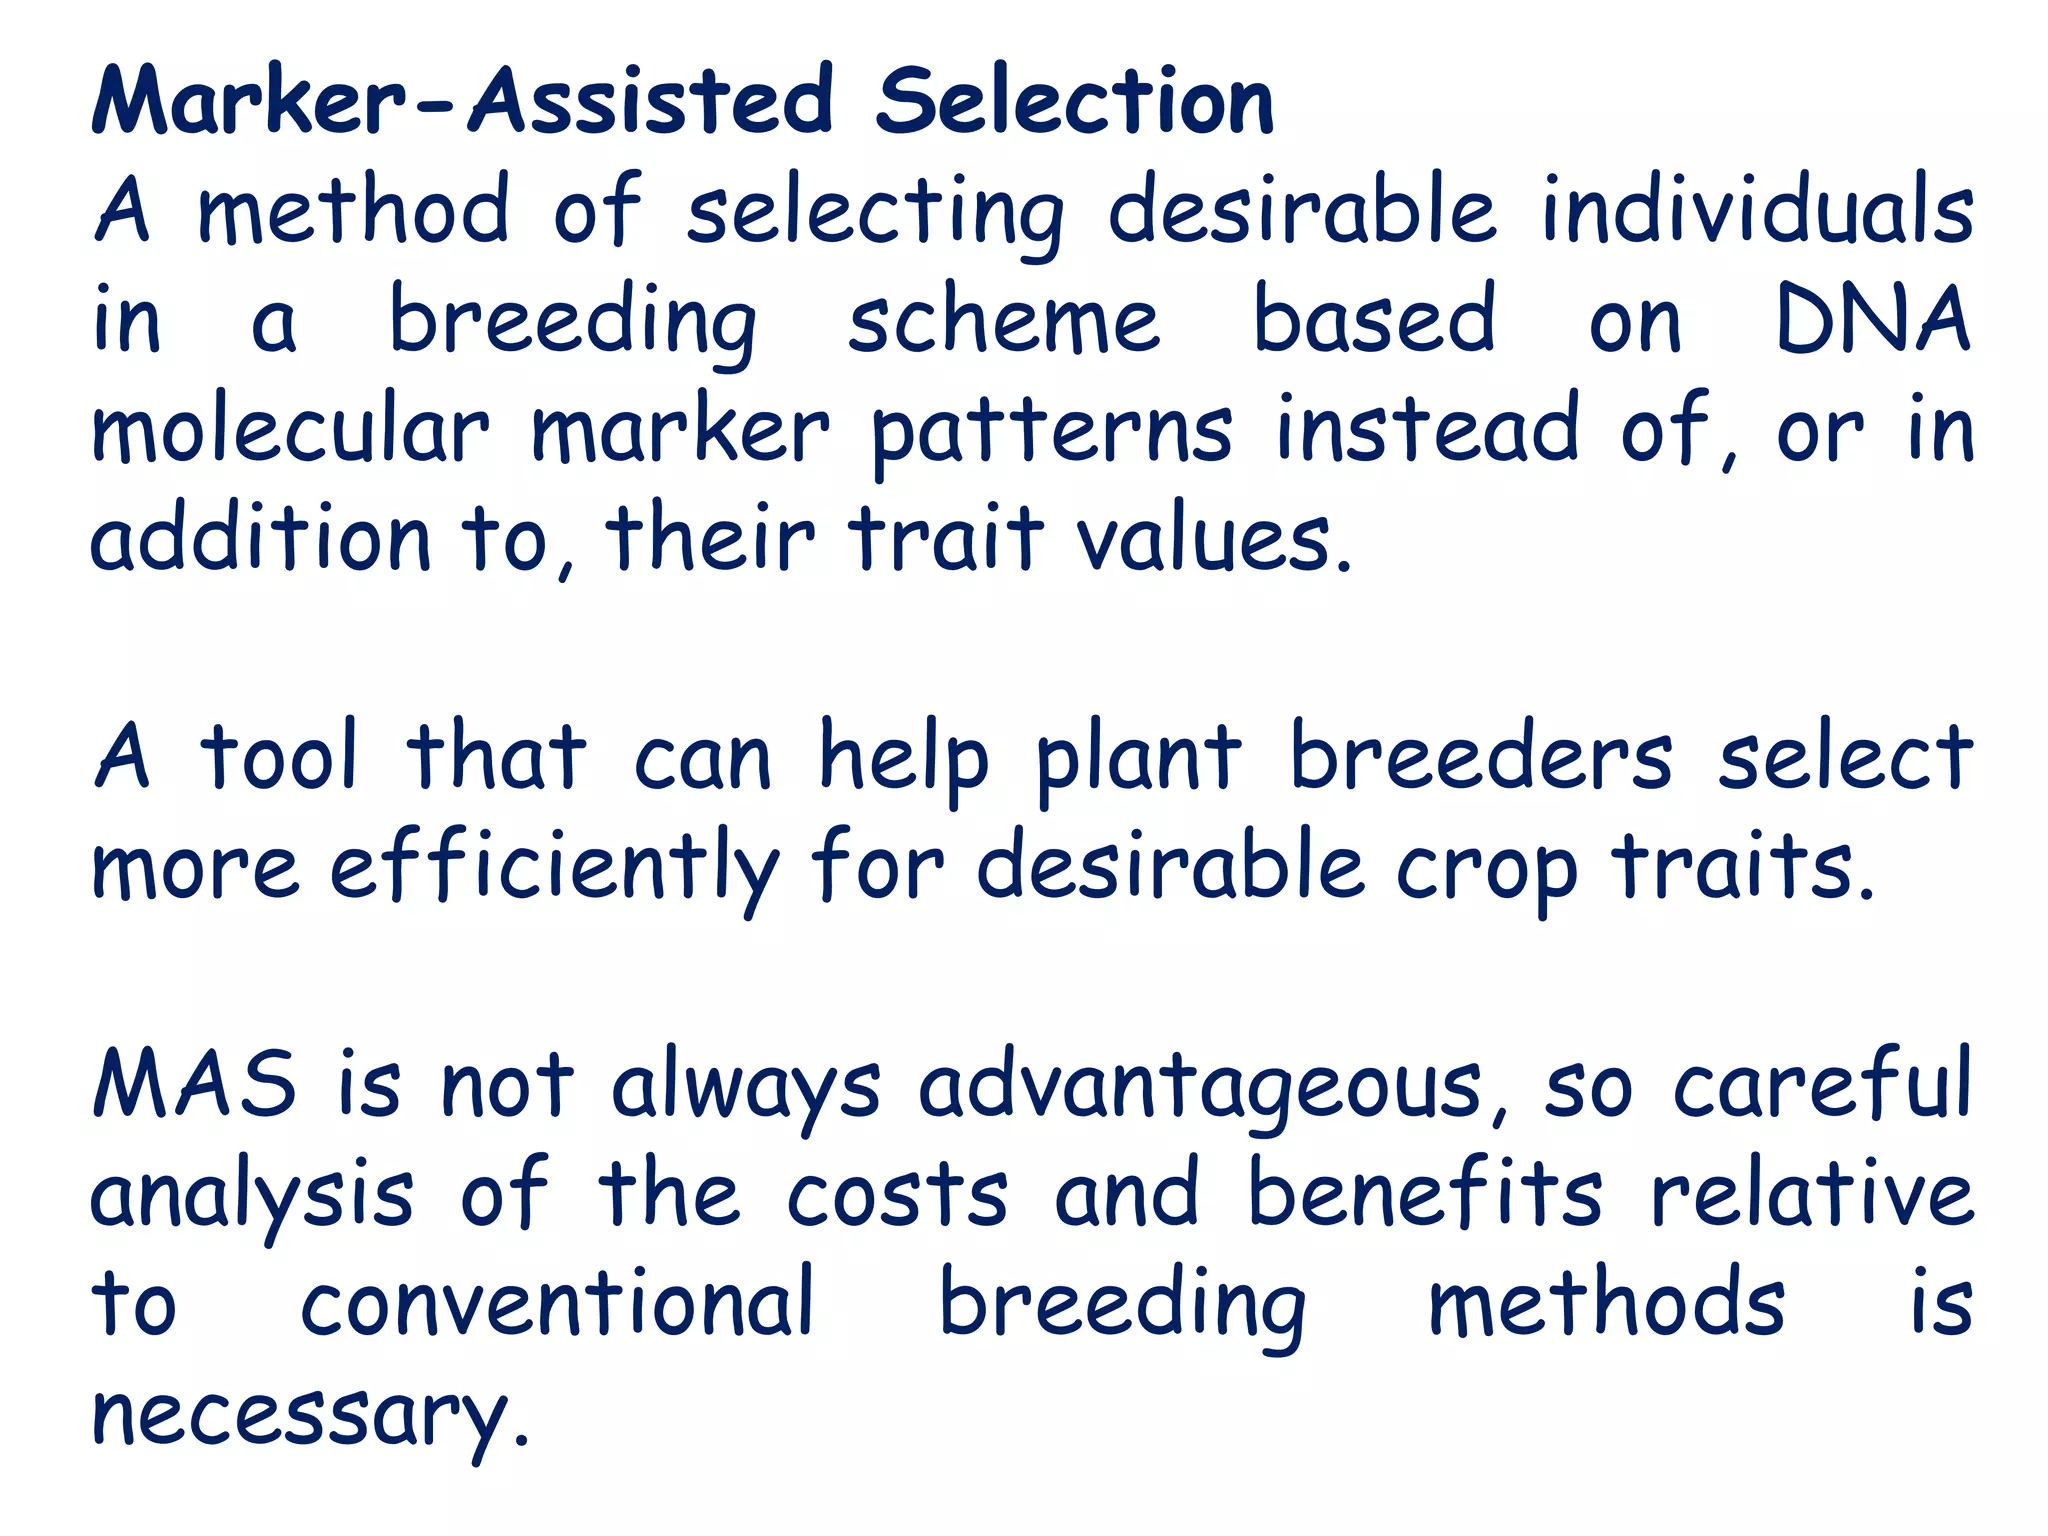
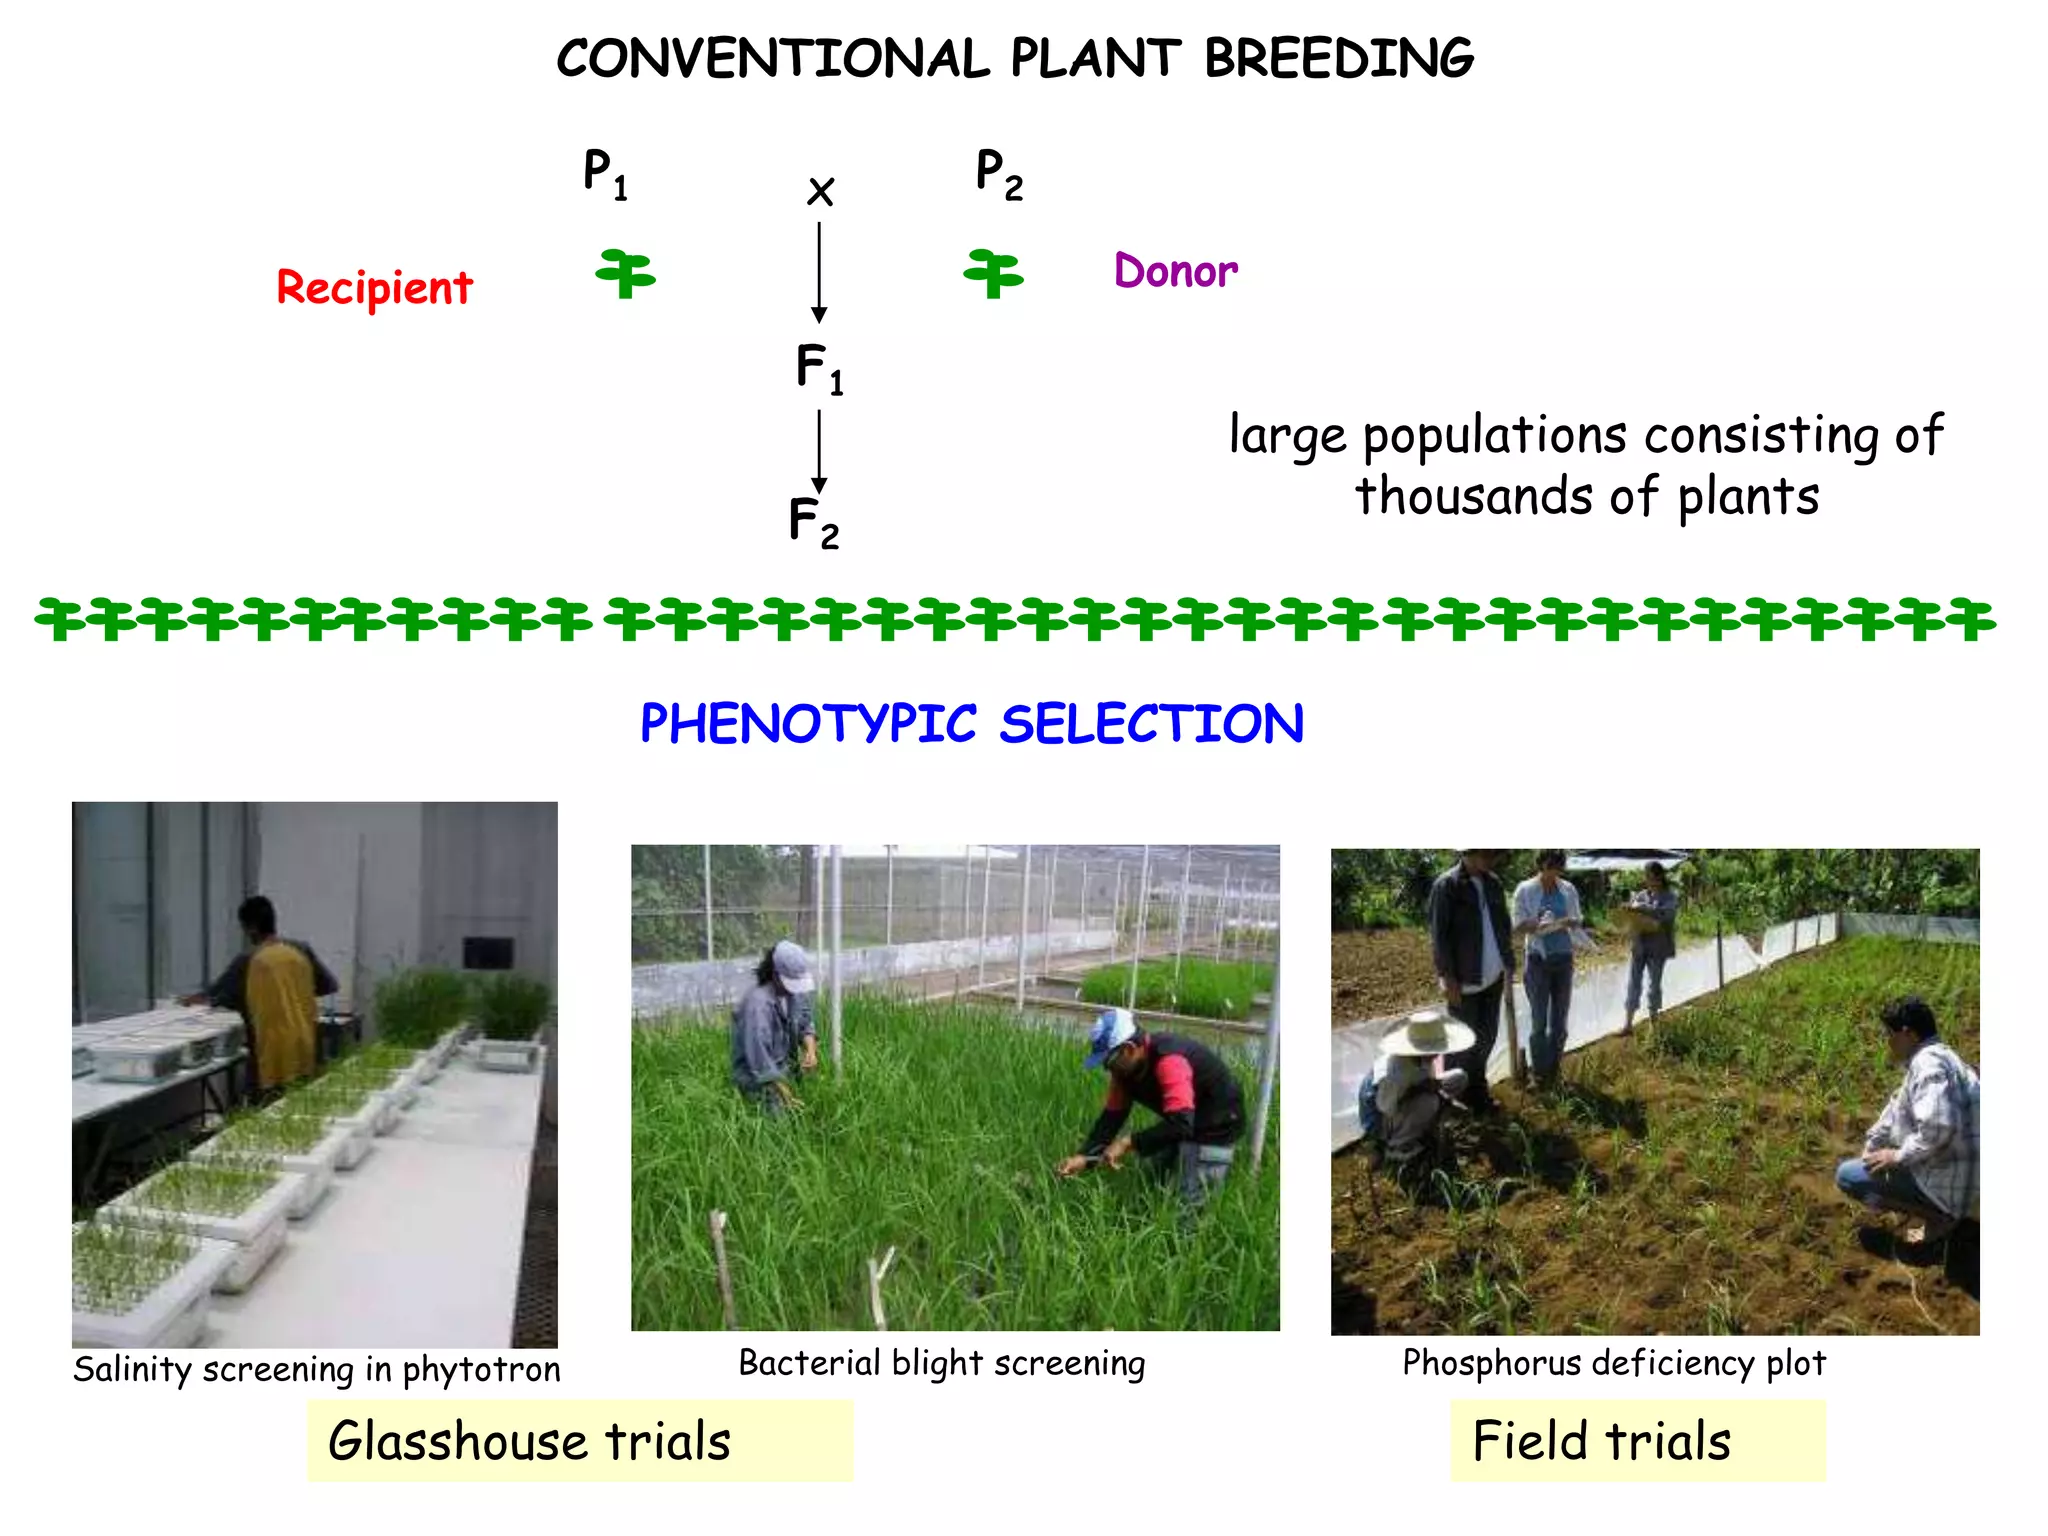
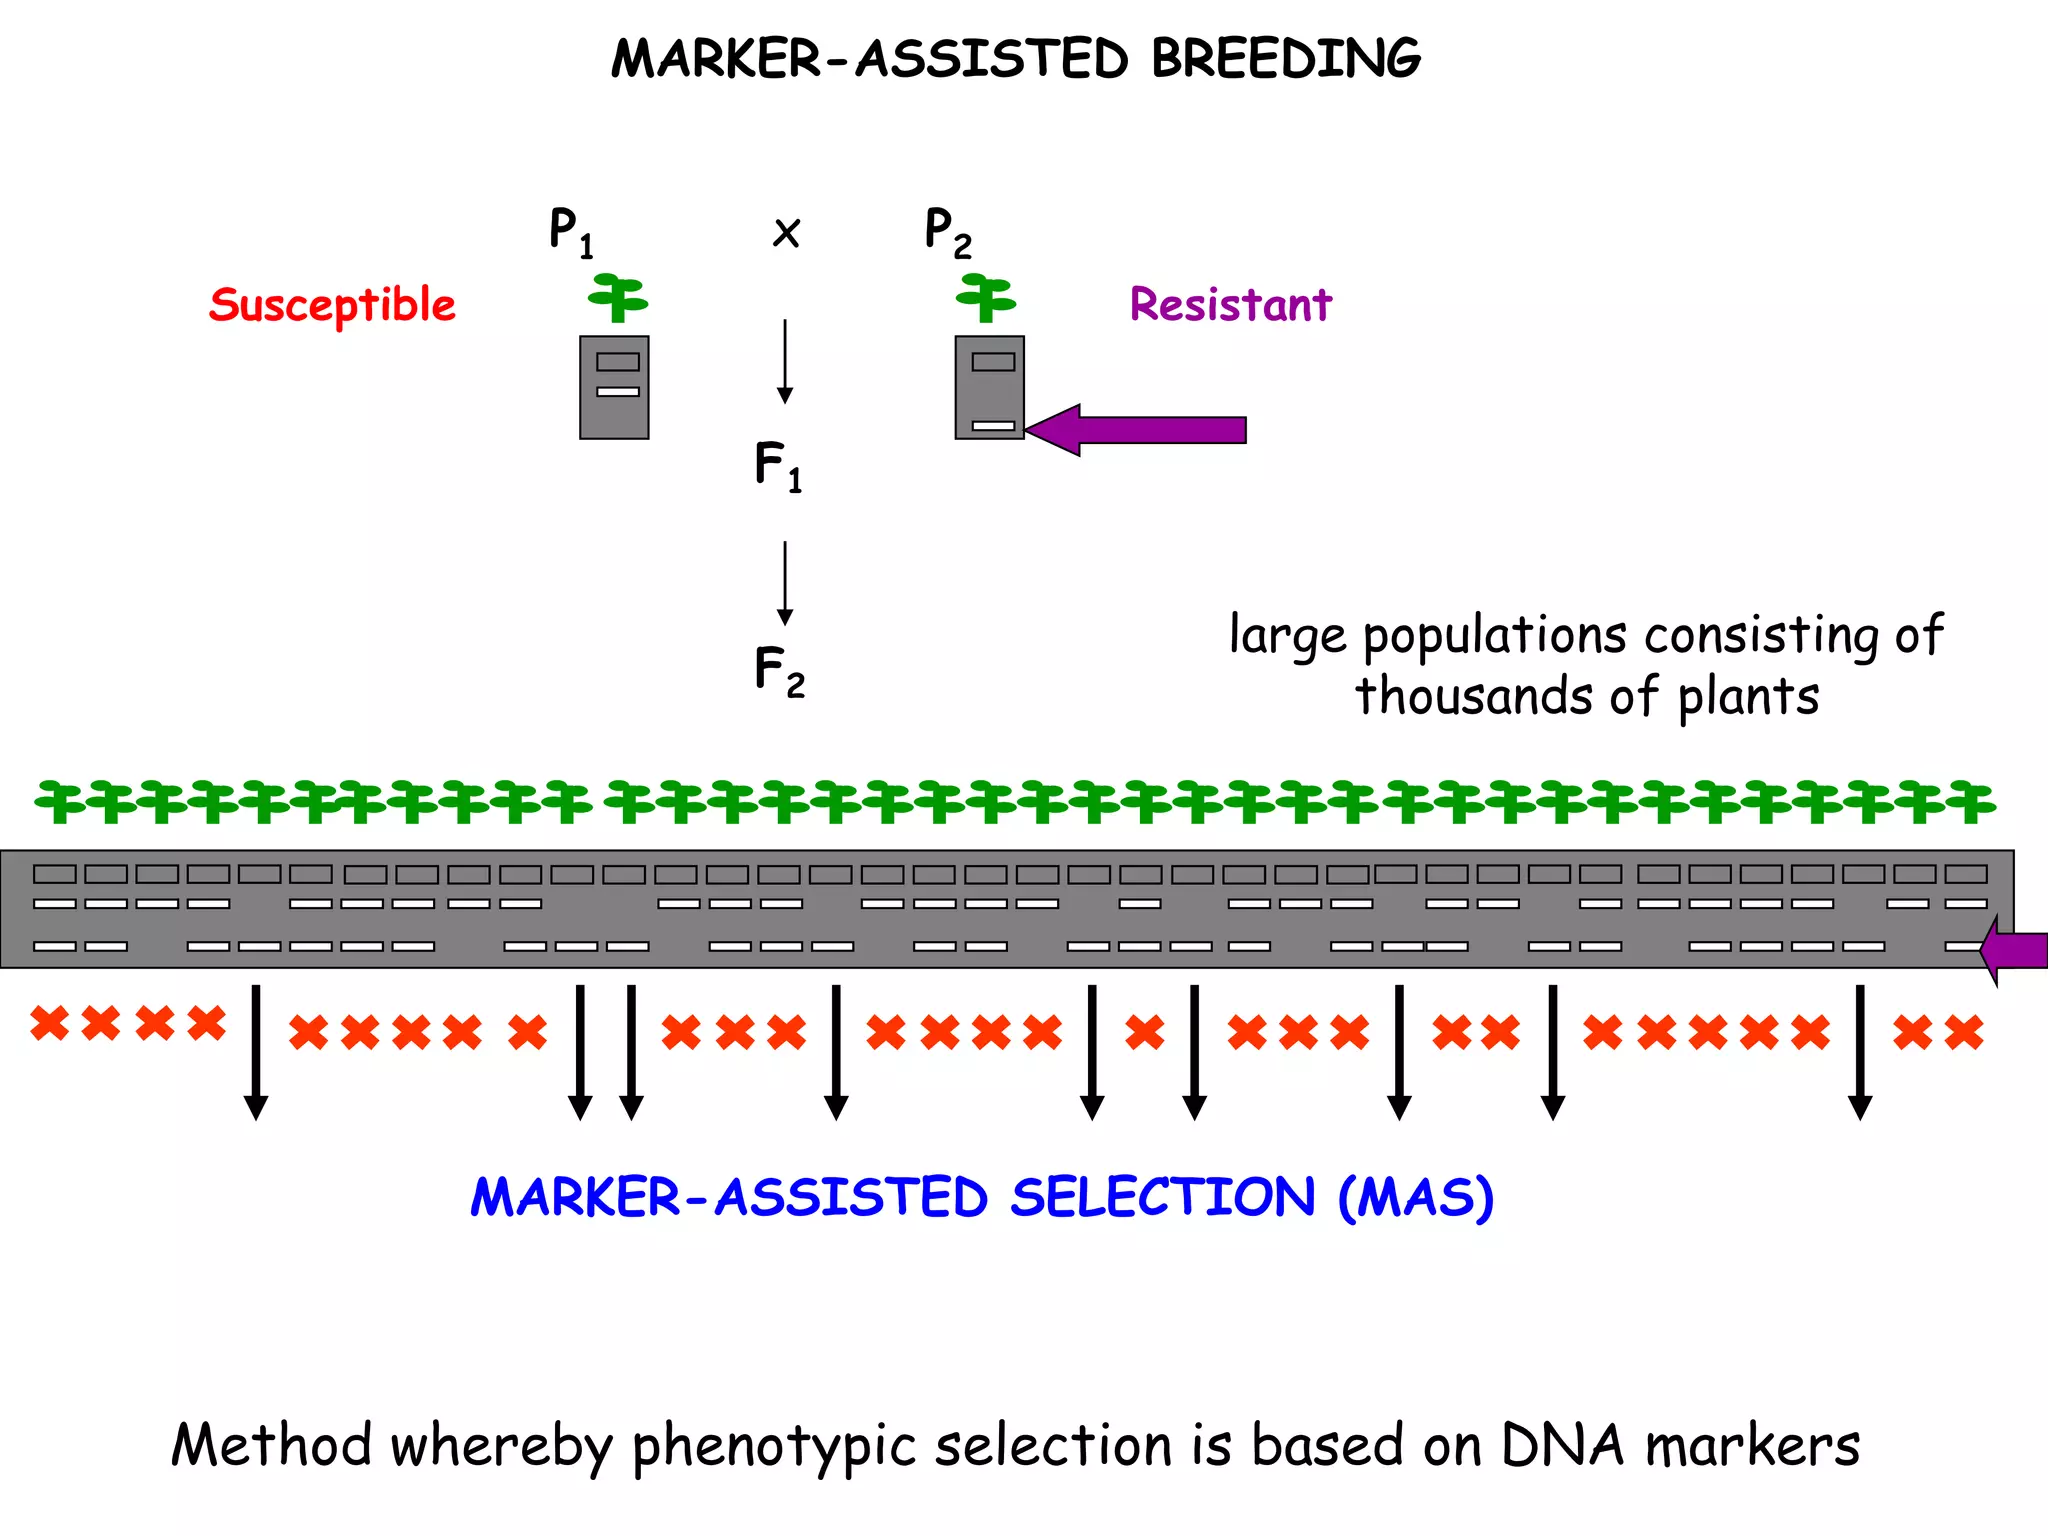
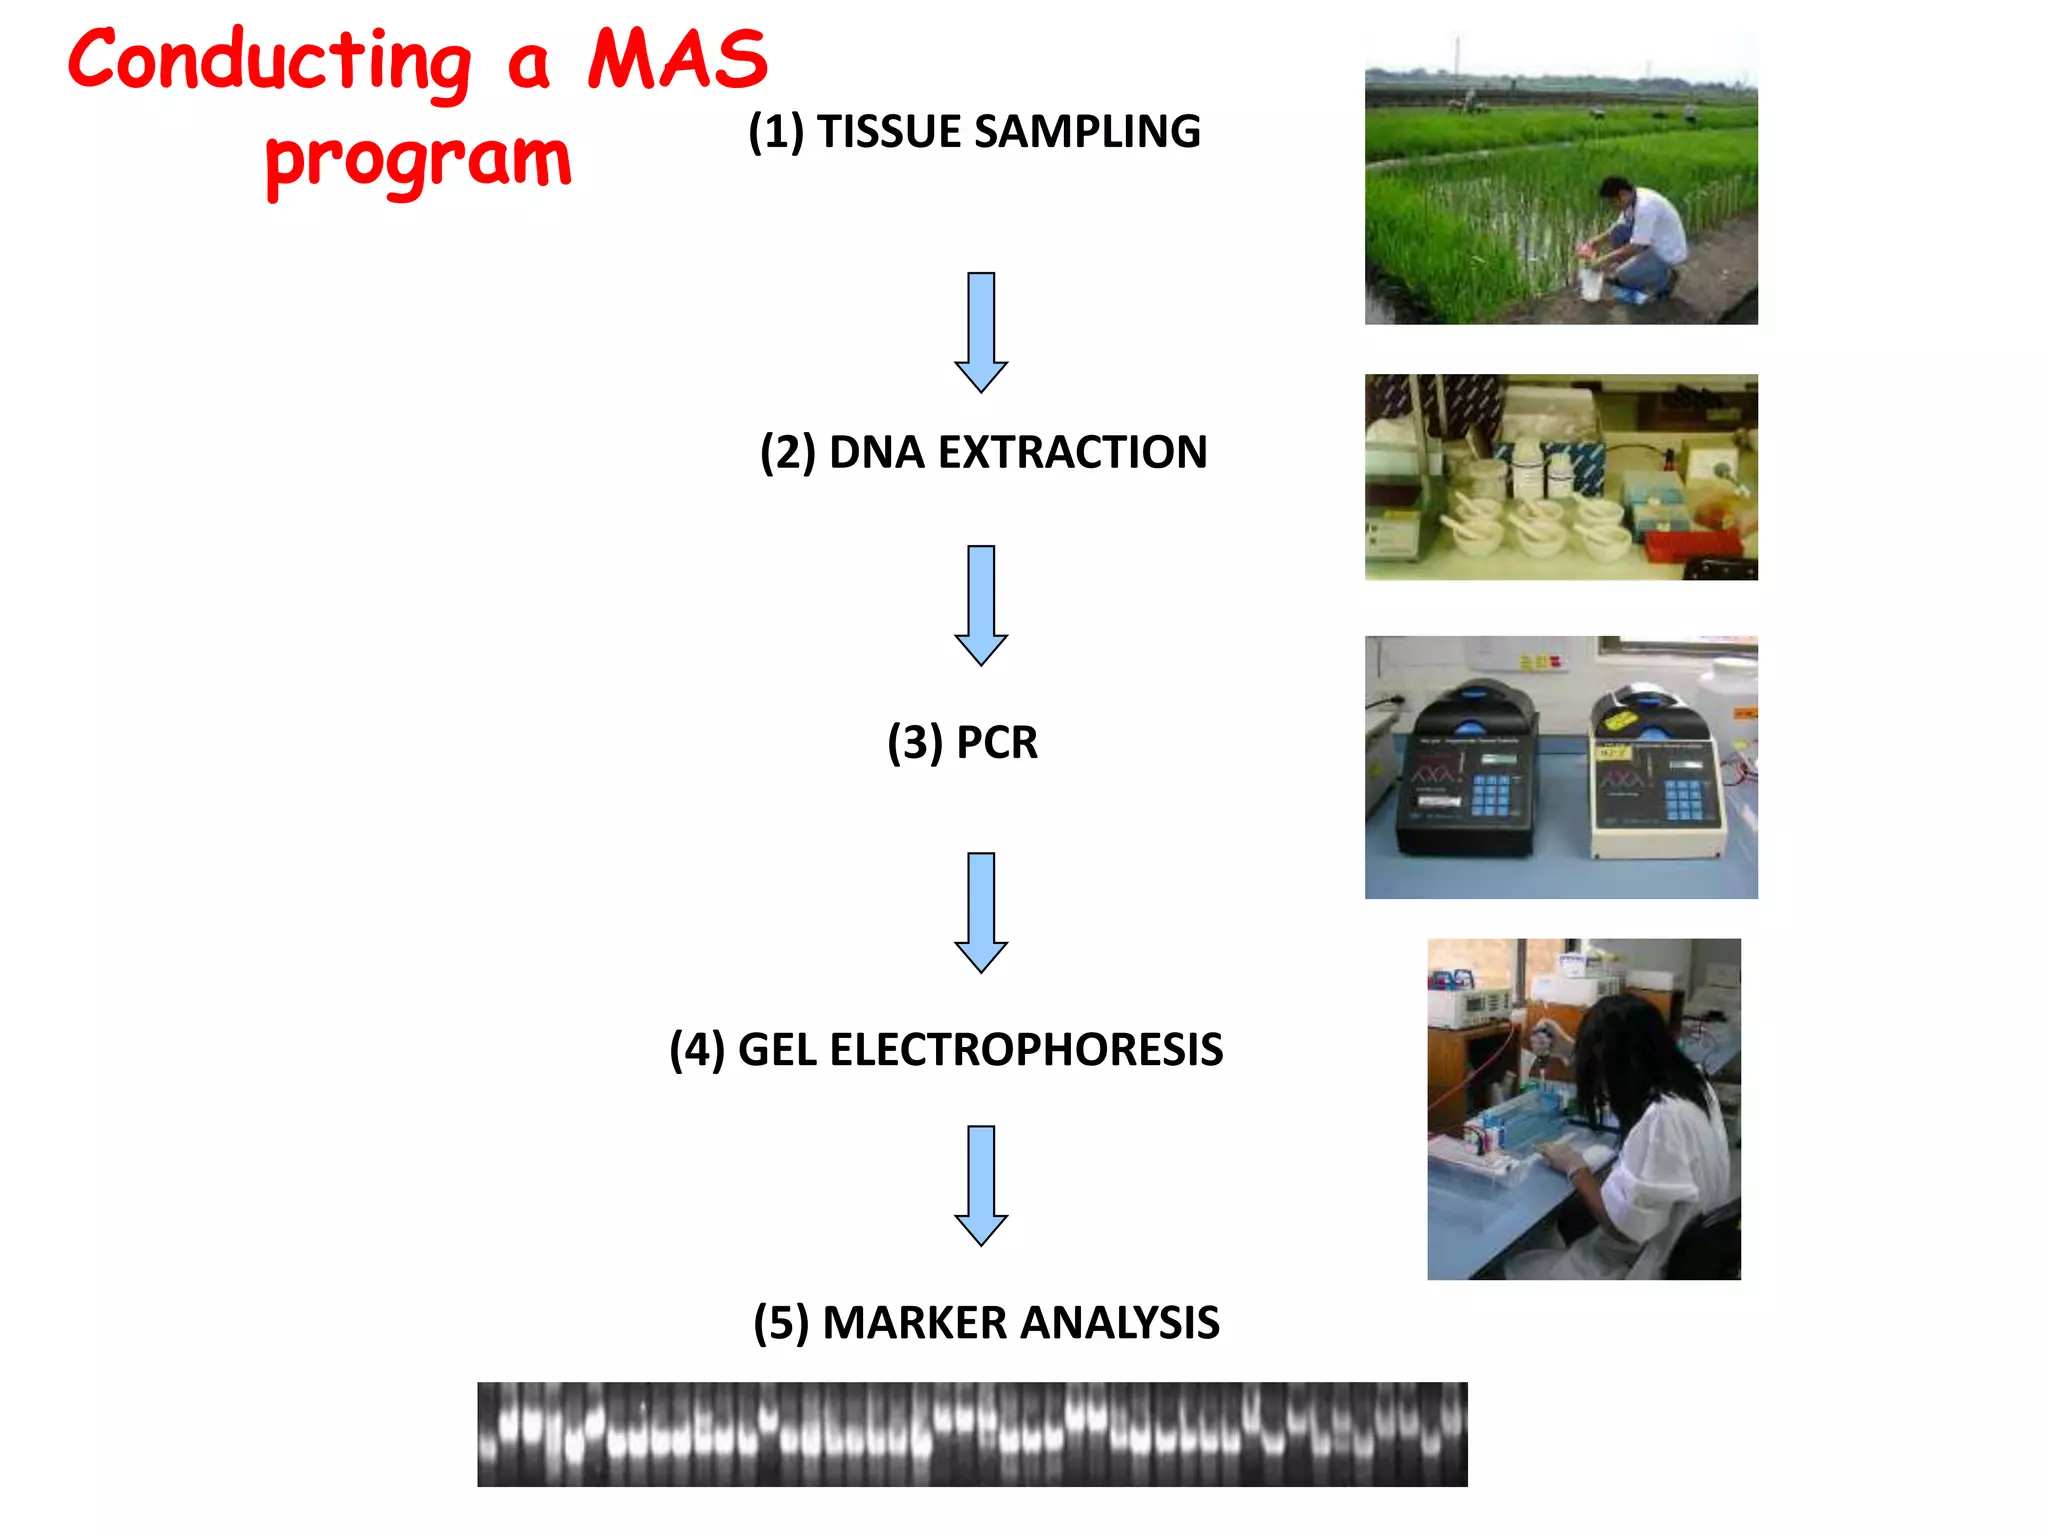
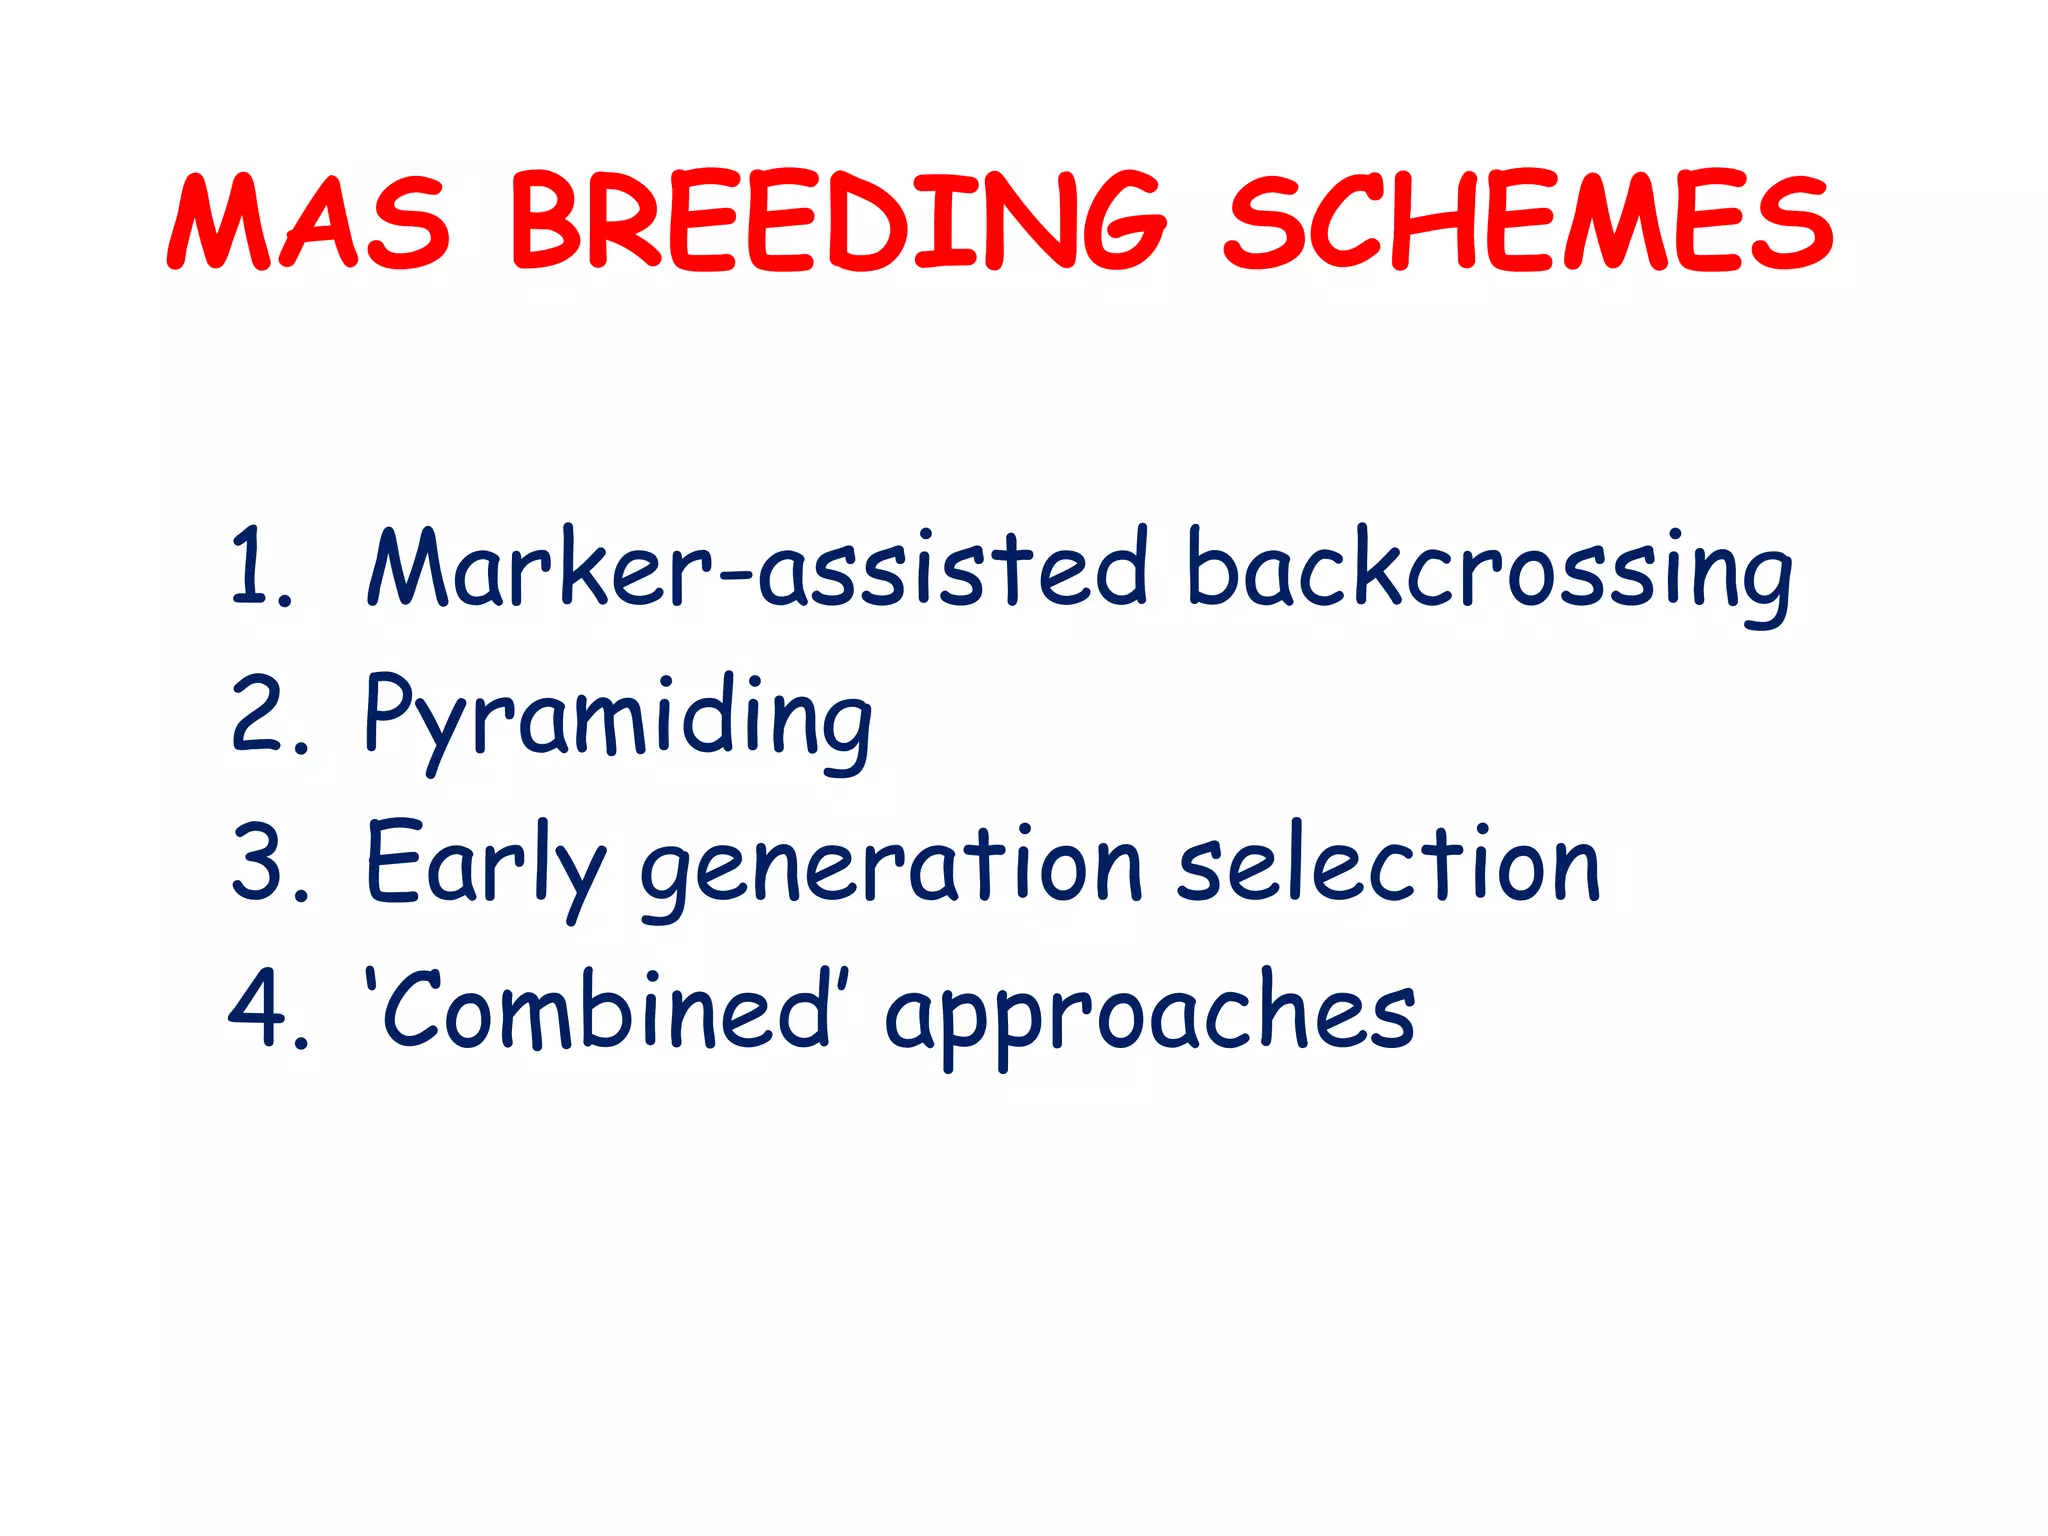
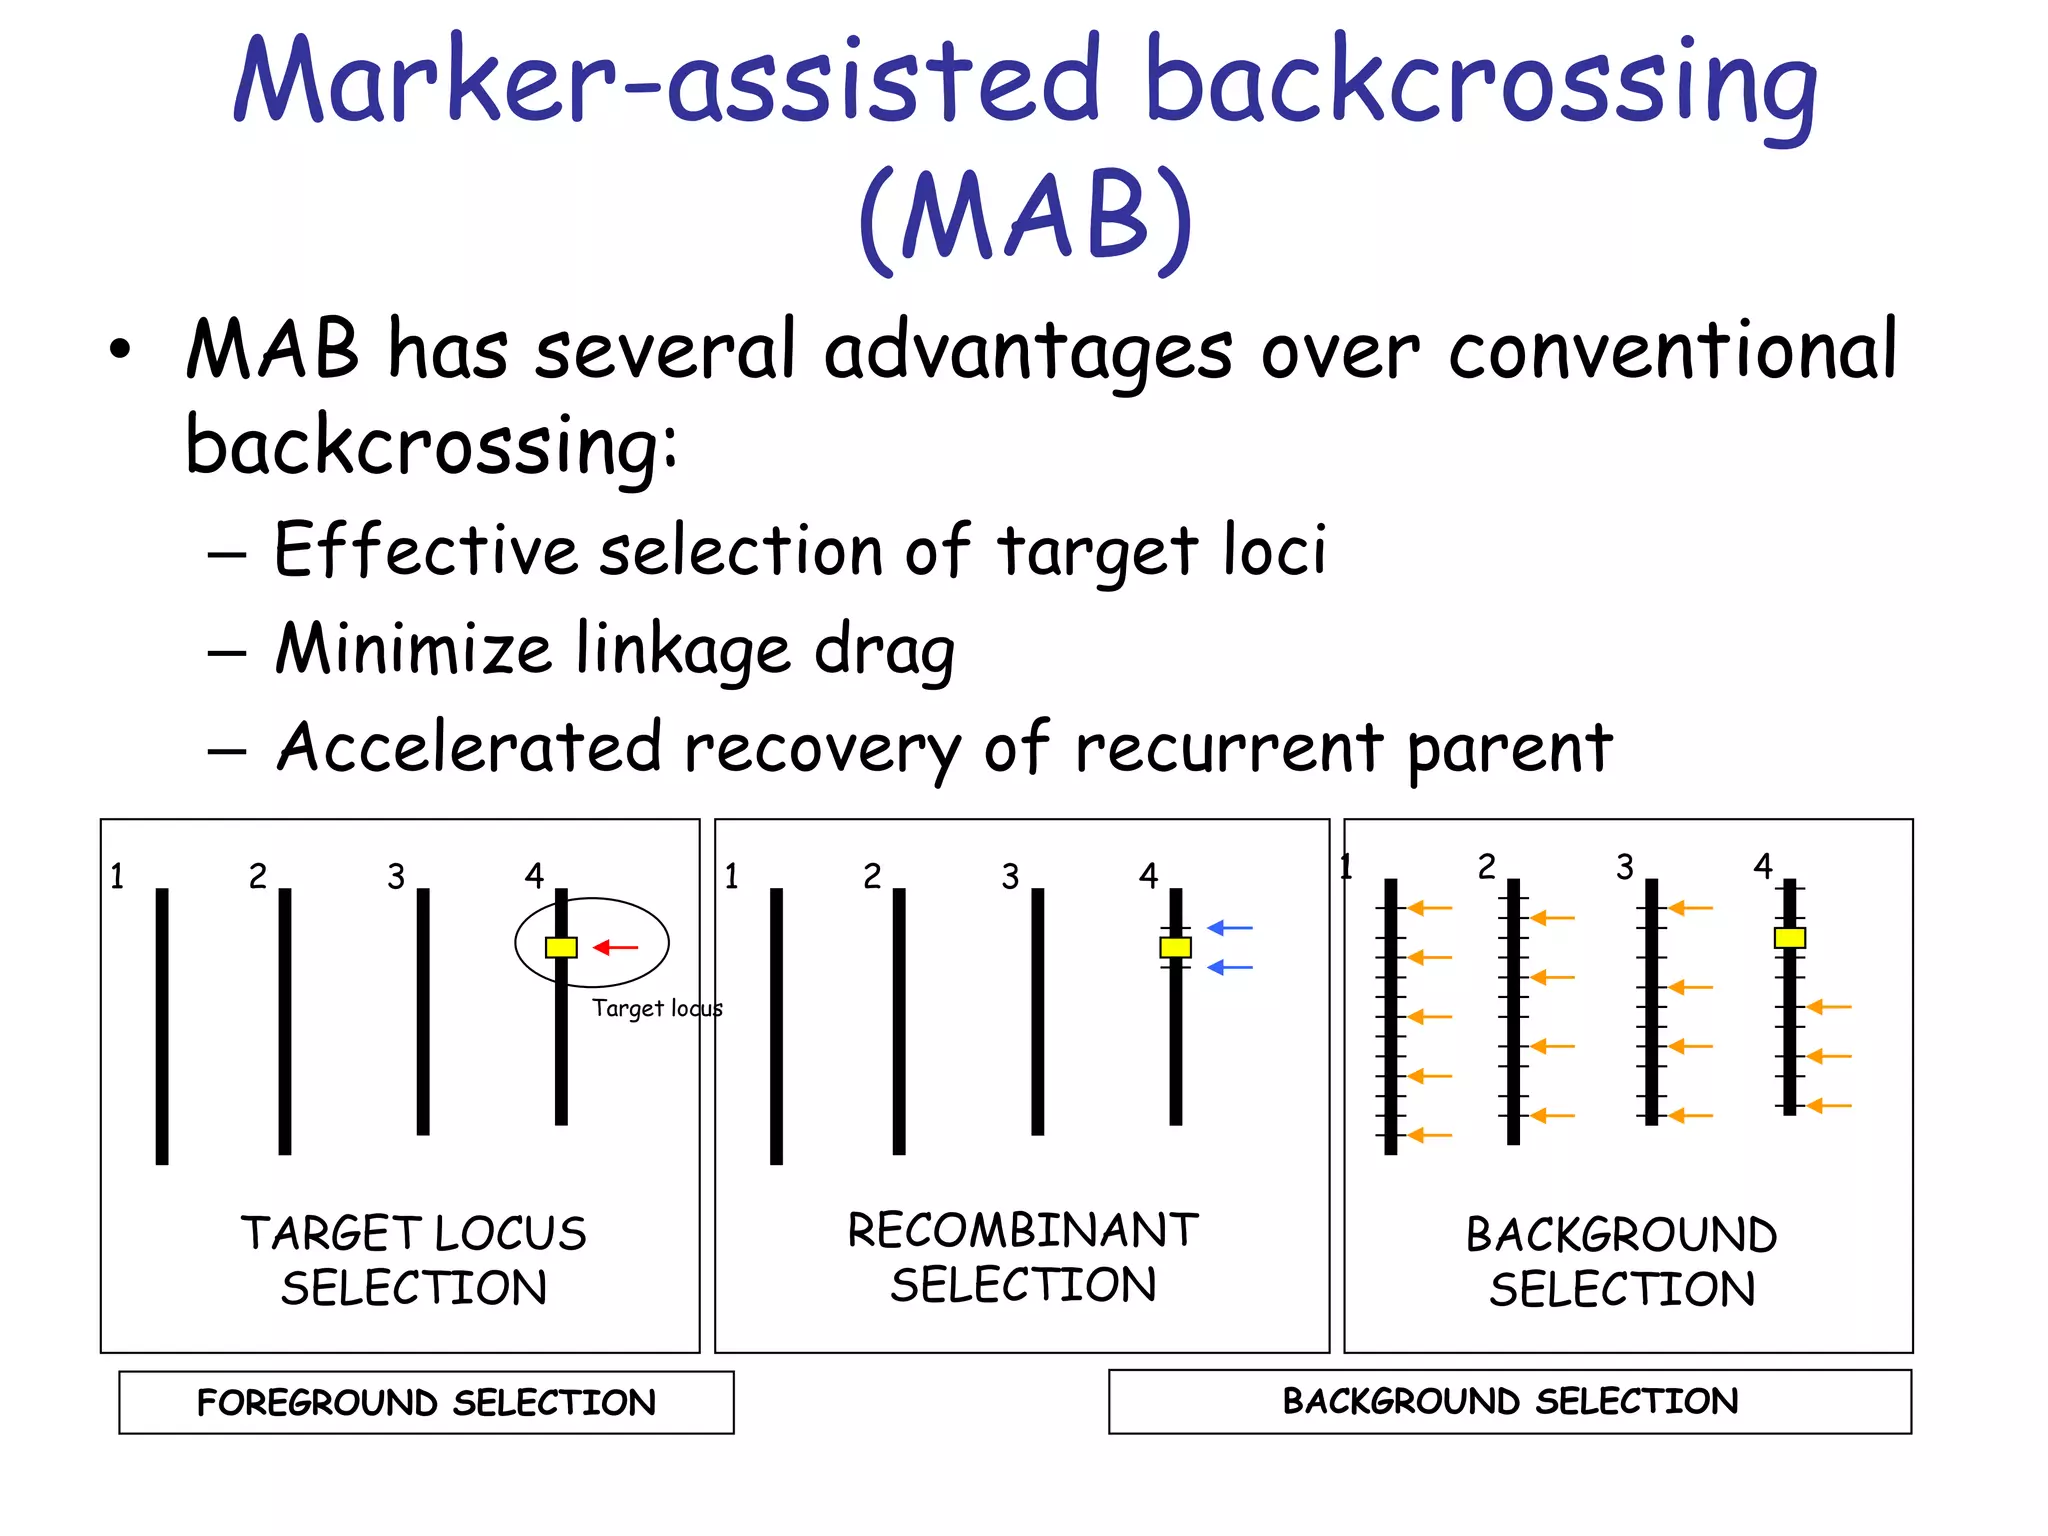
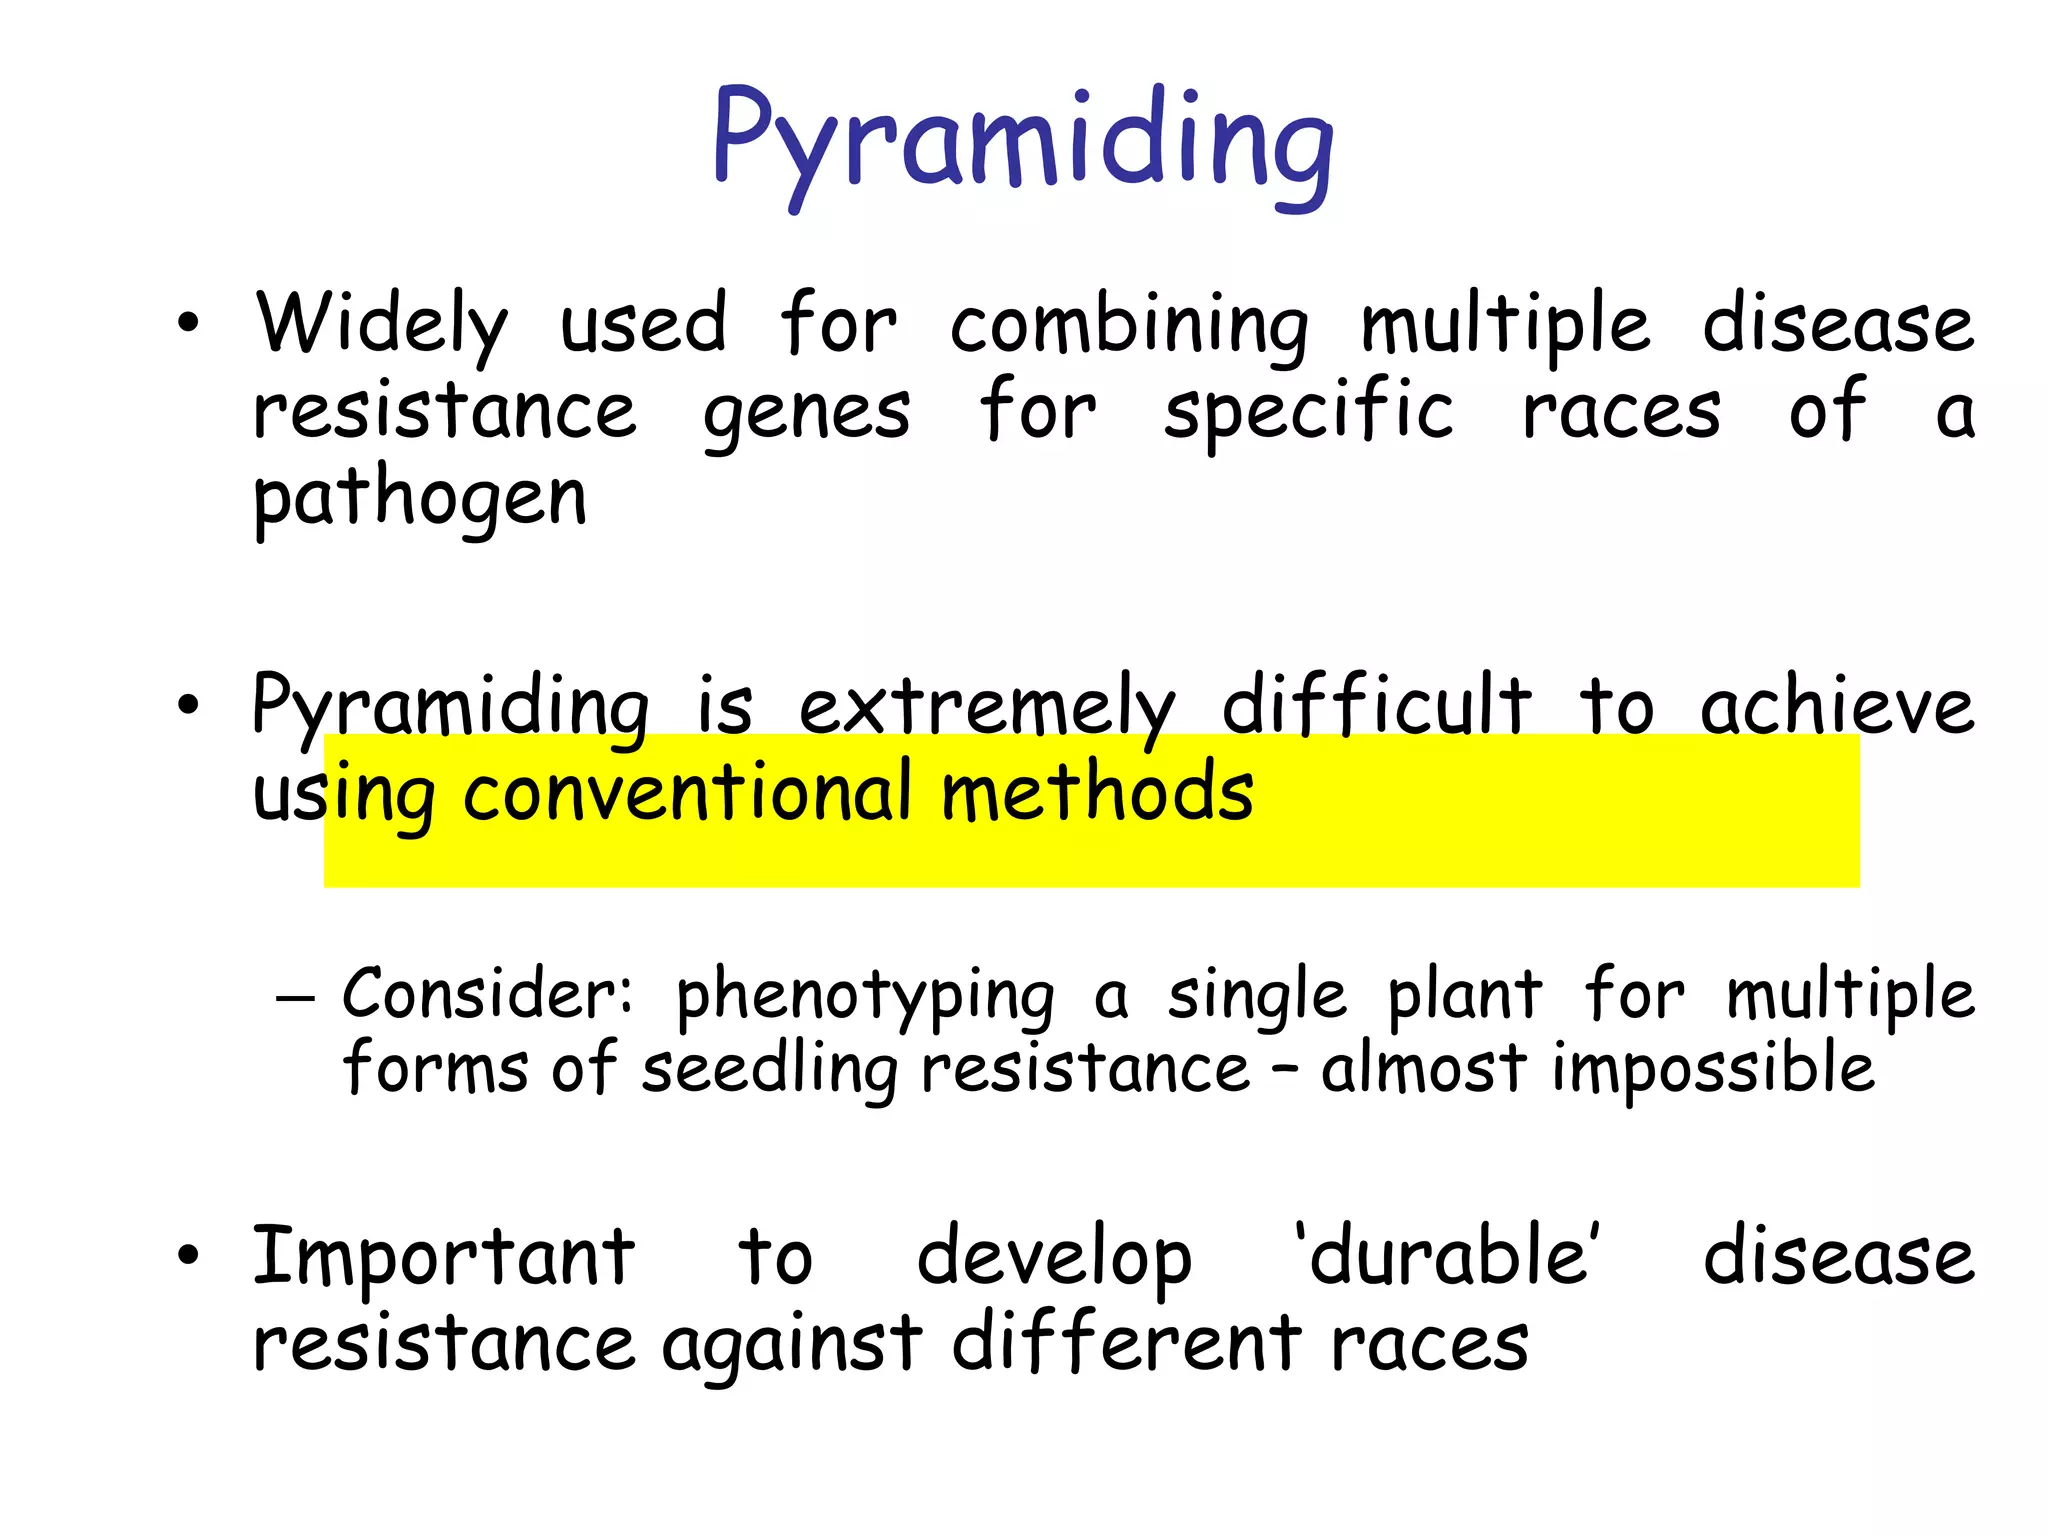
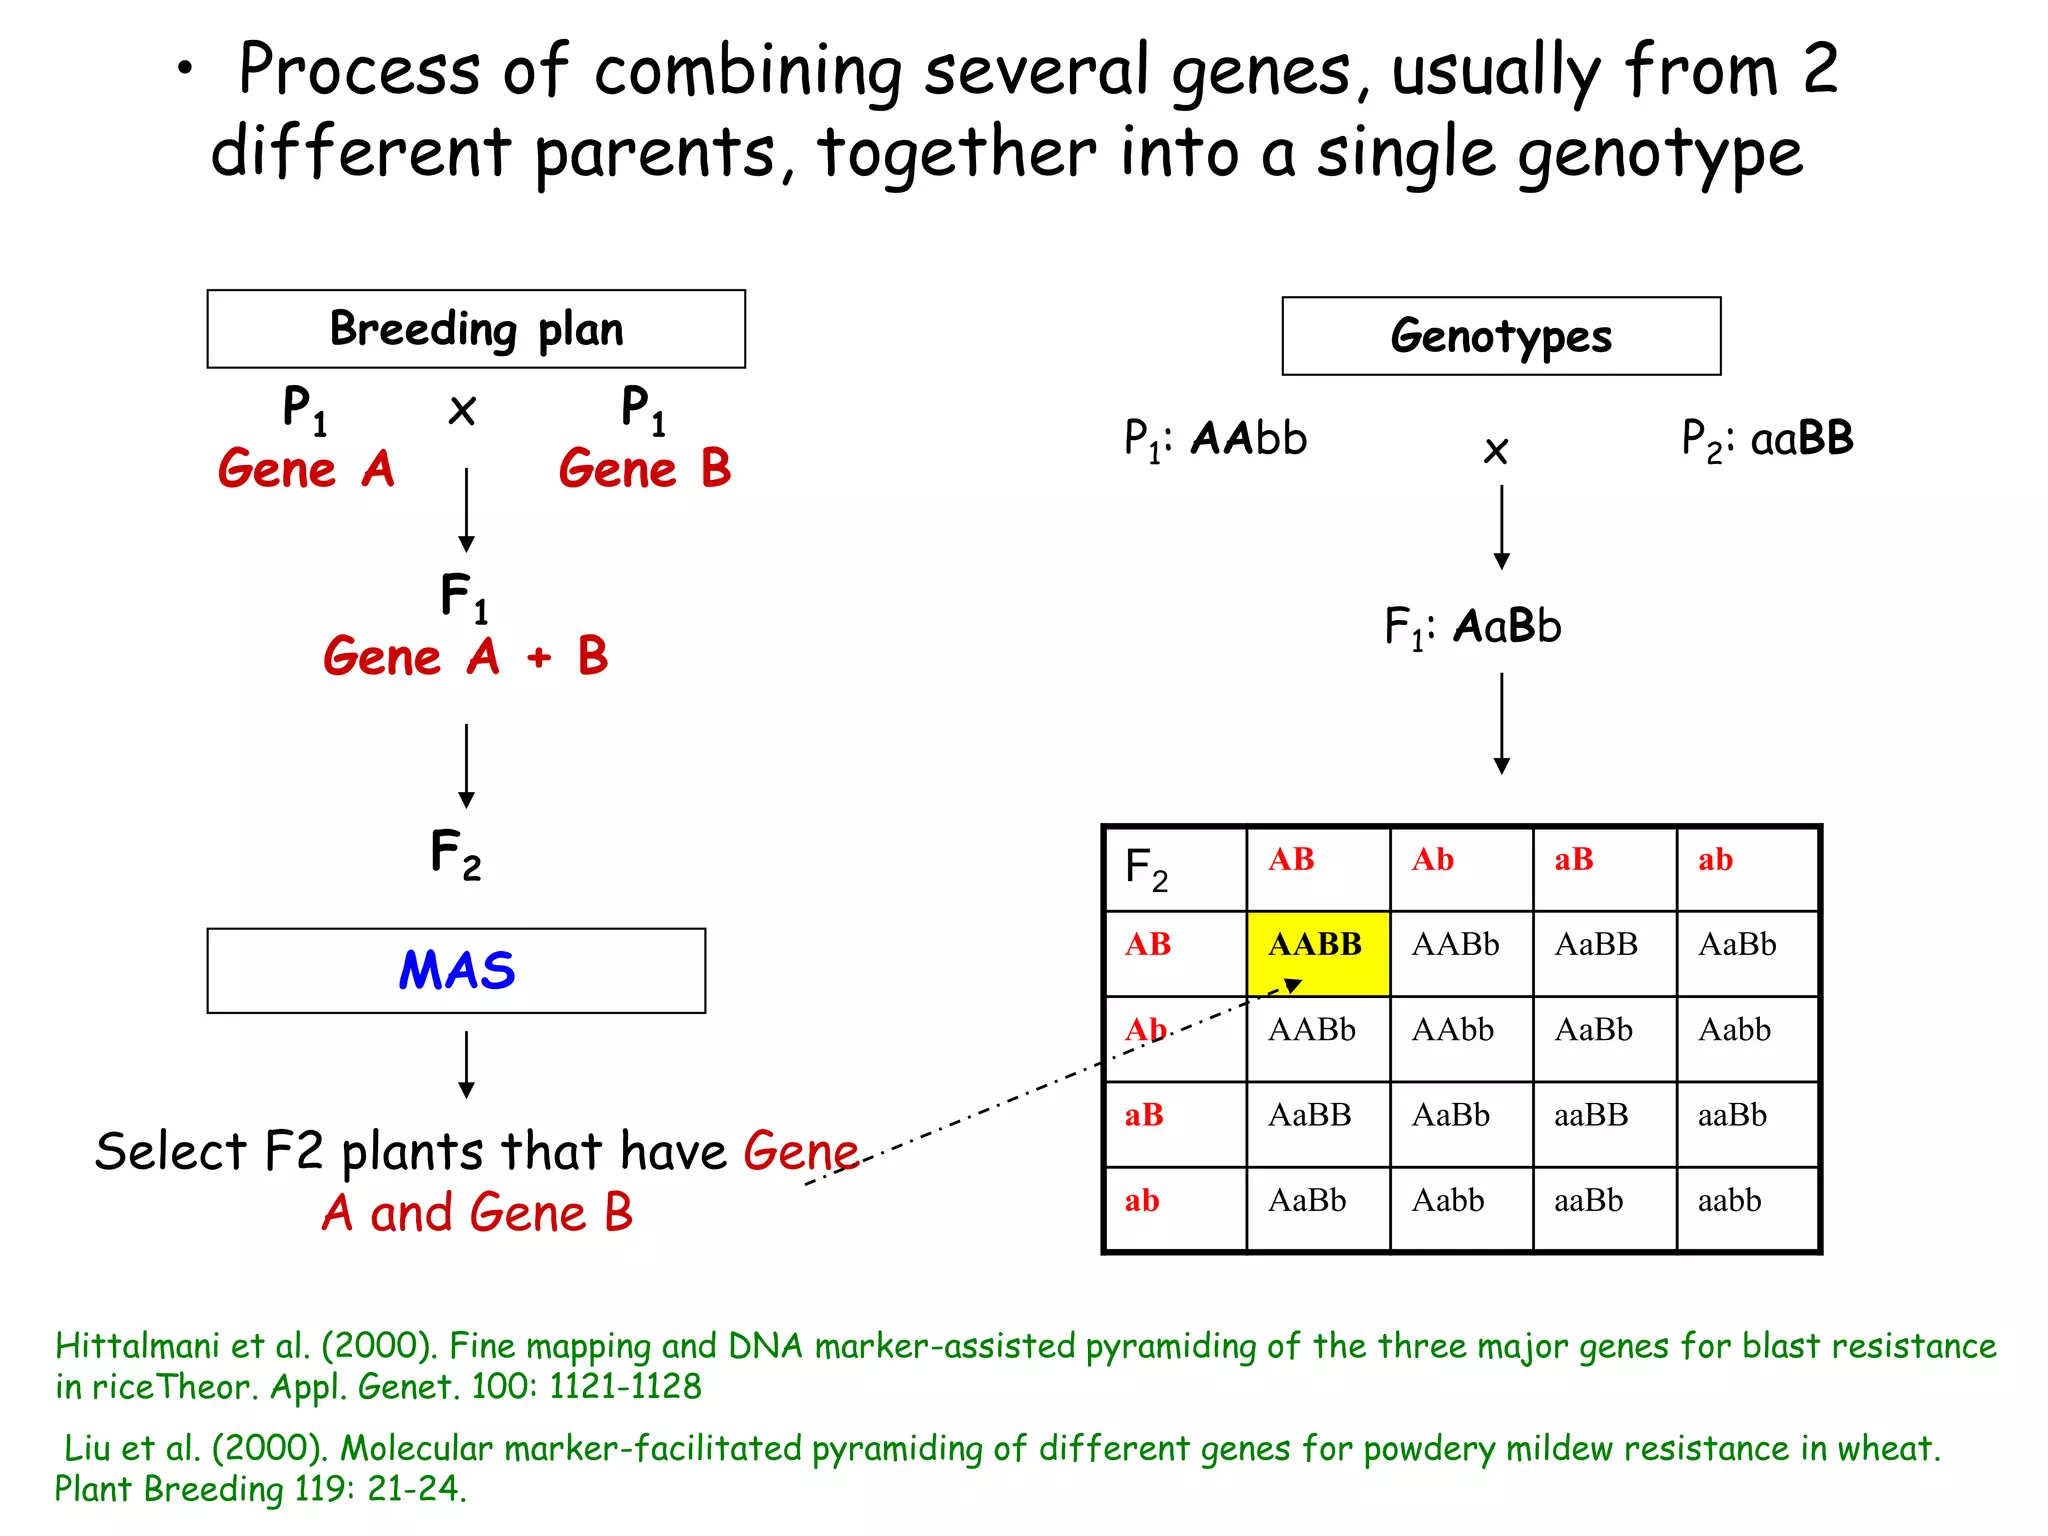
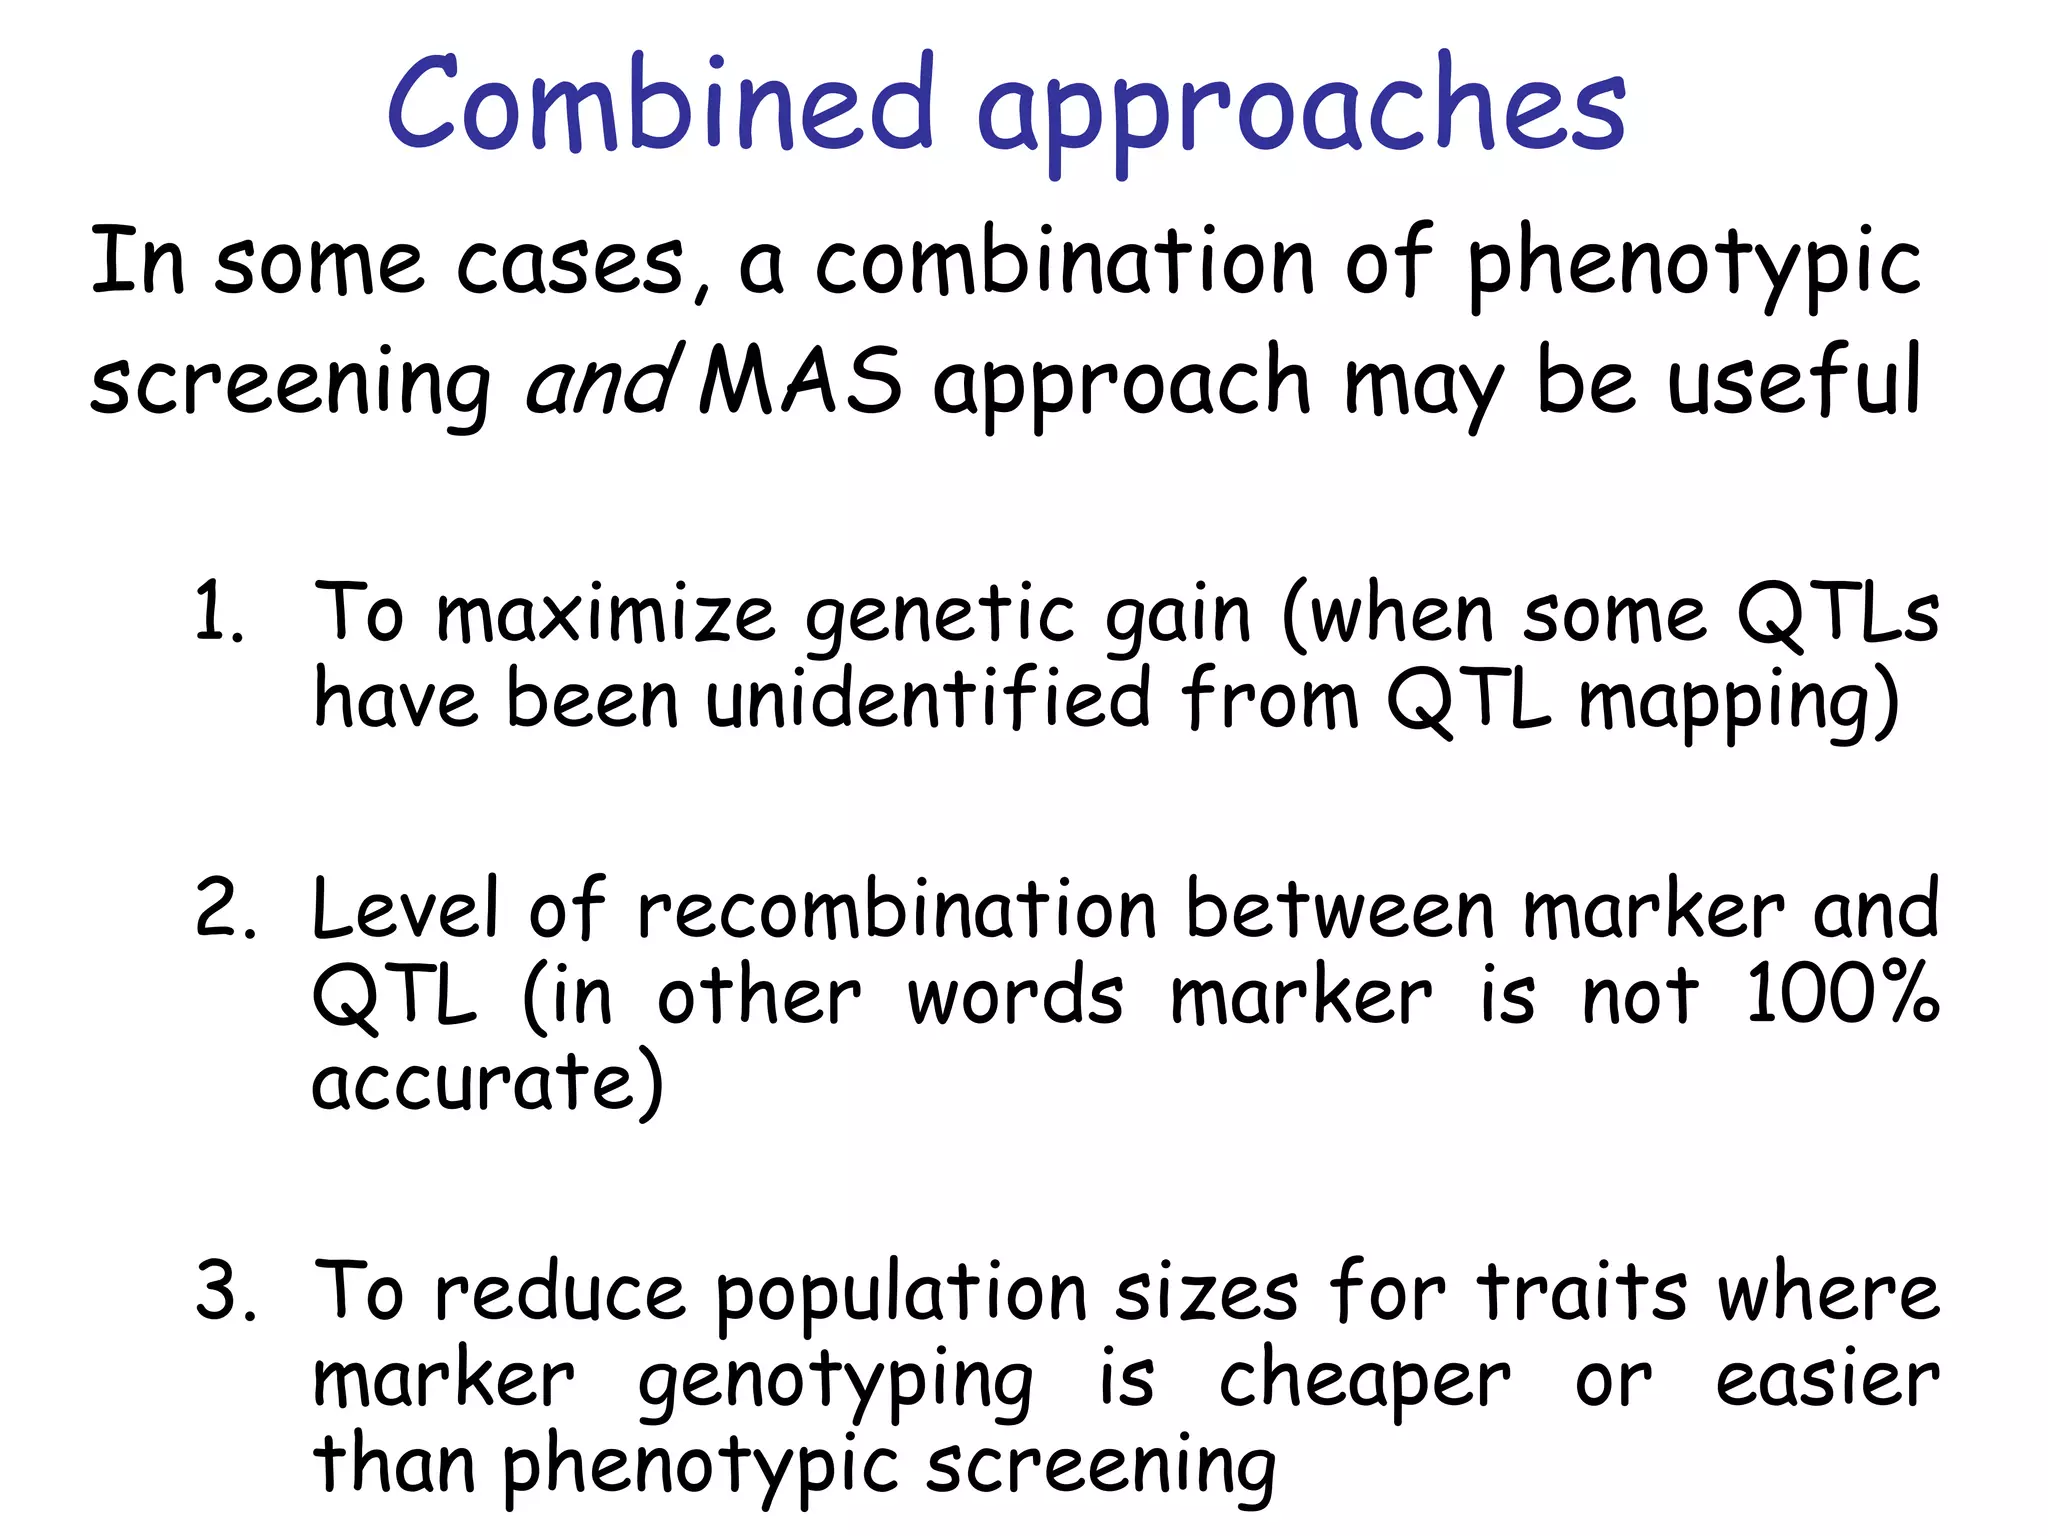
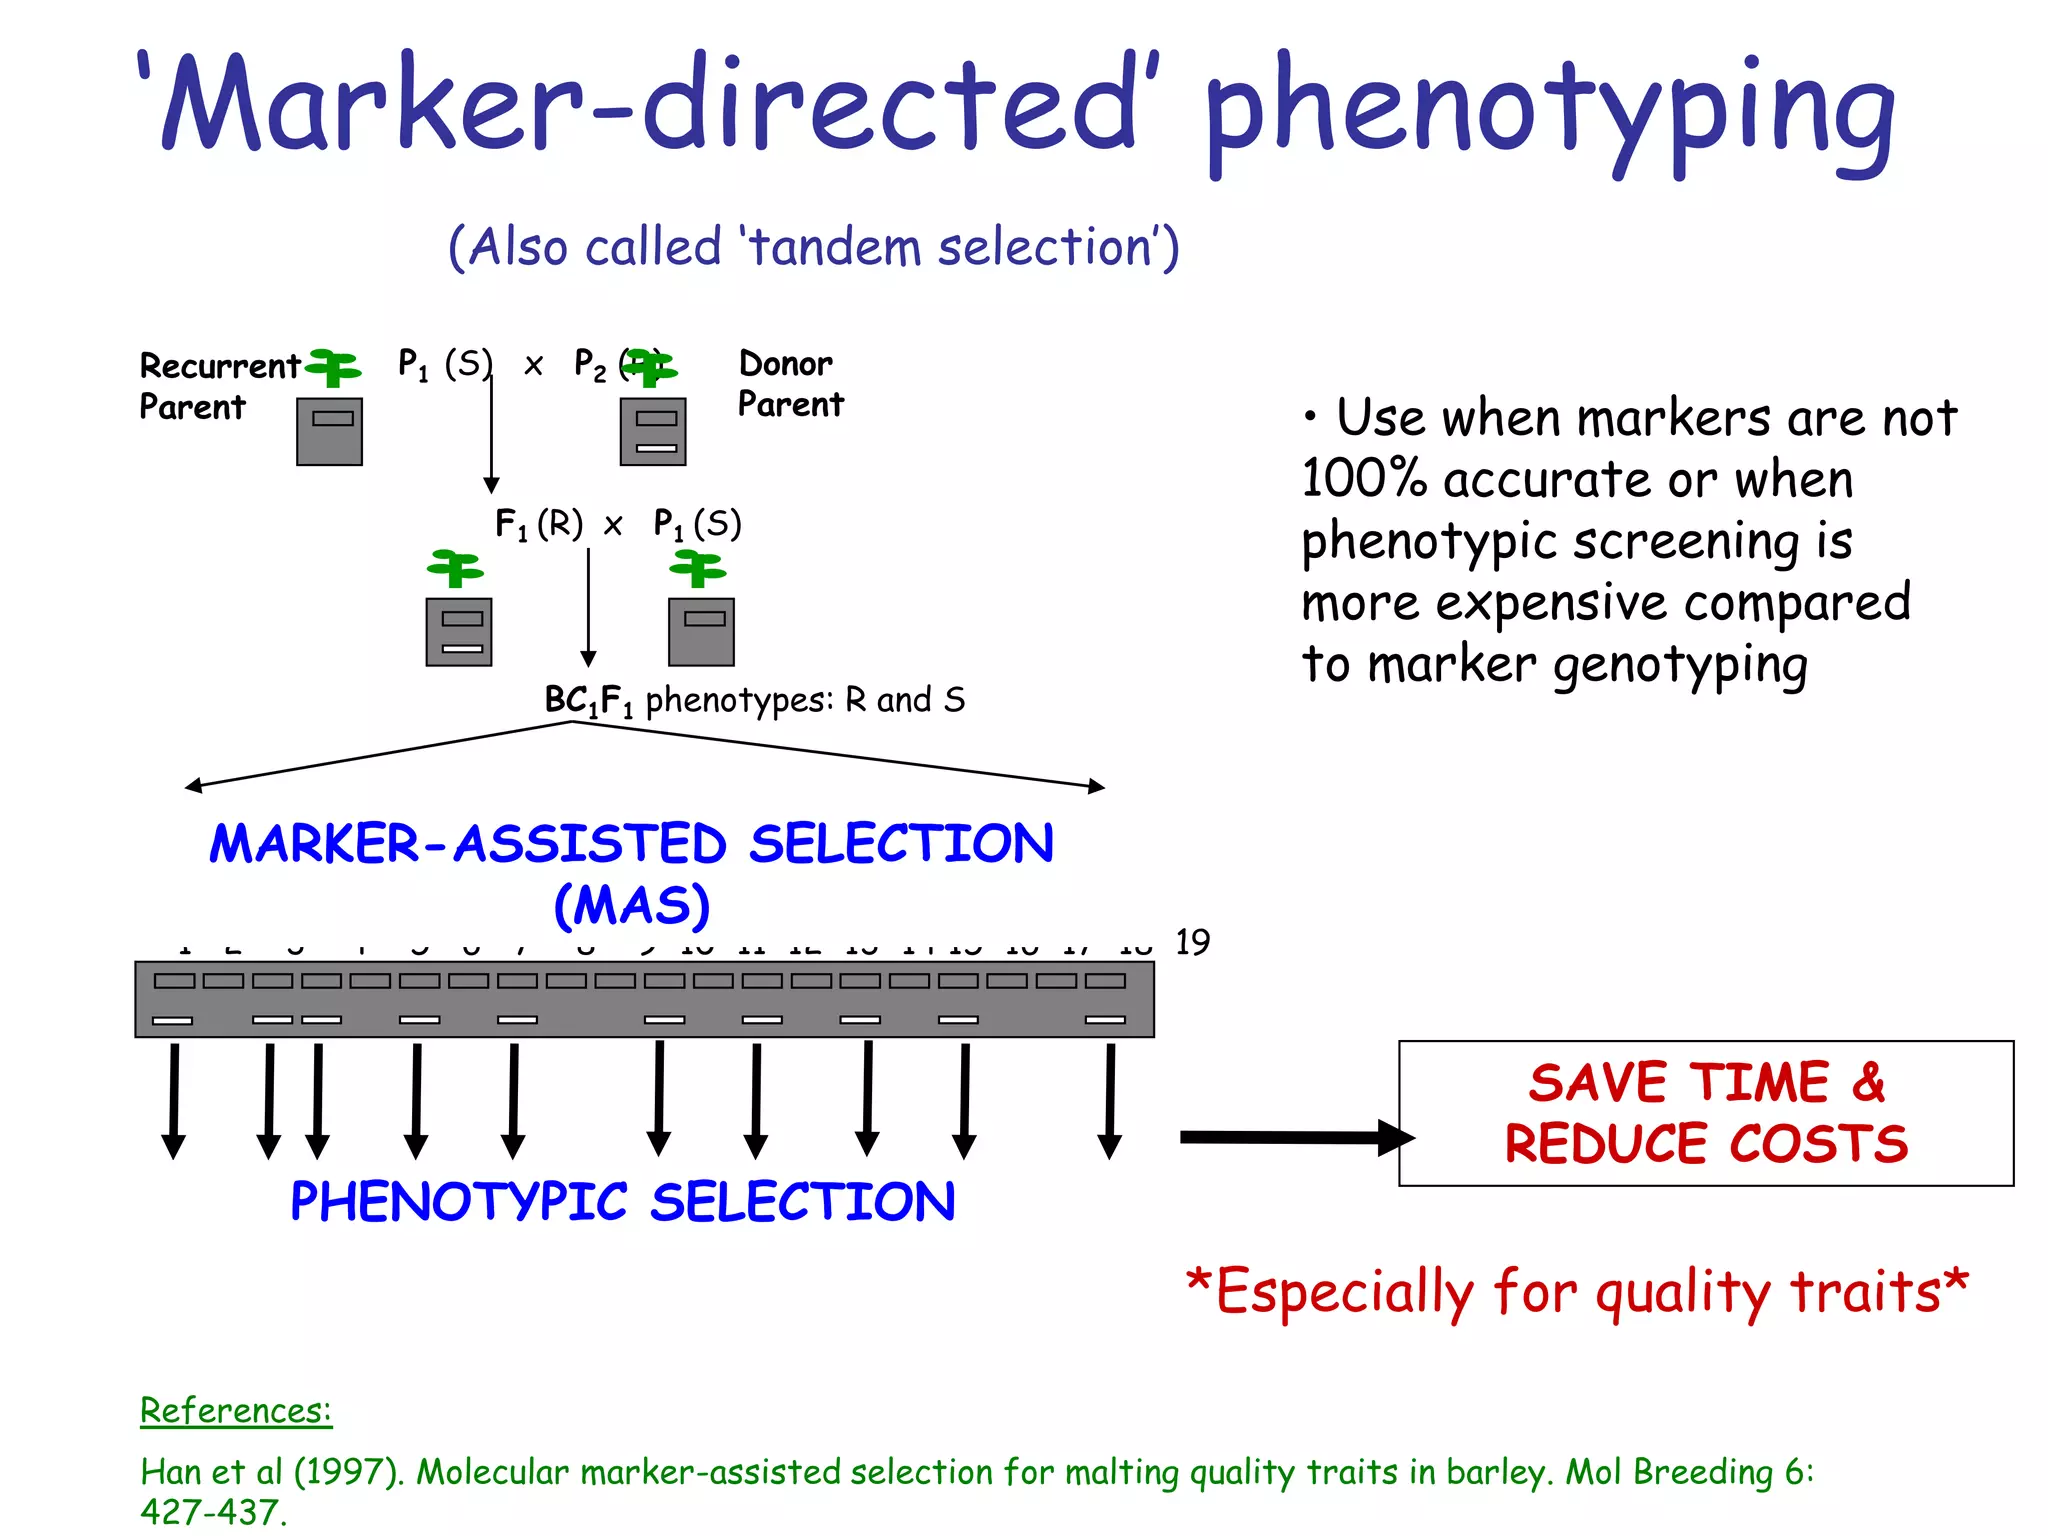
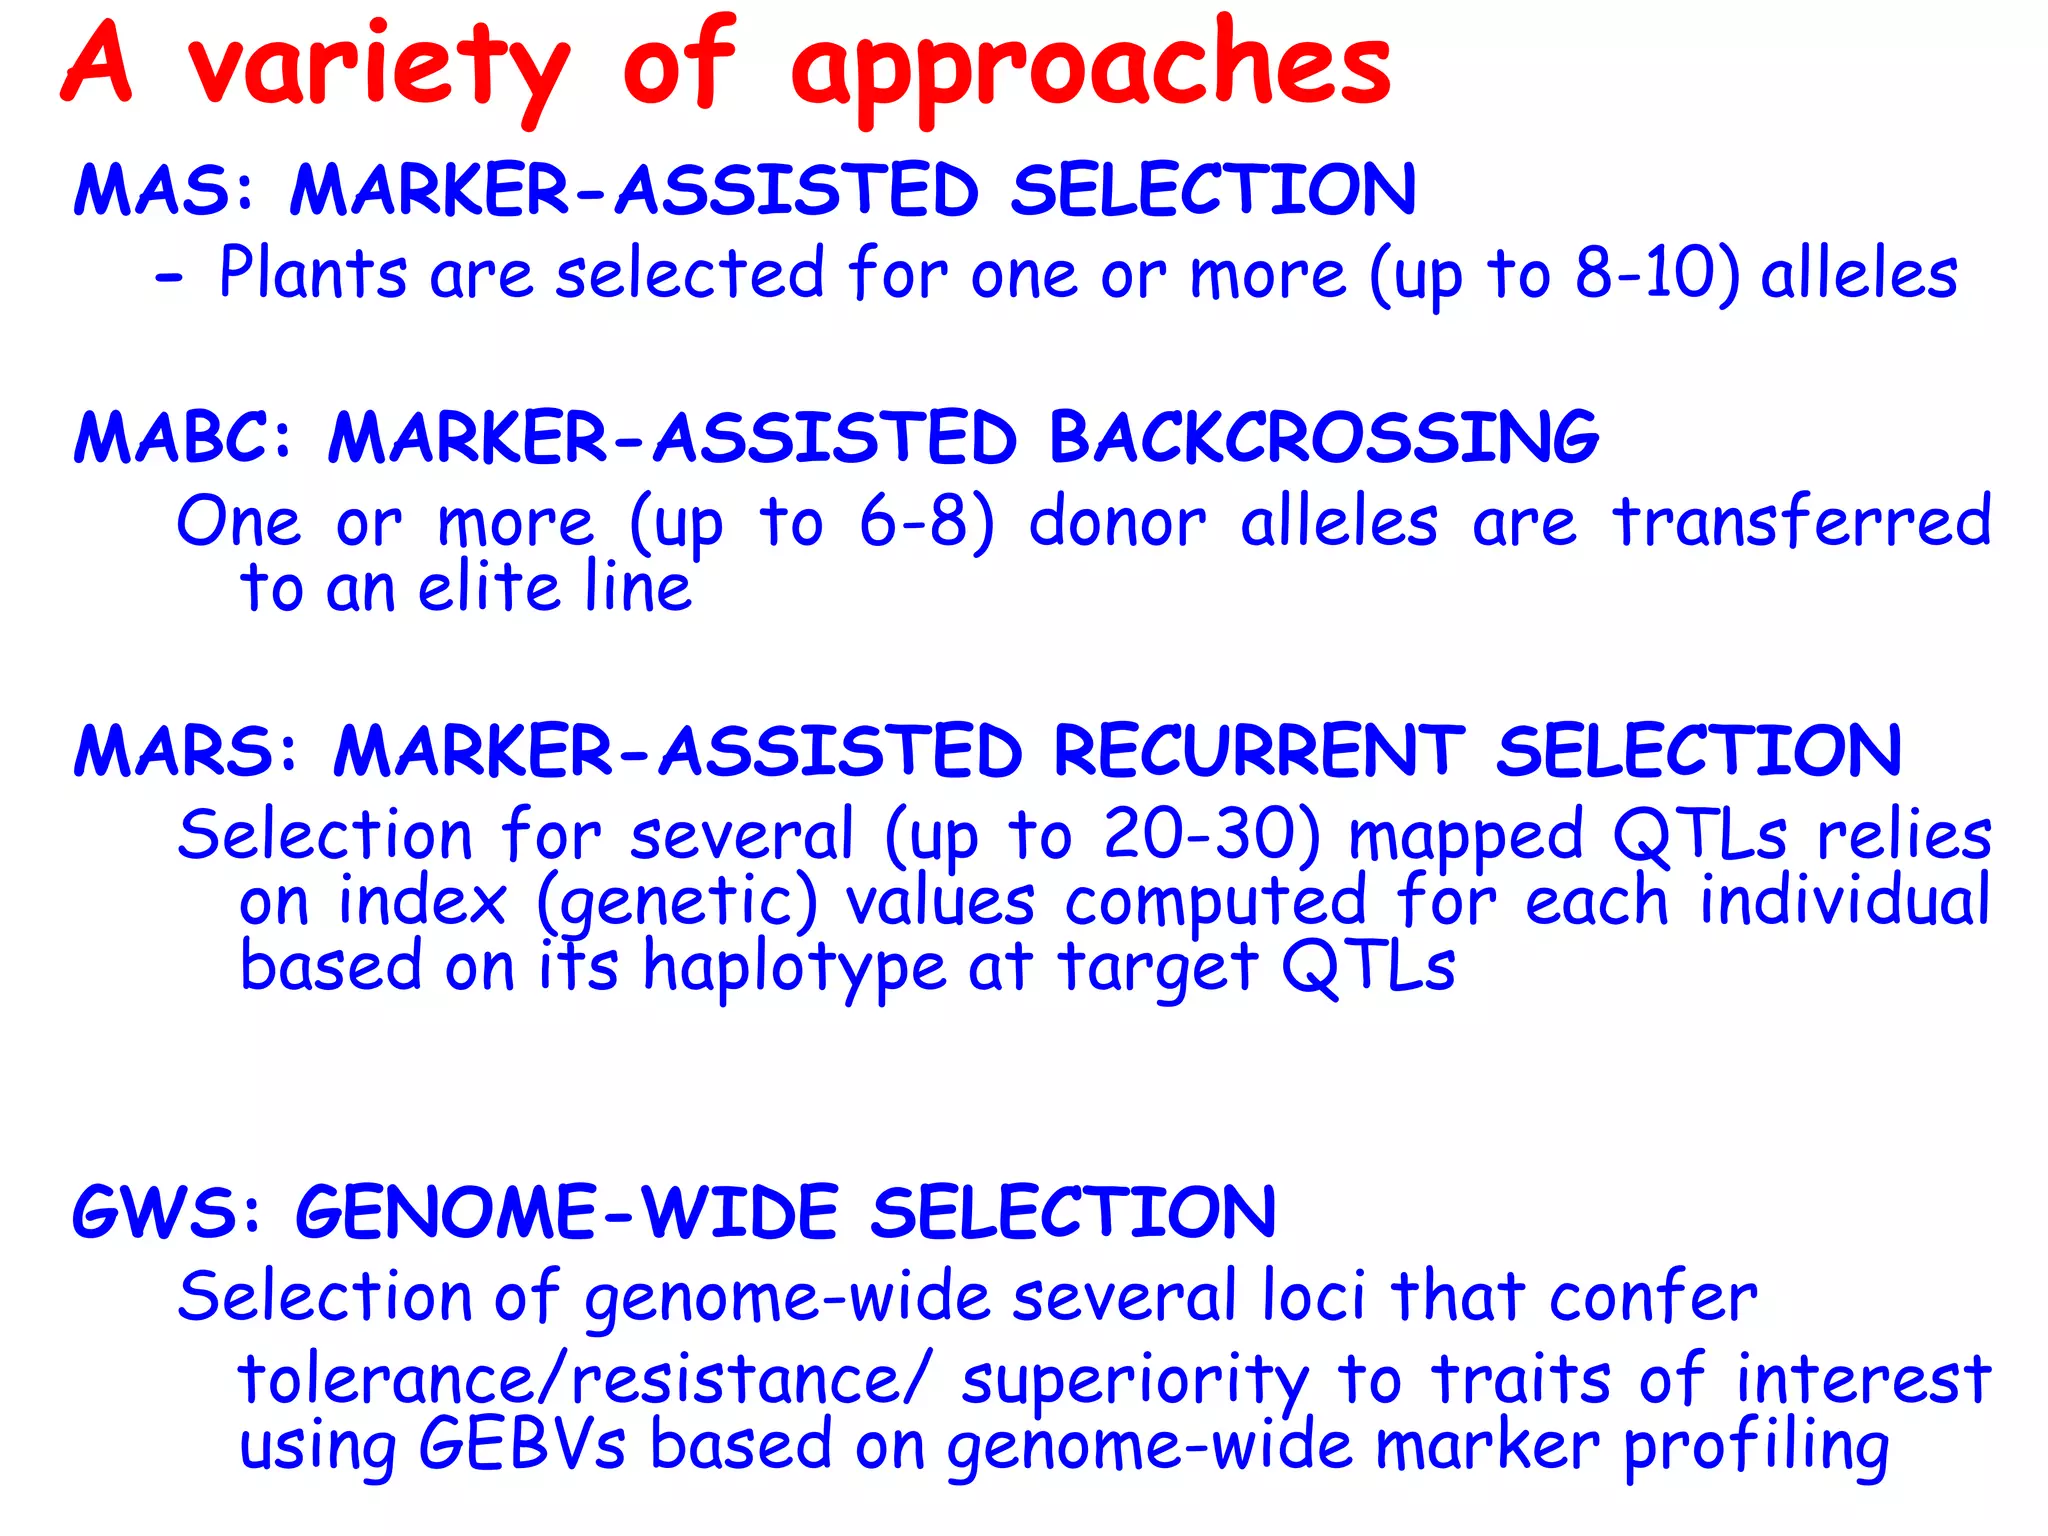


Marker-assisted selection (MAS) is a plant breeding method that uses DNA markers to select for desirable traits. It allows breeders to select plants earlier in development compared to phenotypic selection. MAS has advantages like being unaffected by environment and ability to select for recessive traits, but may be more expensive initially than conventional methods. Careful analysis of costs and benefits is needed to determine if MAS is advantageous for a particular program over traditional breeding. MAS requires tightly linked markers, knowledge of marker-trait associations, and data management to be effective. A variety of MAS approaches exist like backcrossing, pyramiding, and combined MAS and phenotypic selection.