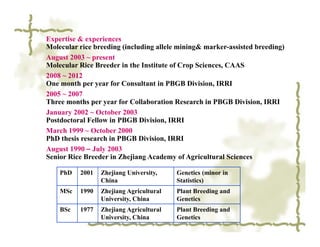
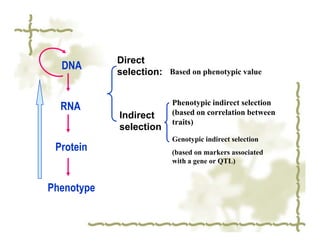
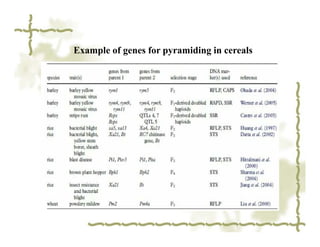
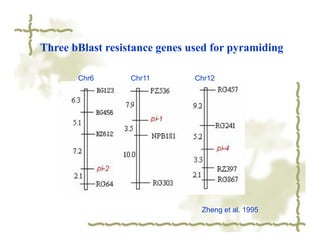
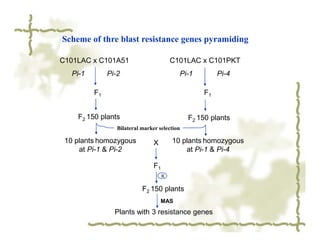
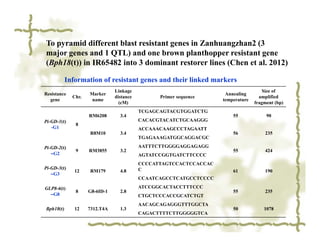
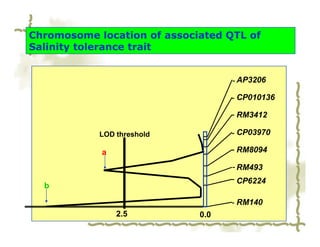
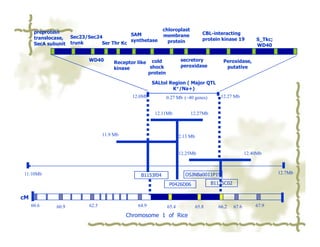
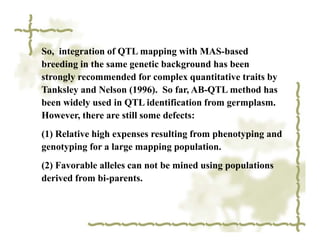
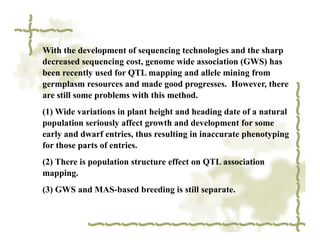
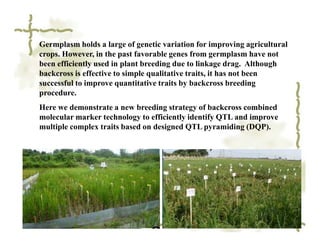
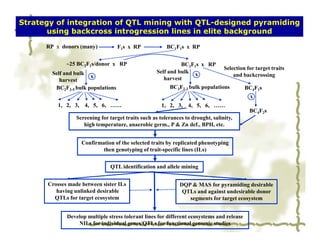
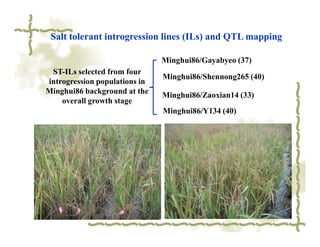
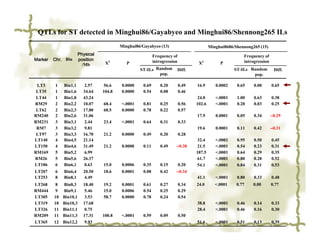
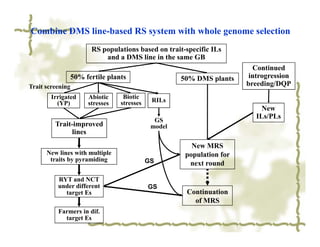
1. The document discusses molecular marker-assisted breeding in rice. It provides details on the expertise and experiences of Dr. Jian-Long Xu in molecular rice breeding including allele mining and marker-assisted selection.
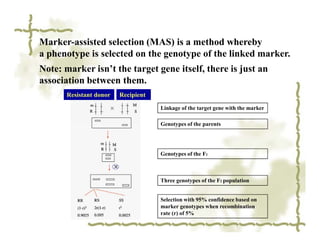
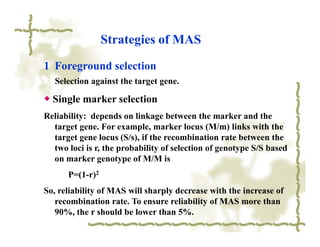
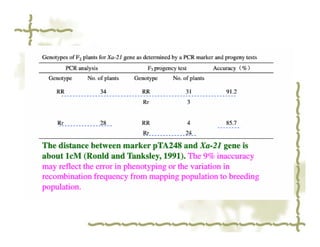
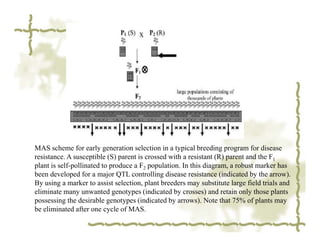
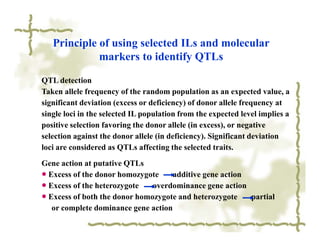
2. Marker-assisted selection is described as a method to select phenotypes based on the genotype of linked markers rather than the target gene itself. The advantages of MAS include time and cost savings compared to traditional field trials.
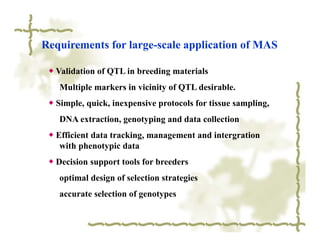
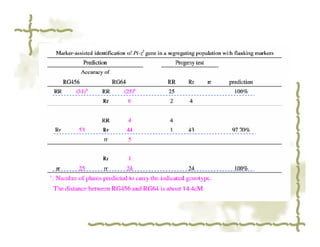
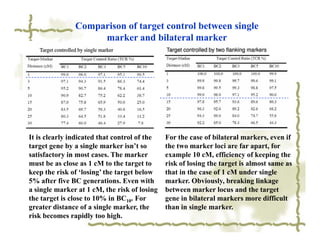
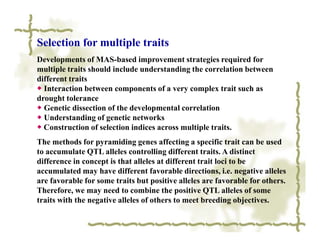
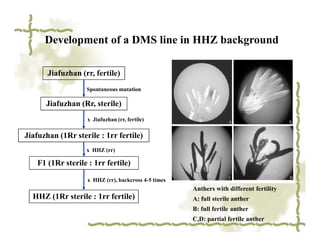
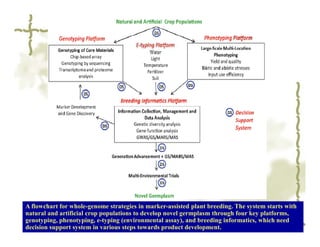
3. Requirements for large-scale application of MAS include validation of QTL in breeding materials, efficient genotyping protocols, and decision support tools for breeders.
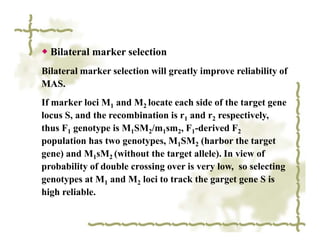
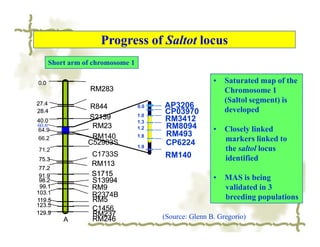
Multiple inbred founder lines are inter-mated for several generations prior to creating inbred lines, resulting in a diverse population whose genomes are fine scale mosaics of contributions from all founders.
Introduction:
Proposed by Meuwissen et al. (2001)
GS is a specialized form of MAS, in which information from genotype data on marker alleles covering the entire genome forms the basis of selection.
The effects associated with all the marker loci, irrespective of whether the effects are significant or not, covering the entire genome are estimated.
The marker effect estimates are used to calculate the genomic estimated breeding values (GEBVs) of different individuals/lines, which form the basis of selection.
Why to go for genomic selection:
Marker-assisted selection (MAS) is well-suited for handling oligogenes and quantitative trait loci (QTLs) with large effects but not for minor QTLs.
MARS attempts to take into account small effect QTLs by combining trait phenotype data with marker genotype data into a combined selection index.
Based on markers showing significant association with the trait(s) and for this reason has been criticized as inefficient
The genomic selection (GS) scheme was to rectify the deficiency of MAS and MARS schemes. The GS scheme utilizes information from genome-wide marker data whether or not their associations with the concerned trait(s) are significant.
GEBV: GenomicEstimated Breeding Values-
The sum total of effects associated with all the marker alleles present in the individual and included in the GS model applied to the population under selection
Calculated on a single individual basis
Gene-assisted genomic selection:
A GS model that uses information about prior known QTLs, the targeted QTLs were accumulated in much higher frequencies than when the standard ridge regression was used
The sum total of effects associated with all the marker alleles present in the individual and included in the GS model applied to the population under selection
Calculated on a single individual basis
Population used:
Training population: used for training of the GS model and for obtaining estimates of the marker-associated effects needed for estimation of GEBVs of individuals/lines in the breeding population.
Breeding population: the population subjected to GS for achieving the desired improvement and isolation of superior lines for use as new varieties/parents of new improved hybrids.
Training population-
large enough: must be representative of the breeding population: max. trait variance with marker : by cluster analysis
should have either equal or comparable LD, LD decay rates with breeding populations
Updated by including individuals/lines from the breeding population
Training more than one generation
Low colinearity between markers is needed since high colinearity tends to reduce prediction accuracy of certain GS models. (colinearity disturbed by recombination)
Linkage and QTL mapping Populations and Association mapping population.
F2, Immortalized F2, Backcross (BC), Near isogenic lines (NIL), RIL, Double haploids(DH), Nested Association mapping (NAM), MAGIC and Interconnected populations.
QTL is a gene or the chromosomal region that affects a quantitative trait, which should be polymorphic (have allelic variation) to have an effect in a population, must be linked to a polymorphic marker allele to be detected. The QTL mapping consists of 4 steps, like the development of mapping population, generation of polymorphic marker data set among the parents, construction of linkage map, and finally the QTL analysis
All the above steps are described in these slides very briefly along with two case studies.
Marker assisted selection( mas) and its application in plant breedingHemantkumar Sonawane
Marker Types,Prerequisites for efficient marker-assisted breeding programmes,Advantages of MAS,Limitations of MAS ,Marker Assisted Breeding Schemes,• 1. Marker- assisted backcrossing,2. Marker- Assisted evaluation of breeding material,3 Gene pyramiding,4. Early generation selection ,Combined approaches,MAB: I level of Selection – FOREGROUND SELECTION,Second level of selection: Recombinant Selection,MAB: III Level of Selection BACKGROUND SELECTION,
The term balanced tertiary trisomic has three words of which (1) “trisomic” indicates the presence of extra chromosome, (2) “tertiary” indicates that the extra chromosome is a trans-located chromosome, and (3) “balanced” refers to the breeding behaviour of the trisomic.
Ramage defined the BTT as a tertiary trisomic constructed in such a way that the dominant allele of a marker gene, closely linked with the translocation breakpoint of the extra chromosome is carried on the extra chromosome, and the recessive allele is carried on the two normal chromosomes that constitute the diploid complement. The dominant marker gene may be located on the centromere segment or the trans-located segment of the extra chromosome.
Marker Assisted Selection in Crop BreedingPawan Chauhan
Marker Assisted Selection is a value addition to conventional methods of Crop Breeding. It has been gaining importance in plant breeding with new generation of plant breeders and to get accurate and fast desired result from plant breeding.
I would like to share this presentation file.
Some basics information regarding to molecular plant breeding, hope this help the beginner who start working in this field.
Thanks for many original source of information (mainly from slideshare.net, IRRI, CIMMYT and any paper received from professor and some over the internet)
A new era of genomics for plant science research has opened due the complete genome sequencing projects of Arabidopsis thaliana and rice. The sequence information available in public database has highlighted the need to develop genome scale reverse genetic strategies for functional analysis (Till et al., 2003). As most of the phenotypes are obscure, the forward genetics can hardly meet the demand of a high throughput and large-scale survey of gene functions. Targeting Induced Local Lesions in Genome TILLING is a general reverse genetic technique that combines chemical mutagenesis with PCR based screening to identity point mutations in regions of interest (McCallum et al., 2000). This strategy works with a mismatch-specific endonuclease to detect induced or natural DNA polymorphisms in genes of interest. A newly developed general reverse genetic strategy helps to locate an allelic series of induced point mutations in genes of interest. It allows the rapid and inexpensive detection of induced point mutations in populations of physically or chemically mutagenized individuals. To create an induced population with the use of physical/chemical mutagens is the first prerequisite for TILLING approach. Most of the plant species are compatible with this technique due to their self-fertilized nature and the seeds produced by these plants can be stored for long periods of time (Borevitz et al., 2003). The seeds are treated with mutagens and raised to harvest M1 plants, which are consequently, self-fertilized to raise the M2 population. DNA extracted from M2 plants is used in mutational screening (Colbert et al., 2001). To avoid mixing of the same mutation only one M2 plant from each M1 is used for DNA extraction (Till et al., 2007). The M3 seeds produce by selfing the M2 progeny can be well preserved for long term storage. Ethyl methane sulfonate (EMS) has been extensively used as a chemical mutagen in TILLING studies in plants to generate mutant populations, although other mutagens can be effective. EMS produces transitional mutations (G/C, A/T) by alkylating G residues which pairs with T instead of the conservative base pairing with C (Nagy et al., 2003). It is a constructive approach for users to attempt a range of chemical mutagens to assess the lethality and sterility on germinal tissue before creating large mutant populations.
Molecular Breeding in Plants is an introduction to the fundamental techniques...UNIVERSITI MALAYSIA SABAH
This slide describe the process of molecular breeding in plants which involves the application of molecular markers for Marker Assisted Selection and Marker Assisted Breeding.
Presentation by Jacob van Etten.
CCAFS workshop titled "Using Climate Scenarios and Analogues for Designing Adaptation Strategies in Agriculture," 19-23 September in Kathmandu, Nepal.
this presentation is about the molecular markers as we all know the molecular markers are the DNA sequences it can be easily detected and its inheritance is easily monitored.so the main basics of the molecular markers is the polymorphic nature so it can used as molecular markers.and this will gives you the idea about AFLP, RFLP, RAPD, SNPS,ETC.
Process whereby a marker is used for indirect selection of a genetic determinant or determinants of a trait of interest (i.e. productivity, disease resistance, abiotic stress tolerance, and/or quality).
Trait of interest is selected not based on the trait itself but on a marker linked to it.
The assumption is that linked allele associates with the gene and/or quantitative trait locus (QTL) of interest. MAS can be useful for traits that are difficult to measure, exhibit low heritability, and/or are expressed late in development.
Pre-Requisites: Two pre-requisites for marker assisted selection are: (i) a tight linkage between molecular marker and gene of interest, and (ii) high heritability of the gene of interest.
Markers Used: The most commonly used molecular markers include amplified fragment length polymorphisms (AFLP), restriction fragment length polymorphisms (RFLP), random amplified polymorphic DNA (RAPD), simple sequence repeats (SSR) or micro satellites, single nucleotide polymorphisms (SNP), etc. The use of molecular markers differs from species to species also.
Marker assisted selection is the breeding strategy in which selection for a gene is based on molecular markers closely linked to the gene of interest rather than the gene itself, and the markers are used to monitor the incorporation of the desirable allele from the donor source. Selection of a genotype carrying desirable gene via linked marker (s) is called Marker Assisted Selection. MAS can be applied to possible to use this kind of information.
The prerequisites for the classical procedure of MAS are the tight linkage between molecular marker and gene of interest and high heritability of the gene of interest. It is noteworthy that the “quality” and the number of markers have a major impact on the success of MAS. The quality of markers relates to their characteristics and to the cost and the efficiency of the genotyping process. The number of markers affects the reliability of the linkage between them and the gene(s). In other words, screening a large number of markers has the potential to identify close and reliable linkage between the marker and the gene of interest. MAS has greater potential for efficient gene pyramiding combining several important genes in one cultivar. MAS is gaining considerable importance as it can improve the efficiency of plant breeding through precise transfer of genomic regions of interest and acceleration of the recovery of the recurrent parent genome. Marker-assisted selection is gaining considerable importance as it would improve the efficiency of plant breeding through precise transfer of genomic regions of interest (foreground selection) and accelerating the recovery of the recurrent parent genome (background selection). The use of MAS in crop improvement will not only reduce the cost of developing new varieties but will also increase the precision and efficiency of selection in the breeding program as well as lessen the number of years required to come up with a new crop variety.
Introduction
Backcross breeding & its types
Marker assisted breeding
Marker assisted backcross breeding (MABC)
Main strategies
Advantages over conventional breeding
Case studies
Future outlook
Conclusion
UiPath Test Automation using UiPath Test Suite series, part 4DianaGray10
Welcome to UiPath Test Automation using UiPath Test Suite series part 4. In this session, we will cover Test Manager overview along with SAP heatmap.
The UiPath Test Manager overview with SAP heatmap webinar offers a concise yet comprehensive exploration of the role of a Test Manager within SAP environments, coupled with the utilization of heatmaps for effective testing strategies.
Participants will gain insights into the responsibilities, challenges, and best practices associated with test management in SAP projects. Additionally, the webinar delves into the significance of heatmaps as a visual aid for identifying testing priorities, areas of risk, and resource allocation within SAP landscapes. Through this session, attendees can expect to enhance their understanding of test management principles while learning practical approaches to optimize testing processes in SAP environments using heatmap visualization techniques
What will you get from this session?
1. Insights into SAP testing best practices
2. Heatmap utilization for testing
3. Optimization of testing processes
4. Demo
Topics covered:
Execution from the test manager
Orchestrator execution result
Defect reporting
SAP heatmap example with demo
Speaker:
Deepak Rai, Automation Practice Lead, Boundaryless Group and UiPath MVP
Le nuove frontiere dell'AI nell'RPA con UiPath Autopilot™UiPathCommunity
In questo evento online gratuito, organizzato dalla Community Italiana di UiPath, potrai esplorare le nuove funzionalità di Autopilot, il tool che integra l'Intelligenza Artificiale nei processi di sviluppo e utilizzo delle Automazioni.
📕 Vedremo insieme alcuni esempi dell'utilizzo di Autopilot in diversi tool della Suite UiPath:
Autopilot per Studio Web
Autopilot per Studio
Autopilot per Apps
Clipboard AI
GenAI applicata alla Document Understanding
👨🏫👨💻 Speakers:
Stefano Negro, UiPath MVPx3, RPA Tech Lead @ BSP Consultant
Flavio Martinelli, UiPath MVP 2023, Technical Account Manager @UiPath
Andrei Tasca, RPA Solutions Team Lead @NTT Data
Accelerate your Kubernetes clusters with Varnish CachingThijs Feryn
A presentation about the usage and availability of Varnish on Kubernetes. This talk explores the capabilities of Varnish caching and shows how to use the Varnish Helm chart to deploy it to Kubernetes.
This presentation was delivered at K8SUG Singapore. See https://feryn.eu/presentations/accelerate-your-kubernetes-clusters-with-varnish-caching-k8sug-singapore-28-2024 for more details.
Welocme to ViralQR, your best QR code generator.ViralQR
Welcome to ViralQR, your best QR code generator available on the market!
At ViralQR, we design static and dynamic QR codes. Our mission is to make business operations easier and customer engagement more powerful through the use of QR technology. Be it a small-scale business or a huge enterprise, our easy-to-use platform provides multiple choices that can be tailored according to your company's branding and marketing strategies.
Our Vision
We are here to make the process of creating QR codes easy and smooth, thus enhancing customer interaction and making business more fluid. We very strongly believe in the ability of QR codes to change the world for businesses in their interaction with customers and are set on making that technology accessible and usable far and wide.
Our Achievements
Ever since its inception, we have successfully served many clients by offering QR codes in their marketing, service delivery, and collection of feedback across various industries. Our platform has been recognized for its ease of use and amazing features, which helped a business to make QR codes.
Our Services
At ViralQR, here is a comprehensive suite of services that caters to your very needs:
Static QR Codes: Create free static QR codes. These QR codes are able to store significant information such as URLs, vCards, plain text, emails and SMS, Wi-Fi credentials, and Bitcoin addresses.
Dynamic QR codes: These also have all the advanced features but are subscription-based. They can directly link to PDF files, images, micro-landing pages, social accounts, review forms, business pages, and applications. In addition, they can be branded with CTAs, frames, patterns, colors, and logos to enhance your branding.
Pricing and Packages
Additionally, there is a 14-day free offer to ViralQR, which is an exceptional opportunity for new users to take a feel of this platform. One can easily subscribe from there and experience the full dynamic of using QR codes. The subscription plans are not only meant for business; they are priced very flexibly so that literally every business could afford to benefit from our service.
Why choose us?
ViralQR will provide services for marketing, advertising, catering, retail, and the like. The QR codes can be posted on fliers, packaging, merchandise, and banners, as well as to substitute for cash and cards in a restaurant or coffee shop. With QR codes integrated into your business, improve customer engagement and streamline operations.
Comprehensive Analytics
Subscribers of ViralQR receive detailed analytics and tracking tools in light of having a view of the core values of QR code performance. Our analytics dashboard shows aggregate views and unique views, as well as detailed information about each impression, including time, device, browser, and estimated location by city and country.
So, thank you for choosing ViralQR; we have an offer of nothing but the best in terms of QR code services to meet business diversity!
Observability Concepts EVERY Developer Should Know -- DeveloperWeek Europe.pdfPaige Cruz
Monitoring and observability aren’t traditionally found in software curriculums and many of us cobble this knowledge together from whatever vendor or ecosystem we were first introduced to and whatever is a part of your current company’s observability stack.
While the dev and ops silo continues to crumble….many organizations still relegate monitoring & observability as the purview of ops, infra and SRE teams. This is a mistake - achieving a highly observable system requires collaboration up and down the stack.
I, a former op, would like to extend an invitation to all application developers to join the observability party will share these foundational concepts to build on:
Smart TV Buyer Insights Survey 2024 by 91mobiles.pdf91mobiles
91mobiles recently conducted a Smart TV Buyer Insights Survey in which we asked over 3,000 respondents about the TV they own, aspects they look at on a new TV, and their TV buying preferences.
State of ICS and IoT Cyber Threat Landscape Report 2024 previewPrayukth K V
The IoT and OT threat landscape report has been prepared by the Threat Research Team at Sectrio using data from Sectrio, cyber threat intelligence farming facilities spread across over 85 cities around the world. In addition, Sectrio also runs AI-based advanced threat and payload engagement facilities that serve as sinks to attract and engage sophisticated threat actors, and newer malware including new variants and latent threats that are at an earlier stage of development.
The latest edition of the OT/ICS and IoT security Threat Landscape Report 2024 also covers:
State of global ICS asset and network exposure
Sectoral targets and attacks as well as the cost of ransom
Global APT activity, AI usage, actor and tactic profiles, and implications
Rise in volumes of AI-powered cyberattacks
Major cyber events in 2024
Malware and malicious payload trends
Cyberattack types and targets
Vulnerability exploit attempts on CVEs
Attacks on counties – USA
Expansion of bot farms – how, where, and why
In-depth analysis of the cyber threat landscape across North America, South America, Europe, APAC, and the Middle East
Why are attacks on smart factories rising?
Cyber risk predictions
Axis of attacks – Europe
Systemic attacks in the Middle East
Download the full report from here:
https://sectrio.com/resources/ot-threat-landscape-reports/sectrio-releases-ot-ics-and-iot-security-threat-landscape-report-2024/
LF Energy Webinar: Electrical Grid Modelling and Simulation Through PowSyBl -...DanBrown980551
Do you want to learn how to model and simulate an electrical network from scratch in under an hour?
Then welcome to this PowSyBl workshop, hosted by Rte, the French Transmission System Operator (TSO)!
During the webinar, you will discover the PowSyBl ecosystem as well as handle and study an electrical network through an interactive Python notebook.
PowSyBl is an open source project hosted by LF Energy, which offers a comprehensive set of features for electrical grid modelling and simulation. Among other advanced features, PowSyBl provides:
- A fully editable and extendable library for grid component modelling;
- Visualization tools to display your network;
- Grid simulation tools, such as power flows, security analyses (with or without remedial actions) and sensitivity analyses;
The framework is mostly written in Java, with a Python binding so that Python developers can access PowSyBl functionalities as well.
What you will learn during the webinar:
- For beginners: discover PowSyBl's functionalities through a quick general presentation and the notebook, without needing any expert coding skills;
- For advanced developers: master the skills to efficiently apply PowSyBl functionalities to your real-world scenarios.
Generative AI Deep Dive: Advancing from Proof of Concept to ProductionAggregage
Join Maher Hanafi, VP of Engineering at Betterworks, in this new session where he'll share a practical framework to transform Gen AI prototypes into impactful products! He'll delve into the complexities of data collection and management, model selection and optimization, and ensuring security, scalability, and responsible use.
GraphRAG is All You need? LLM & Knowledge GraphGuy Korland
Guy Korland, CEO and Co-founder of FalkorDB, will review two articles on the integration of language models with knowledge graphs.
1. Unifying Large Language Models and Knowledge Graphs: A Roadmap.
https://arxiv.org/abs/2306.08302
2. Microsoft Research's GraphRAG paper and a review paper on various uses of knowledge graphs:
https://www.microsoft.com/en-us/research/blog/graphrag-unlocking-llm-discovery-on-narrative-private-data/
A tale of scale & speed: How the US Navy is enabling software delivery from l...sonjaschweigert1
Rapid and secure feature delivery is a goal across every application team and every branch of the DoD. The Navy’s DevSecOps platform, Party Barge, has achieved:
- Reduction in onboarding time from 5 weeks to 1 day
- Improved developer experience and productivity through actionable findings and reduction of false positives
- Maintenance of superior security standards and inherent policy enforcement with Authorization to Operate (ATO)
Development teams can ship efficiently and ensure applications are cyber ready for Navy Authorizing Officials (AOs). In this webinar, Sigma Defense and Anchore will give attendees a look behind the scenes and demo secure pipeline automation and security artifacts that speed up application ATO and time to production.
We will cover:
- How to remove silos in DevSecOps
- How to build efficient development pipeline roles and component templates
- How to deliver security artifacts that matter for ATO’s (SBOMs, vulnerability reports, and policy evidence)
- How to streamline operations with automated policy checks on container images
UiPath Test Automation using UiPath Test Suite series, part 3DianaGray10
Welcome to UiPath Test Automation using UiPath Test Suite series part 3. In this session, we will cover desktop automation along with UI automation.
Topics covered:
UI automation Introduction,
UI automation Sample
Desktop automation flow
Pradeep Chinnala, Senior Consultant Automation Developer @WonderBotz and UiPath MVP
Deepak Rai, Automation Practice Lead, Boundaryless Group and UiPath MVP
UiPath Test Automation using UiPath Test Suite series, part 3
Molecular Marker-assisted Breeding in Rice
1. Molecular Marker-assisted
Breeding in Rice
Jian-Long Xu
Institute of Crop Sciences, CAAS
Email: xujlcaas@yahoo.com.cn
2. Expertise & experiences
Molecular rice breeding (including allele mining& marker-assisted breeding)
August 2003 ~ present
Molecular Rice Breeder in the Institute of Crop Sciences, CAAS
2008 ~ 2012
One month per year for Consultant in PBGB Division, IRRI
2005 ~ 2007
Three months per year for Collaboration Research in PBGB Division, IRRI
January 2002 ~ October 2003
Postdoctoral Fellow in PBGB Division, IRRI
March 1999 ~ October 2000
PhD thesis research in PBGB Division, IRRI
August 1990 – July 2003
Senior Rice Breeder in Zhejiang Academy of Agricultural Sciences
PhD 2001 Zhejiang University, Genetics (minor in
China Statistics)
MSc 1990 Zhejiang Agricultural Plant Breeding and
University, China Genetics
BSc 1977 Zhejiang Agricultural Plant Breeding and
University, China Genetics
3. Successful breeding depends on:
(1)Variation: Sufficient (novel) genetic variation for
target traits in breeding populations
(2) Selection efficiency: Effective selection approach
to identify desirable alleles or allelic combinations for
the target traits in breeding populations
Traditional breeding depends on phenotypic selections.
Efficiency of selection is largely influenced by environment,
gene interaction, and gene by environment interaction.
Genetic markers can improve efficiency of selection. Genetic
markers include morphological marker (plant height, leaf
color), cytological marker (chr structure and no mutant),
biochemical marker (isozyme), and molecular marker (SSR).
4. Direct
DNA
selection: Based on phenotypic value
Phenotypic indirect selection
RNA (based on correlation between
Indirect
traits)
selection
Genotypic indirect selection
Protein (based on markers associated
with a gene or QTL)
Phenotype
5. Marker-assisted selection (MAS) is a method whereby
a phenotype is selected on the genotype of the linked marker.
Note: marker isn’t the target gene itself, there is just an
association between them.
Resistant donor Recipient
Linkage of the target gene with the marker
Genotypes of the parents
Genotypes of the F1
Three genotypes of the F2 population
Selection with 95% confidence based on
marker genotypes when recombination
rate (r) of 5%
6. The advantages of MAS:
(1) Time saving from the substitution of complex field trials (that need
to be conducted at particular times of year or at specific locations,
or are technically complicated) with molecular tests;
(2) Elimination of unreliable phenotypic evaluation associated with
field trials due to environmental effects;
(3) Selection of genotypes at seedling stage;
(4) Gene ‘pyramiding’ or combining multiple genes simultaneously;
(5) Avoid the transfer of undesirable or deleterious genes (‘linkage
drag’; this is of particular relevance when the introgression of
genes from wild species is involved);
(6) Selecting for traits with low heritability;
(7) Testing for specific traits where phenotypic evaluation is not
feasible (e.g. quarantine restrictions may prevent exotic pathogens
to be used for screening).
7. Procedure of MAS
Considering mapping and
Population development breeding purposes
Gene or QTL mapping
Linkage map construction/ phenotypic
evaluation for traits/ QTL analysis
QTL validation
Confirmation of position and effect of QTL/
verification of QTL in different populations and
genetic backgrounds / fine-mapping
Marker validation
Testing of marker in important
breeding parents
Marker-assisted selection
8. Requirements for large-scale application of MAS
◆ Validation of QTL in breeding materials
Multiple markers in vicinity of QTL desirable.
◆ Simple, quick, inexpensive protocols for tissue sampling,
DNA extraction, genotyping and data collection
◆ Efficient data tracking, management and intergration
with phenotypic data
◆ Decision support tools for breeders
optimal design of selection strategies
accurate selection of genotypes
9. Strategies of MAS
1 Foreground selection
Selection against the target gene.
◆ Single marker selection
Reliability: depends on linkage between the marker and the
target gene. For example, marker locus (M/m) links with the
target gene locus (S/s), if the recombination rate between the
two loci is r, the probability of selection of genotype S/S based
on marker genotype of M/M is
P=(1-r)2
So, reliability of MAS will sharply decrease with the increase of
recombination rate. To ensure reliability of MAS more than
90%, the r should be lower than 5%.
10.
11. If the probability to select 1 target plant is P, the minimum
number of plants with marker genotype M/M will be
calculated as:
N=log(1-P)2/log(1-r)2
So, when the recombination rate (r) is high as 30%,
selection of 7 plants with M/M genotype will ensure to
obtain 1 target plant with probability of 99%, whereas we
must select 16 plants if MAS isn’t applied (namely, there is
no linkage between the marker and the target gene).
12. MAS scheme for early generation selection in a typical breeding program for disease
resistance. A susceptible (S) parent is crossed with a resistant (R) parent and the F1
plant is self-pollinated to produce a F2 population. In this diagram, a robust marker has
been developed for a major QTL controlling disease resistance (indicated by the arrow).
By using a marker to assist selection, plant breeders may substitute large field trials and
eliminate many unwanted genotypes (indicated by crosses) and retain only those plants
possessing the desirable genotypes (indicated by arrows). Note that 75% of plants may
be eliminated after one cycle of MAS.
13. ◆ Bilateral marker selection
Bilateral marker selection will greatly improve reliability of
MAS.
If marker loci M1 and M2 locate each side of the target gene
locus S, and the recombination is r1 and r2 respectively,
thus F1 genotype is M1SM2/m1sm2, F1-derived F2
population has two genotypes, M1SM2 (harbor the target
gene) and M1sM2 (without the target allele). In view of
probability of double crossing over is very low, so selecting
genotypes at M1 and M2 loci to track the garget gene S is
high reliable.
14. Without interrupt, the probability to obtain genotype S/S
by selection of bilateral marker genotypes M1M2/M1M2 is:
P=(1-r1)2 (1-r2)2/[(1-r1)2 (1-r2)2 + r1r2]
◆ When r1=r2 (the target gene is located in the middle of
the two marker loci), P will be minimum.
◆ In fact, two single crossing over generally interrupt
each other, thus resulting in even small probability of
double crossing over, so reliability of bilateral marker
selection is higher than expected.
15.
16. Comparison of target control between single
marker and bilateral marker
It is clearly indicated that control of the For the case of bilateral markers, even if
target gene by a single marker isn’t so the two marker loci are far apart, for
satisfactory in most cases. The marker example 10 cM, efficiency of keeping the
must be as close as 1 cM to the target to risk of losing the target is almost same as
keep the risk of ‘losing’ the target below that in the case of 1 cM under single
5% after five BC generations. Even with marker. Obviously, breaking linkage
a single marker at 1 cM, the risk of losing between marker locus and the target
the target is close to 10% in BC10. For gene in bilateral markers more difficult
greater distance of a single marker, the than in single marker.
risk becomes rapidly too high.
17. 2 Background selection
Besides selection of the target gene (foreground selection), background
selection will be implemented if to keep original characters of a variety.
◆ MAS method: use a set of markers, which are evenly selected from
the whole genome to identify the genotype of the recurrent parent.
Normally screening background will be focused on those plants with
target gene.
◆ Consecutive backcrossing: backcrossing progeny will soon recover its
recurrent parental genome after several rounds of backcrossing.
% of the recurrent parental genome
Breeding method BC1F1 BC2F1 BC3F1 BC6F1
Traditional backcrossing 75 87.7 93.3 99
MAS-based backcrossing 85.5 98 100
Young & Tanksley 1989
18. Comparison of MAS and traditional BC breeding for
recovery of genetic background of the recurrent parent
Traditional
BC breeding
Year
MAS BC
breeding
Black bar represents donor
Year
genome
Only two BC generations, the target segment can be narrowed
down into 2 cM by MAS and completely diminish linkage drag
from donor parent.
19. MAS application in qualitative traits
In most cases, it is unnecessary to apply MAS for
qualitative traits. However, MAS does improve efficiency
of selection of qualitative traits in following cases:
◆ Pyramiding different resistance genes;
◆Difficulty in or high cost of phenotyping;
◆ Hope to select in early growing stage but the traits
normally express in late developing stages
◆ Screening genetic background besides the target
traits
20. 1 Pyramiding of multiple genes
Pyramid different genes dispersed in various varieties into
one variety by MAS.
Different genes for the same target trait: to improve
trait value.
Multiple genes underlying different traits into the
same variety: ensure new variety having more
favorable traits
23. Scheme of thre blast resistance genes pyramiding
C101LAC x C101A51 C101LAC x C101PKT
Pi-1 Pi-2 Pi-1 Pi-4
F1 F1
F2 150 plants F2 150 plants
Bilateral marker selection
10 plants homozygous X 10 plants homozygous
at Pi-1 & Pi-2 at Pi-1 & Pi-4
F1
X
F2 150 plants
MAS
Plants with 3 resistance genes
24. To pyramid different blast resistant genes in Zanhuangzhan2 (3
major genes and 1 QTL) and one brown planthopper resistant gene
(Bph18(t)) in IR65482 into 3 dominant restorer lines (Chen et al. 2012)
Information of resistant genes and their linked markers
Linkage Size of
Resistance Marker Annealing
Chr. distance Primer sequence amplified
gene name temperature
(cM) fragment (bp)
TCGAGCAGTACGTGGATCTG
RM6208 3.4 55 90
Pi-GD-1(t) CACACGTACATCTGCAAGGG
8
-G1 ACCAAACAAGCCCTAGAATT
R8M10 3.4 56 235
TGAGAAAGATGGCAGGACGC
Pi-GD-2(t) AATTTCTTGGGGAGGAGAGG
9 RM3855 3.2 55 424
–G2 AGTATCCGGTGATCTTCCCC
CCCCATTAGTCCACTCCACCAC
Pi-GD-3(t) C
12 RM179 4.8 61 190
–G3
CCAATCAGCCTCATGCCTCCCC
GLP8-6(t) ATCCGGCACTACCTTTCCC
8 G8-6ID-1 2.8 55 235
–G8 CTGCTCCCACCGCATCTGT
AACAGCAGAGGGTTTGGCTA
Bph18(t) 12 7312.T4A 1.3 50 1078
CAGACTTTTCTTGGGGGTCA
25. Minghui86, Shuhui527 and x 、
Sanhuangzhan 2、IR65482
Zhehui7954 (Recurrent parent, RP) (Donor parent, DP)
F1
RP Pyramiding
BC1F1 Pyramiding F1
RP MAS MAS
BC2F1 F2
RP MAS MAS
BC3F1 F3
MAS MAS
BC3F2 F4
MAS MAS
BC3F3 F5
Test-crosses with II-32A and Huhan11A
Evaluation on resistance and agronomic traits for restorer
lines and their derived hybrids
Scheme of molecular improvement of blast and brown
planthopper resistance for restorer lines
26. Evaluation of resistance of newly bred restorer lines to Pyricularia grisea Sacc.
Strain Reaction
Resistance
Restorer lines S S S S S S S S S S S S S S S S S S S S frequency
S R (%)
1 2 3 4 5 6 7 8 9 10 11 12 13 14 15 16 17 18 19 20
CO39 S S S S S S S S S S S S S R R S S S S S 18 2 10
Sanhuangzhan2 R S R R R R R R R S R R R R R R R R R R 2 18 90
Minghui86 R R R R R R R R R S R R R R R R S R R R 2 18 90
Shuhui527 R S R R R S R R R R R S R R R R R R R R 3 17 85
Zhehui7954 R S S S S S S S S S R S S R R R S S R R 13 7 35
Minghui86-G2 R R R R R R R R R S R R R R R R R R R R 1 19 95
Minghui86-G1-G2 R R R R R R R R R S R R R R R R S R R R 2 18 90
Shuhui527-G2 R R R R R S R R R R R R R R R R R R R R 1 19 95
Shuhui527-G1-G2 R R R R R S R R R R R R R R R R R R R R 1 19 95
Zhehui7954-G1-G2 R S R R R R R R R S R R R R R S R R R R 3 17 85
Zhehui7954-G1-G2-G8 S R R R R R R R R S R R R R R R R R R R 2 18 90
Zhehui7954-G1 -G8-
R S S S R S R S S R R R S R R R S S R R 9 11 55
Bph18(t)
Zheshu-G2-G8 R S R R R R R R R S R R R R R R R R R R 2 18 90
Mingzhe-G2-G8 R S S R R R R R R S R R R R R R R R R S 4 16 80
Mingzhe-G1-G2-G8 R R R R R R R R R S R R R R R R R R R R 1 19 95
Mingzhe-G1-G2-Bph18(t) S R R R R R S S R R R S R S S R R R R R 6 14 70
29. Some important issues about MAS improvement of
resistance for restorer lines
(1) Firstly, the resistance improvement of parental lines of hybrids is
much different from that of conventional varieties. In the backcross
progenies of restorer parental lines, selections were performed not
only for similarity to the recurrent parents (RP), but also for their
fertility restoring gene(s) and specific combining ability to the CMS
lines.
◆ background recovery of the RP
◆ the qualitatively inherited fertility restoring gene(s) of the RP
◆ the quantitatively inherited specific combining ability. It is gradually
recovered through backcrossing in different individuals to a varying
extent.
It was indicated that a minimum of three backcrosses in conjunction
with stringent phenotypic selection for the RP in each BC progenies
and combining ability testing on a relatively large scale, guarantees
the recovery of recurrent parental characteristics even without MAS
against the background of the RP
30. (2) Secondly, the level of hybrid rice resistance is determined by the
restorer line when CMS is susceptible, whereas the resistance level of
F1 is controlled by the interaction between CMS and restorer line
when CMS is resistant. Expression of many resistance genes such as
Xa21, etc., are affected by genetic background. So resistance of
hybrids derived from the resistant restorer lines probably compromise
and show resistance inferior to our expected. So we should choose
highly resistance genes for resistance improvement of hybrid rice.
(3) Backcrossing is a very efficient strategy to improve single trait.
However, the newly released lines are phenotypically identical to the
RP, i.e. there is no break through in traits of the new variety. So
composite intercrossing is recommended to pyramid multiple
resistance genes as well as to create new variety. In MAS breeding
programs, polymorphic markers are the key problem when multiple
parents are involved. So it is better to develop linked markers showing
polymorphism among all parents, otherwise efficiency of MAS will be
degraded.
31. MAS for quantitative genes
Most important agronomic traits are genetically quantitative
and controlled by polygenes. In the past decades, some major
QTLs have been implemented by MAS.
Procedures MAS for quantitative traits:
◆ QTL initial mapping
◆ Fine-mapping of major QTL
◆ Verification of gene effect using NILs
◆ Validation of molecular markers
◆ MAS application
32. Progress of Saltot locus
Short arm of chromosome 1
0.0 • Saturated map of the
RM283 Chromosome 1
27.4
(Saltol segment) is
R844 0.0 AP3206
28.4 CP03970 developed
S2139 1.0
40.0 1.3 RM3412
60.6 RM23 RM8094
64.9 1.2 • Closely linked
RM140 1.8 RM493
66.2
C52903S CP6224 markers linked to
1.9
71.2 the saltol locus
C1733S RM140
75.3 identified
RM113
77.2
S1715
91.9
98.2 S13994 • MAS is being
99.1 RM9 validated in 3
103.1 R2374B
119.5 RM5 breeding populations
123.5
C1456
129.9 RM237
A RM246 (Source: Glenn B. Gregorio)
33. Chromosome location of associated QTL of
Salinity tolerance trait
AP3206
CP010136
RM3412
LOD threshold CP03970
a RM8094
RM493
CP6224
b
RM140
2.5 0.0
34. preprotein chloroplast
SAM membrane CBL-interacting
translocase, Sec23/Sec24 protein kinase 19 S_Tkc;
synthetase protein
SecA subunit trunk Ser Thr Kc WD40
WD40 secretory
Receptor like cold Peroxidase,
shock peroxidase putative
kinase
protein
SALtol Region ( Major QTL
K+/Na+)
12.0Mb 0.27 Mb (~40 genes) 12.27 Mb
12.11Mb 12.27Mb
11.9 Mb 12.13 Mb
12.25Mb 12.40Mb
11.10Mb OSJNBa0011P19 12.7Mb
B1153f04
P0426D06 B1135C02
cM
60.6 60.9 62.5 64.9 65.4 65.8 66.2 67.6 67.9
Chromosome 1 of Rice
38. A major QTL on chrom. 9 for
submergence tolerance – Sub1 QTL
LOD score
0 10 20 30 40
OPQ1600 OPN4
IR40931-26 PI543851 1200
20 OPAB16
850
C1232
Sub-1(t)
RZ698
15 OPS14 900
RG553
R1016 50cM
RZ206
10 OPH7
950
RZ422
5
100cM
C985
0
1 2 3 4 5 6 7 8 9
Submergence tolerance score
RG570
150cM
Segregation in an F3 population RG451
RZ404
Xu and Mackill (1996) Mol Breed 2: 219
39. Sub1 locus, there are three structurally related genes Sub1A,
Sub1B, and Sub1C present in the same QTL region, encoding
ethylene-responsive factor (ERF) genes.
Fukao, et al., Annals of Botany, 2009,103: 143–150
40. Development of the submergence-tolerant Swarna-Sub1 with details of markers
used for foreground, recombinant, and background selection.
41.
42. Field plot test of submergence tolerance of Sub1 and non-Sub1 varieties. The SUB1 locus from
FR13A was introduced into the rice varieties IR64 and Samba Mahsuri by marker-assisted
backcrossing and into IR49830-7-1-2-2 through conventional breeding. A field trial performed
at IRRI in 2007 included Sub1 lines, the progenitors, and IR49830-7-1-2-2 (tolerant, used as
SUB1 donor) and IR42 (sensitive) as checks. Fourteen-day-old seedlings were transplanted
into a field with high levees, grown for 14 days and then completely submerged with about 1.25
m of water for 17 days. The field was drained, and the plants were allowed to recover under
non-stress conditions. The photograph shows the performance of the lines about 60 days after
de-submergence.
44. MAS of Minor-effect QTLs
At present, using limited number of markers and small
mapping populations, only few QTLs with relatively large
phenotypic-effect have been identified, which account for a
small portion of QTLs affecting the target traits. Moreover,
QTL epistasis has great effect on selection. So, it is difficult
to implement MAS for minor-QTLs.
Genome selection (GS) will provide a new strategy for
mionr-QTLs (introduced later).
45. Genome-wide selection
Training population: used for genotyping with high throughput
SNP marker and phenotyping in the target environment, setting
up genetic predict model to estimate all possible QTL effects
affecting a trait
Breeding population: used for genotyping and predicting breeding
values for selection
In a training population (both genotypic and phenotypic data available),
fit a large number of markers as random effects in a linear model to
estimate all genetic effects simultaneously for a quantitative trait. The
aim is to capture all of the additive genetic variance due to alleles with
both large and small effects on the trait.
In a breeding population (only genotypic data available), use estimates
of marker effects to predict breeding values and select individuals with
the best GEBVs (genomic estimated breeding values).
46. GS consists of three steps:
(1) Prediction model training and validation
A training population (TP) consisting of germplasm having both
phenotypic and genome-wide marker data is used to estimate
marker effects.
(2) Breeding value prediction of single-crosses
The combination of all marker effect estimates and the marker data of
the single crosses is used to calculate genomic estimated breeding
values (GEBVs).
(3) selection based on these predictions
Selection is then imposed on the single crosses using GEBVs as
selection criterion. Thus, GS attempts to capture the total additive
genetic variance with genome-wide marker coverage and effect
estimates, contrasting with MARS strategies that utilize a small
number of significant markers for prediction and selection.
47. Advantages of GS:
◆ It is especially important for quantitative traits conferred by a
large number of genes each with a small effect.
◆ GS includes all markers in the model so that effect estimates are
unbiased and small effect QTL can be accounted for.
◆ Reduce the frequency of phenotyping because selection is based on
genotypic data rather than phenotypic data.
◆ Reduce cycle time, thereby increasing annual gains from selection.
Disadvantages of GS:
◆ Traits with lower heritability require larger TPs to maintain high
accuracies.
◆ When single crosses are unrelated to the training population (TP),
even if sufficient markers and training records are available, marker
effects could be inconsistent because of the presence of different
alleles, allele frequencies, and genetic background effects, i.e.
epistasis. So genetic model isn’t universal in different populations.
48. Summary of MAS for quantitative traits
Most agronomic important traits are quantitatively inherited. A wide
range of segregating populations derived from bi-parental crosses,
including RILs, DHs, F2 and its derived populations, and BC or testcross
populations, have been used for QTL mapping. And many major
important QTLs have been cloned in rice. Oppositely, slow progresses
have been made so far in MAS-based breeding for complex traits, mainly
due to the following two aspects.
(1) Segregation populations derived from bi-parents can’t identify
favorable alleles for the target traits. So we don’t have information about
favorable alleles for the target trait which will be best used in molecular
breeding.
(2) QTL mapping is separate from breeding program. Owing to QTL
mapping results are seriously dependent on genetic background. So QTL
information from mapping populations can’t be directly applied in MAS-
breeding.
49. So, integration of QTL mapping with MAS-based
breeding in the same genetic background has been
strongly recommended for complex quantitative traits by
Tanksley and Nelson (1996). So far, AB-QTL method has
been widely used in QTL identification from germplasm.
However, there are still some defects:
(1) Relative high expenses resulting from phenotyping and
genotyping for a large mapping population.
(2) Favorable alleles can not be mined using populations
derived from bi-parents.
50. With the development of sequencing technologies and the sharp
decreased sequencing cost, genome wide association (GWS) has
been recently used for QTL mapping and allele mining from
germplasm resources and made good progresses. However, there
are still some problems with this method.
(1) Wide variations in plant height and heading date of a natural
population seriously affect growth and development for some
early and dwarf entries, thus resulting in inaccurate phenotyping
for those parts of entries.
(2) There is population structure effect on QTL association
mapping.
(3) GWS and MAS-based breeding is still separate.
51. Germplasm holds a large of genetic variation for improving agricultural
crops. However, in the past favorable genes from germplasm have not
been efficiently used in plant breeding due to linkage drag. Although
backcross is effective to simple qualitative traits, it has not been
successful to improve quantitative traits by backcross breeding
procedure.
Here we demonstrate a new breeding strategy of backcross combined
molecular marker technology to efficiently identify QTL and improve
multiple complex traits based on designed QTL pyramiding (DQP).
52. Strategy of integration of QTL mining with QTL-designed pyramiding
using backcross introgression lines in elite background
RP x donors (many) F1s x RP BC1F1s x RP
~25 BC2F1s/donor x RP BC3F1s x RP
Selection for target traits
Self and bulk Self and bulk x
x and backcrossing
harvest harvest
BC2F3-5 bulk populations BC3F2-3 bulk populations BC4F1s
x
1, 2, 3, 4, 5, 6, …… 1, 2, 3, 4, 5, 6, ……
BC4F2s
Screening for target traits such as tolerances to drought, salinity,
high temperature, anaerobic germ., P & Zn def., BPH, etc.
Confirmation of the selected traits by replicated phenotyping
then genotyping of trait-specific lines (ILs)
QTL identification and allele mining
Crosses made between sister ILs DQP & MAS for pyramiding desirable
having unlinked desirable QTLs and against undesirable donor
QTLs for target ecosystem segments for target ecosystem
Develop multiple stress tolerant lines for different ecosystems and release
NILs for individual genes/QTLs for functional genomic studies
53. Salt tolerant introgression lines (ILs) and QTL mapping
Minghui86/Gayabyeo (37)
ST-ILs selected from four
Minghui86/Shennong265 (40)
introgression populations in
Minghui86 background at the Minghui86/Zaoxian14 (33)
overall growth stage
Minghui86/Y134 (40)
54. Principle of using selected ILs and molecular
markers to identify QTLs
QTL detection
Taken allele frequency of the random population as an expected value, a
significant deviation (excess or deficiency) of donor allele frequency at
single loci in the selected IL population from the expected level implies a
positive selection favoring the donor allele (in excess), or negative
selection against the donor allele (in deficiency). Significant deviation
loci are considered as QTLs affecting the selected traits.
Gene action at putative QTLs
● Excess of the donor homozygote additive gene action
● Excess of the heterozygote overdominance gene action
● Excess of both the donor homozygote and heterozygote partial
or complete dominance gene action
57. ST-QTLs detected in at least the two different
ST-IL populations
Gayabyeo Shennong265 Zaoxian14 Y134
Bin2.2 √ √ √ √
Bin1.1 √ √ √
Bin6.1 √ √ √
Bin2.6 √ √
Bin4.6 √ √
Bin5.2 √ √
Bin5.4 √ √
Bin5.6 √ √
Bin8.3 √ √
Bin9.1 √ √
Bin10.3 √ √
Based on phenotypic value and QTL allele distribution, we can easily
select ideal ILs to pyramid different alleles from different donors to
improve the target traits.
58. MAS-based pyramiding of QTLs
A case study of high yield (HY), drought
and salinity tolerance (DT, ST)
using the selected ILs
59. Development of HY-, DT- and Pyramiding of QTLs
ST-ILs for QTL mapping for HY, DT and ST
For DT For ST
SN89366 Bg94-1 GH122 YJ7 JXSM IL1 × IL2 IL3 × IL4 IL5 × IL6 IL7 × IL8
F1 F1 F1 F1
Feng-Ai-Zhan 1 (FAZ1) Backcross & selfing
with HY selection
F2 populations
BC3F5 Pop. 1 Pop. 2 Pop. 3 Pop. 4 Pop. 5 60 random ~30 HY ~30 DT ~30 ST
plants plants plants plants
DT screening ST screening
HY & DT ILs HY & ST ILs Confirmed or cross-testing of
selected ILs for QTL mapping
QTL mapping QTL mapping
FAZ1/SN89366 (IL1) FAZ1/SN89366 (IL5)
New breeding lines with HY, DT and/or ST
HY & FAZ1/Bg94-1 (IL2) FAZ1/Bg94-1 (IL6)
HY &
DT ILs FAZ1/GH122 (IL3) FAZ1/JXSM (IL7) ST ILs Promising lines for RYT
FAZ1/YJ7 (IL4) FAZ1/BG94-1 (IL8)
60. QTLs affecting high yield (HY), drought tolerance (DT) and salinity tolerance (ST)
detected in two pyramiding populations by frequency distortion of genotypes
Pop. Locus Ch. Posi. HY DT ST
2 2 2
X P Gene X P Gene X P Gene
action action action
IL3/IL4 RM486 1 153.5 18.75 0 OD 27.34 0 OD 25.87 0 OD
(DTP2)
OSR14 2 6.9 7.76 0.0206 PD
F2
RM471 4 53.8 13.46 0.0011 OD
RM584 6 26.2 7.74 0.0208 OD
RM3 6 74.3 7.67 0.0216 AD 13.66 0.001 OD
RM2 7 8.08 0.0175 OD
RM547 8 58.1 19.97 0 OD 27.89 0 OD 30.97 0 OD
RM21 11 85.7 10.78 0.0045 AD
RM4A 12 5.2 11.93 0.0025 OD
IL5/IL6 RM297 1 155.9 10.45 0.0053 AD 6.49 0.0389 AD 9.93 0.0069 AD
(STP1)
RM324 2 66 6.31 0.0426 PD
F2
RM55 3 168.2 6.51 0.0385 PD
RM3 6 74.3 13.44 0.0012 AD 9.48 0.0087 AD 7.7 0.0212 AD
RM444 9 3.3 56.43 0 PD
RM434 9 57.7 30.82 0 AD
RM4A 12 5.2 6.29 0.043 OD
RM519 12 62.6 8.19 0.0166 OD
RM235 12 91.3 12.67 0.0017 PD
62. Promising pyramiding lines selected from intercross or repeated
screening for HY and ST from IL1x IL2 population
Selected pop. Intercross No. of Line # Yield of introgression line (g) Salt tolerance of introgression line at the seedling stage
or selected
repeated lines Trait Check ±% No. of survival days Score of salt toxicity of leaves
screening value of comp.
trait higher with Trait Check of ±% Trait Check of ±%
value check value higher comp value higher comp
parent parent check parent check
HY 1 QP49 43.5 30.1 44.8 10 8.8 13.6 4.5 5.5 18.2
QP47 31.8 30.1 5.5 11 8.8 20.6 4.5 5.5 18.2
QP48 29.8 30.1 -0.9 11 8.8 22.9 4.5 5.5 18.2
QP63 24.3 30.1 -19.3 12 8.8 36.4 4.5 5.5 18.2
DT selected (30)
ST 10 QP60 26.3 30.1 -12.6 12 8.8 31.8 4 5.5 27.3
QP61 28.8 30.1 -4.3 11 8.8 30.3 4 5.5 27.3
QP36 28 30.1 -7 11 8.8 29.5 4 5.5 27.3
QP37 28.2 30.1 -6.3 11 8.8 29.7 5 5.5 9.1
QP163 38.6 30.1 28.4 9.6 8.8 9.1 5 5.5 9.1
HY 2
QP167 36.6 30.1 21.8 11.4 8.8 29.5 4 5.5 27.3
QP171 35.8 30.1 18.9 10 8.8 17.1 4.5 5.5 18.2
QP169 32.1 30.1 6.7 12 8.8 33 4.5 5.5 18.2
HY selected (30) QP168 25.4 30.1 -15.6 13 8.8 51.1 4 5.5 27.3
ST 7 QP166 28.3 30.1 -6 11 8.8 29.1 4 5.5 27.3
QP164 23 30.1 -23.4 11 8.8 25.7 4 5.5 27.3
QP170 17.4 30.1 -42.2 11 8.8 25.1 4.5 5.5 18.2
QP165 24.5 30.1 -18.7 11 8.8 20.6 4 5.5 27.3
QP327 36.6 30.1 21.6 NA NA NA NA NA NA
ST selected (33) HY 2
QP337 34.9 30.1 15.9 NA NA NA NA NA NA
63. Based on phenotypic and QTL information of trait-specific ILs, a new line with
HY, DT and ST was developed by pyramiding of different target QTLs
( )
Zhong-Guang-Lv 1(HY, DT & ST)
RYT in Yunnan province in 2011
65. Molecular recurrent selection systems for improving
multiple complex traits based on trait-specific
ILs and dominant male sterile (DMS) line
66. Selection for multiple traits
Developments of MAS-based improvement strategies required for
multiple traits should include understanding the correlation between
different traits
◆ Interaction between components of a very complex trait such as
drought tolerance
◆ Genetic dissection of the developmental correlation
◆ Understanding of genetic networks
◆ Construction of selection indices across multiple traits.
The methods for pyramiding genes affecting a specific trait can be used
to accumulate QTL alleles controlling different traits. A distinct
difference in concept is that alleles at different trait loci to be
accumulated may have different favorable directions, i.e. negative alleles
are favorable for some traits but positive alleles are favorable for others.
Therefore, we may need to combine the positive QTL alleles of some
traits with the negative alleles of others to meet breeding objectives.
67. Development of a DMS line in HHZ background
Jiafuzhan (rr, fertile)
Spontaneous mutation
Jiafuzhan (Rr, sterile)
x Jiafuzhan (rr, fertile)
Jiafuzhan (1Rr sterile : 1rr fertile)
x HHZ (rr)
F1 (1Rr sterile : 1rr fertile)
x HHZ (rr), backcross 4-5 times
Anthers with different fertility
HHZ (1Rr sterile : 1rr fertile) A: full sterile anther
B: full fertile anther
C,D: partial fertile anther
68. Composition of the molecular RS (MRS) populations:
30-50 ILs/PLs carrying favorable QTL alleles from different
donors plus the DMS line in the same genetic backgrounds (HHZ)
MRS population in HHZ GB
Ovals or boxes of
Bulk harvest different colors
seeds from represent different ILs
fertile plants
carrying genes/QTLs
to be screened
for target traits
for different target
traits
HHZ MS Bulk harvest
line seeds from Development of RS
sterile plants population is still
for next round under the way
of RS
Each fertile individual has even chance to pollinate with DMS plants,
ensuring all possible recombination produced inside the RS population
69. Combine DMS line-based RS system with whole genome selection
RS populations based on trait-specific ILs
and a DMS line in the same GB
Continued
50% fertile plants 50% DMS plants introgression
Trait screening breeding/DQP
Irrigated Abiotic Biotic
(YP) stresses stresses RILs
New
ILs/PLs
GS
Trait-improved model
lines
New MRS
New lines with multiple population for
traits by pyramiding GS next round
RYT and NCT
under different GS
target Es Continuation
of MRS
Farmers in dif.
target Es
70. Precise and high-throughput phenotyping
High-throughput and precision phenotyping is critical for genetic
analysis of traits using molecular markers, and for time- and cost-
effective implementation of MAS in breeding. To match up with
the capacity and costefficiency of currently available genotyping
systems, a precision phenotyping system needs high-throughput
data generation, collection, processing, analysis, and delivery.
High Resolution Plant Phenomics The Plant Accelerator
71. The High Resolution Plant Phenomics Centre (HRPPC)
Phenomics technology in the field
72. Designed: to straddle a plot and collect
measurements of canopy temperature, crop
stress indices, crop chemometrics, canopy
volume, biomass and crop ground cover
Phenomobile
From 16 meters above the crop canopy.
Phenotower collects infra-red thermography
and colour imagery of field plots.
This data is used for spatial comparison of
canopy temperature, leaf greenness and
groundcover between genotypes at a single
point in time.
Phenotower
73. Plant scan
Tethered blimp
Measurements include:
◆ Leaf size The blimp will carry both infrared
◆ Number of leaves and digital color cameras operating
◆ Shape in a height range of 10 m to 80 m
◆ Topology (study of constant properties) above the field.
◆ Surface orientation It will identify the relative
◆ Leaf color differences in canopy temperature
◆ Plant area and volume indicating plant water use.
75. A flowchart for whole-genome strategies in marker-assisted plant breeding. The system starts with
natural and artificial crop populations to develop novel germplasm through four key platforms,
genotyping, phenotyping, e-typing (environmental assay), and breeding informatics, which need
decision support system in various steps towards product development.