Downloaded 1,881 times
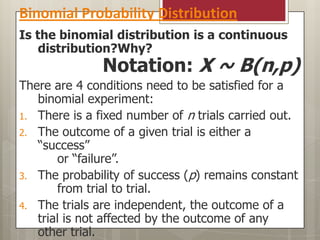
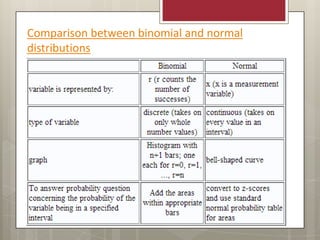
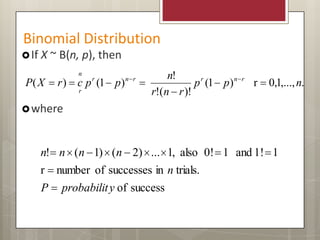

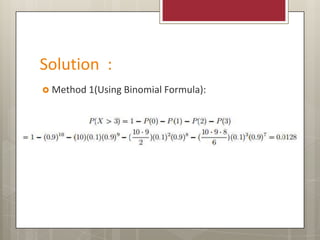
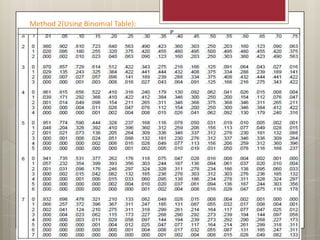

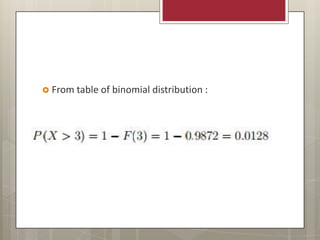


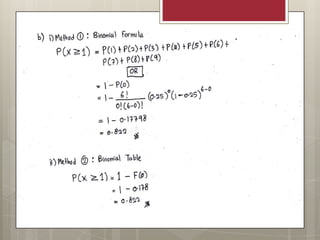


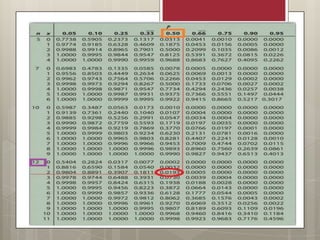

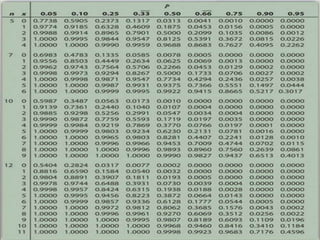

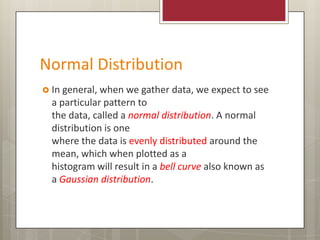

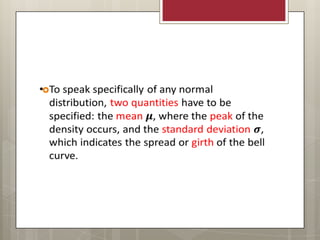
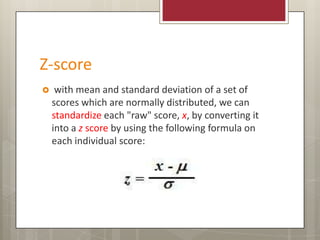
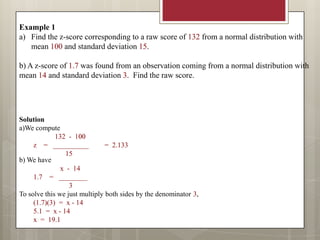
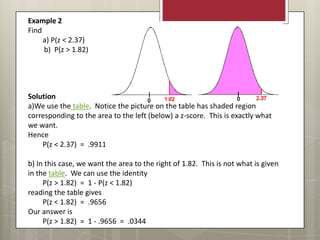


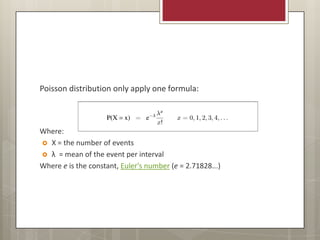


The document provides an overview of statistical distributions, including the binomial, normal, and Poisson distributions, detailing their characteristics and applications. It outlines the conditions for binomial experiments, compares binomial to normal distributions, and offers examples of calculating probabilities with these distributions. Additionally, it presents methods for using z-scores in normal distributions and the Poisson formula for discrete events.


