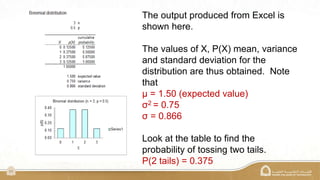
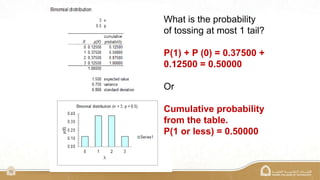
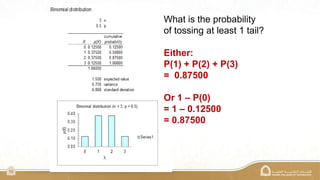
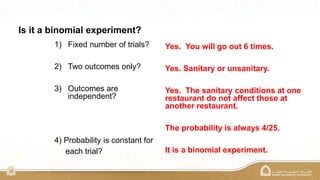
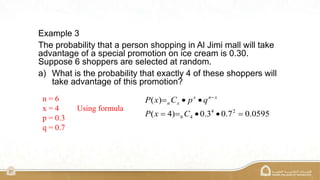
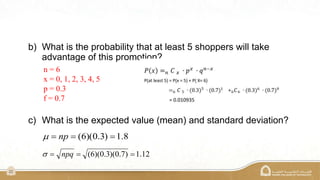
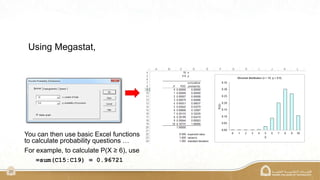
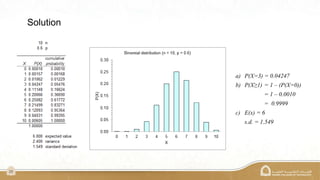
The document explains the binomial distribution, a discrete probability distribution resulting from experiments with a finite number of trials, each having two possible outcomes. It details the necessary parameters for calculating probabilities, including the number of trials and the probabilities of success and failure, as well as using Excel's MegaStat for computations. Several examples illustrate how to calculate probabilities and expected values in different scenarios involving binomial experiments.


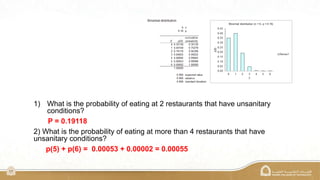
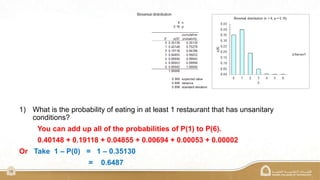
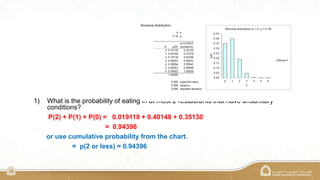
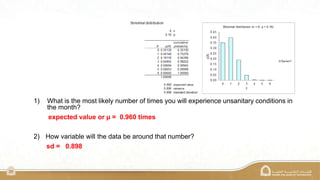


![Hacking-Uncovered-How-People-Get-Hacked-and-How-to-Stay-Safe[1].pptx](https://cdn.slidesharecdn.com/ss_thumbnails/hacking-uncovered-how-people-get-hacked-and-how-to-stay-safe1-260130170011-4883a9c7-thumbnail.jpg?width=640&height=640&fit=bounds)


