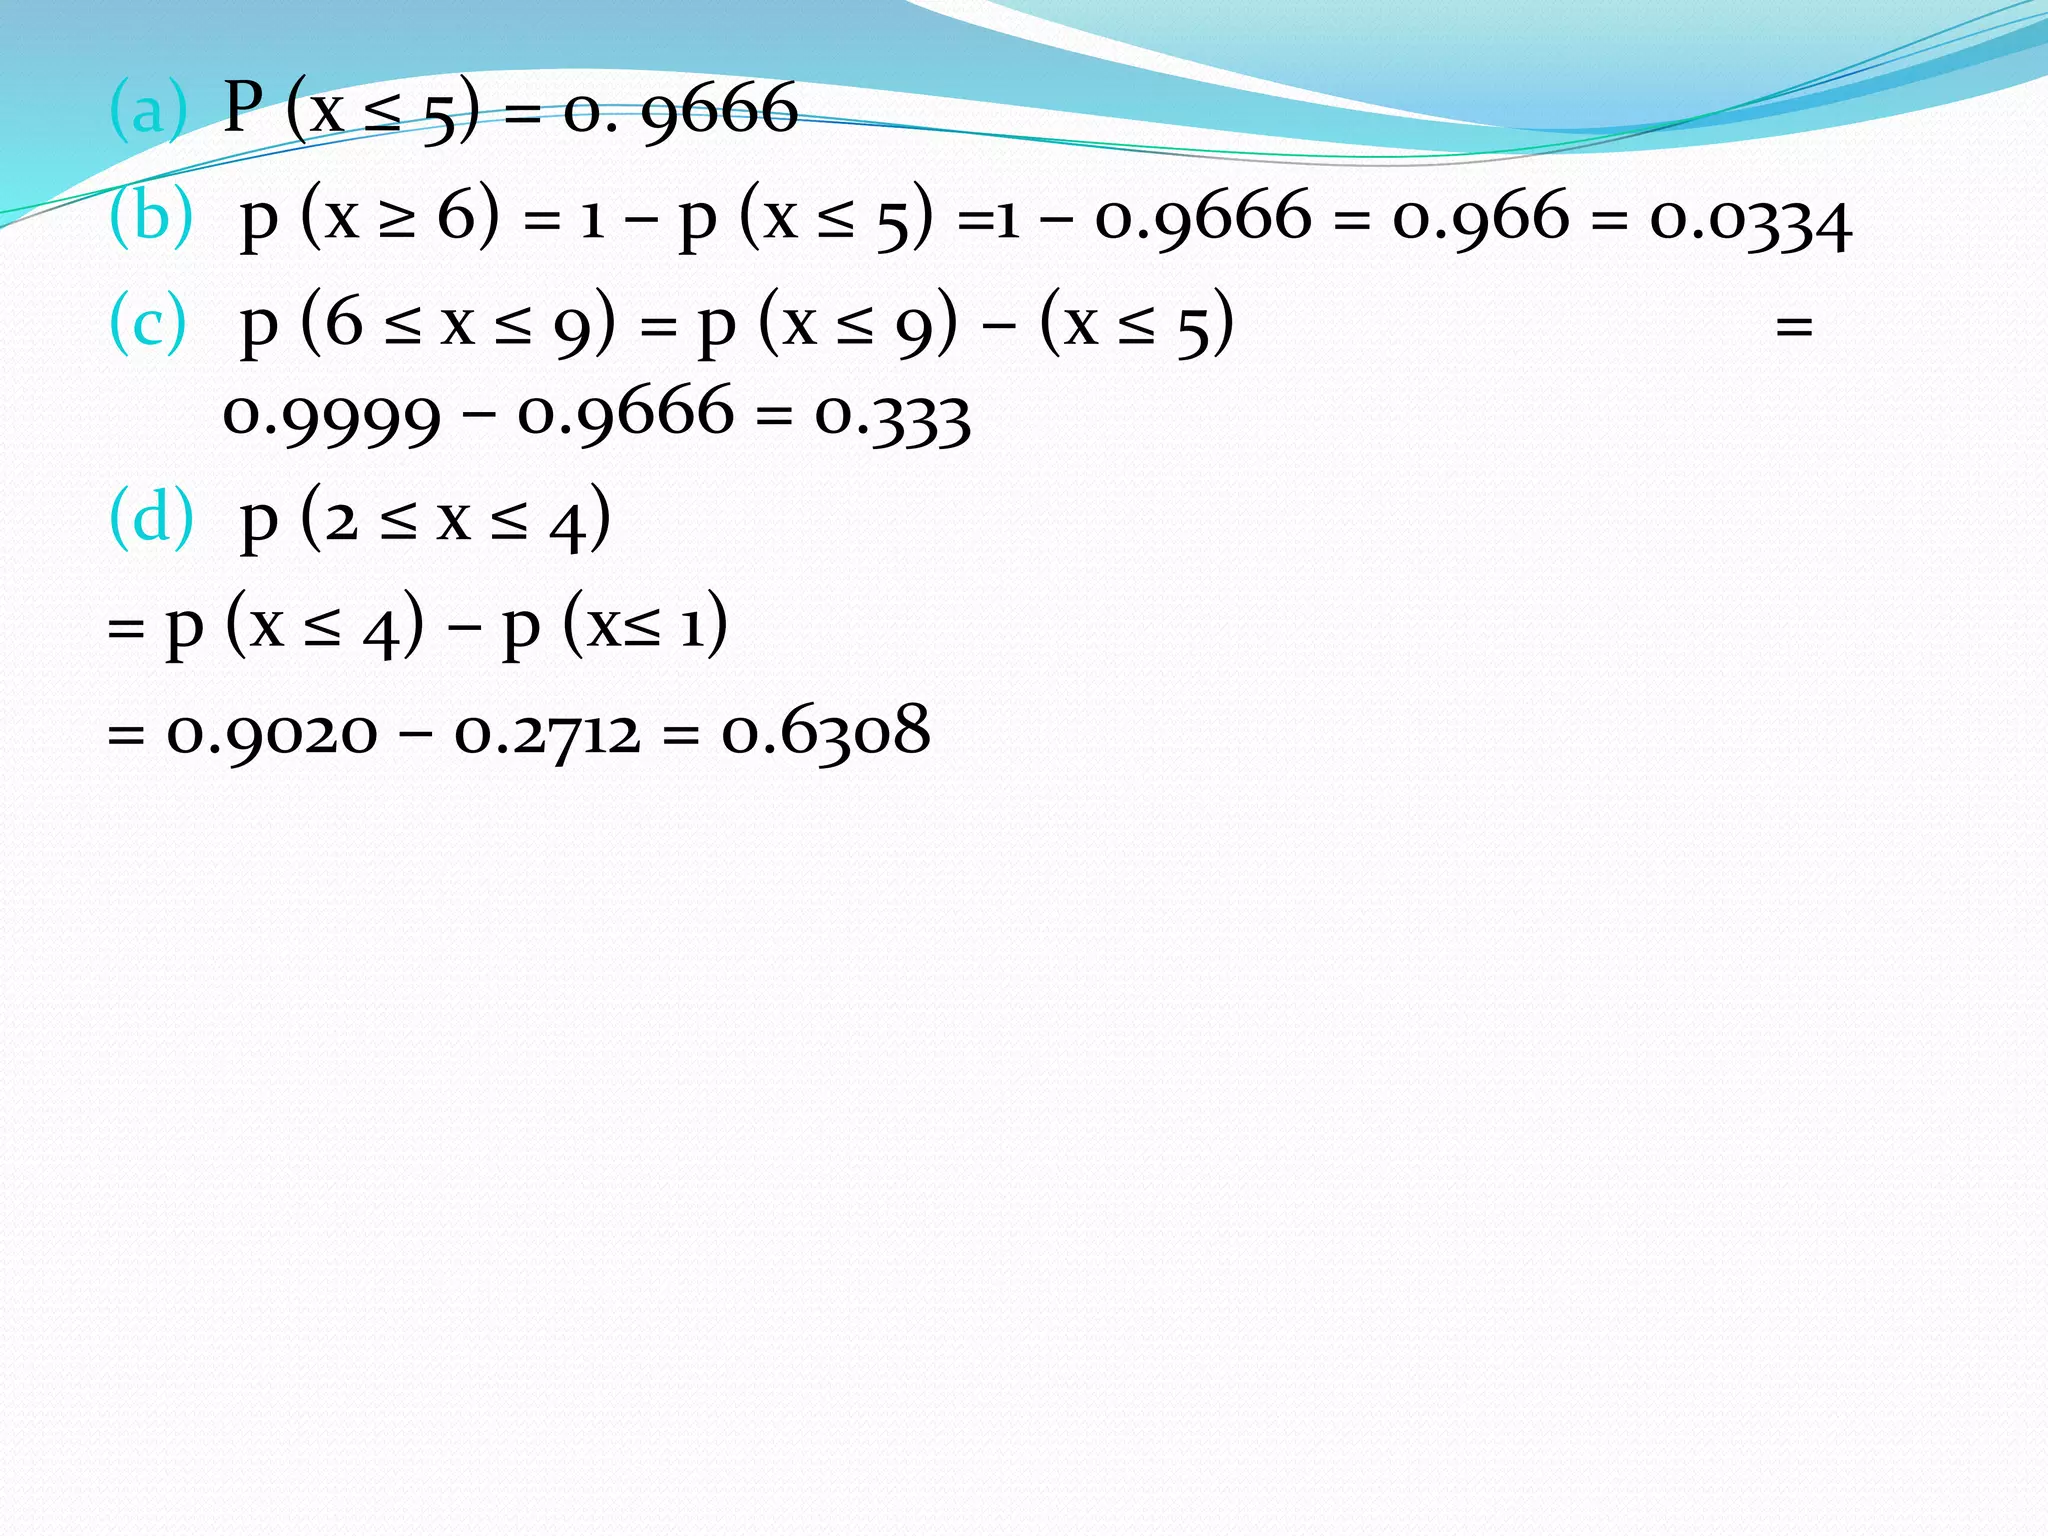
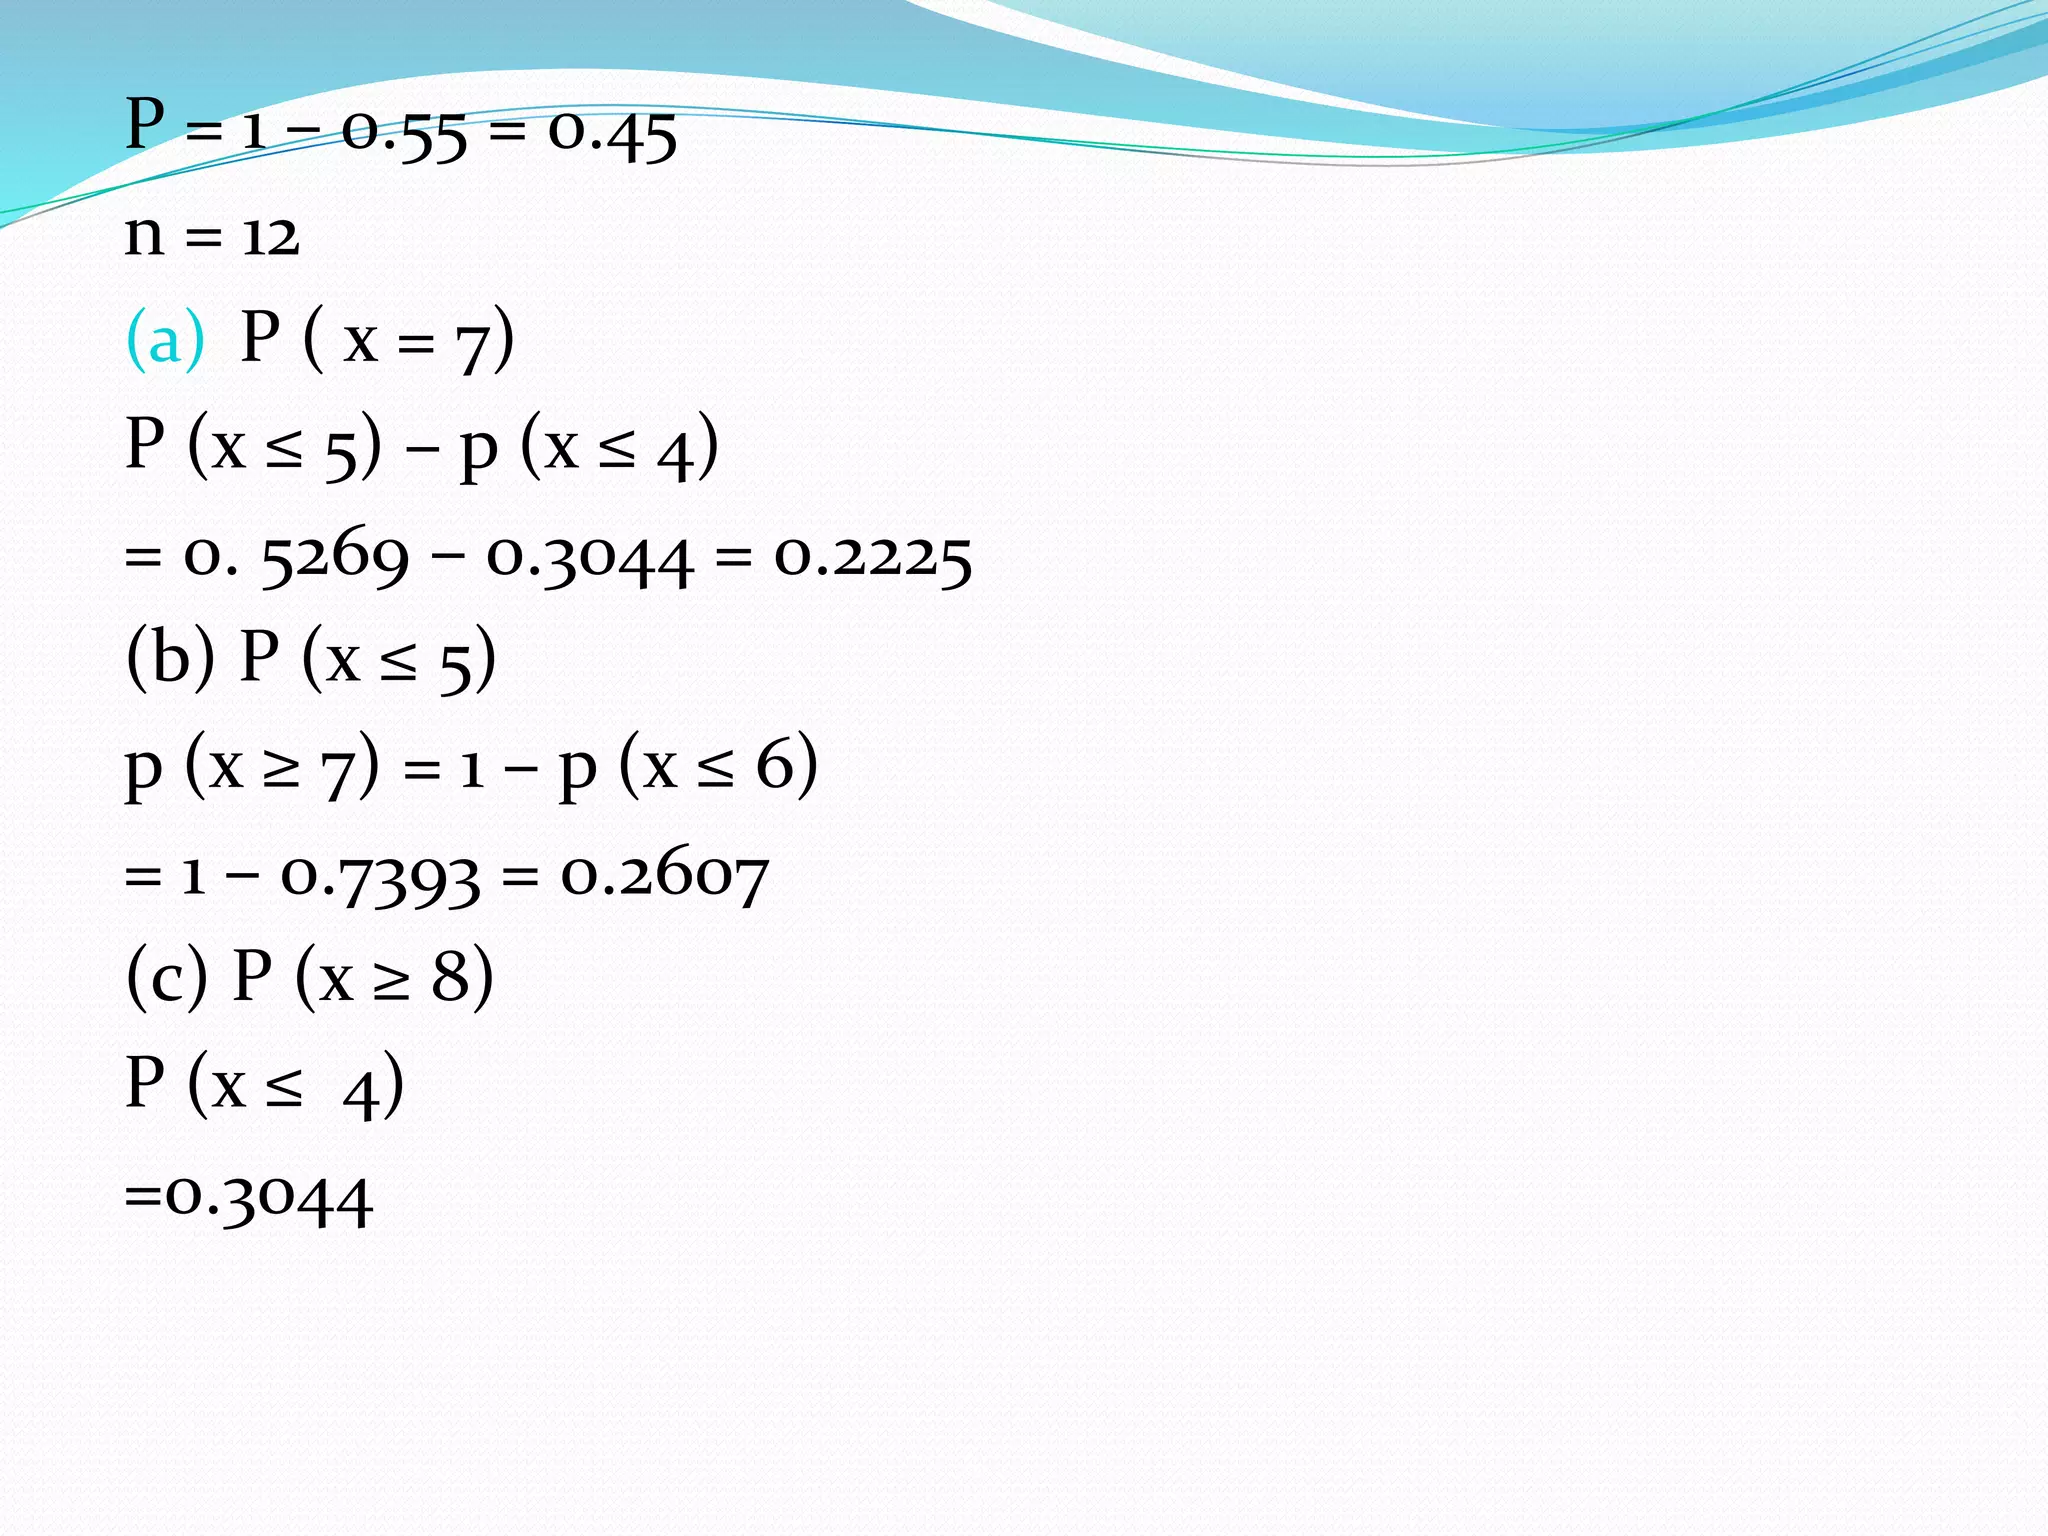
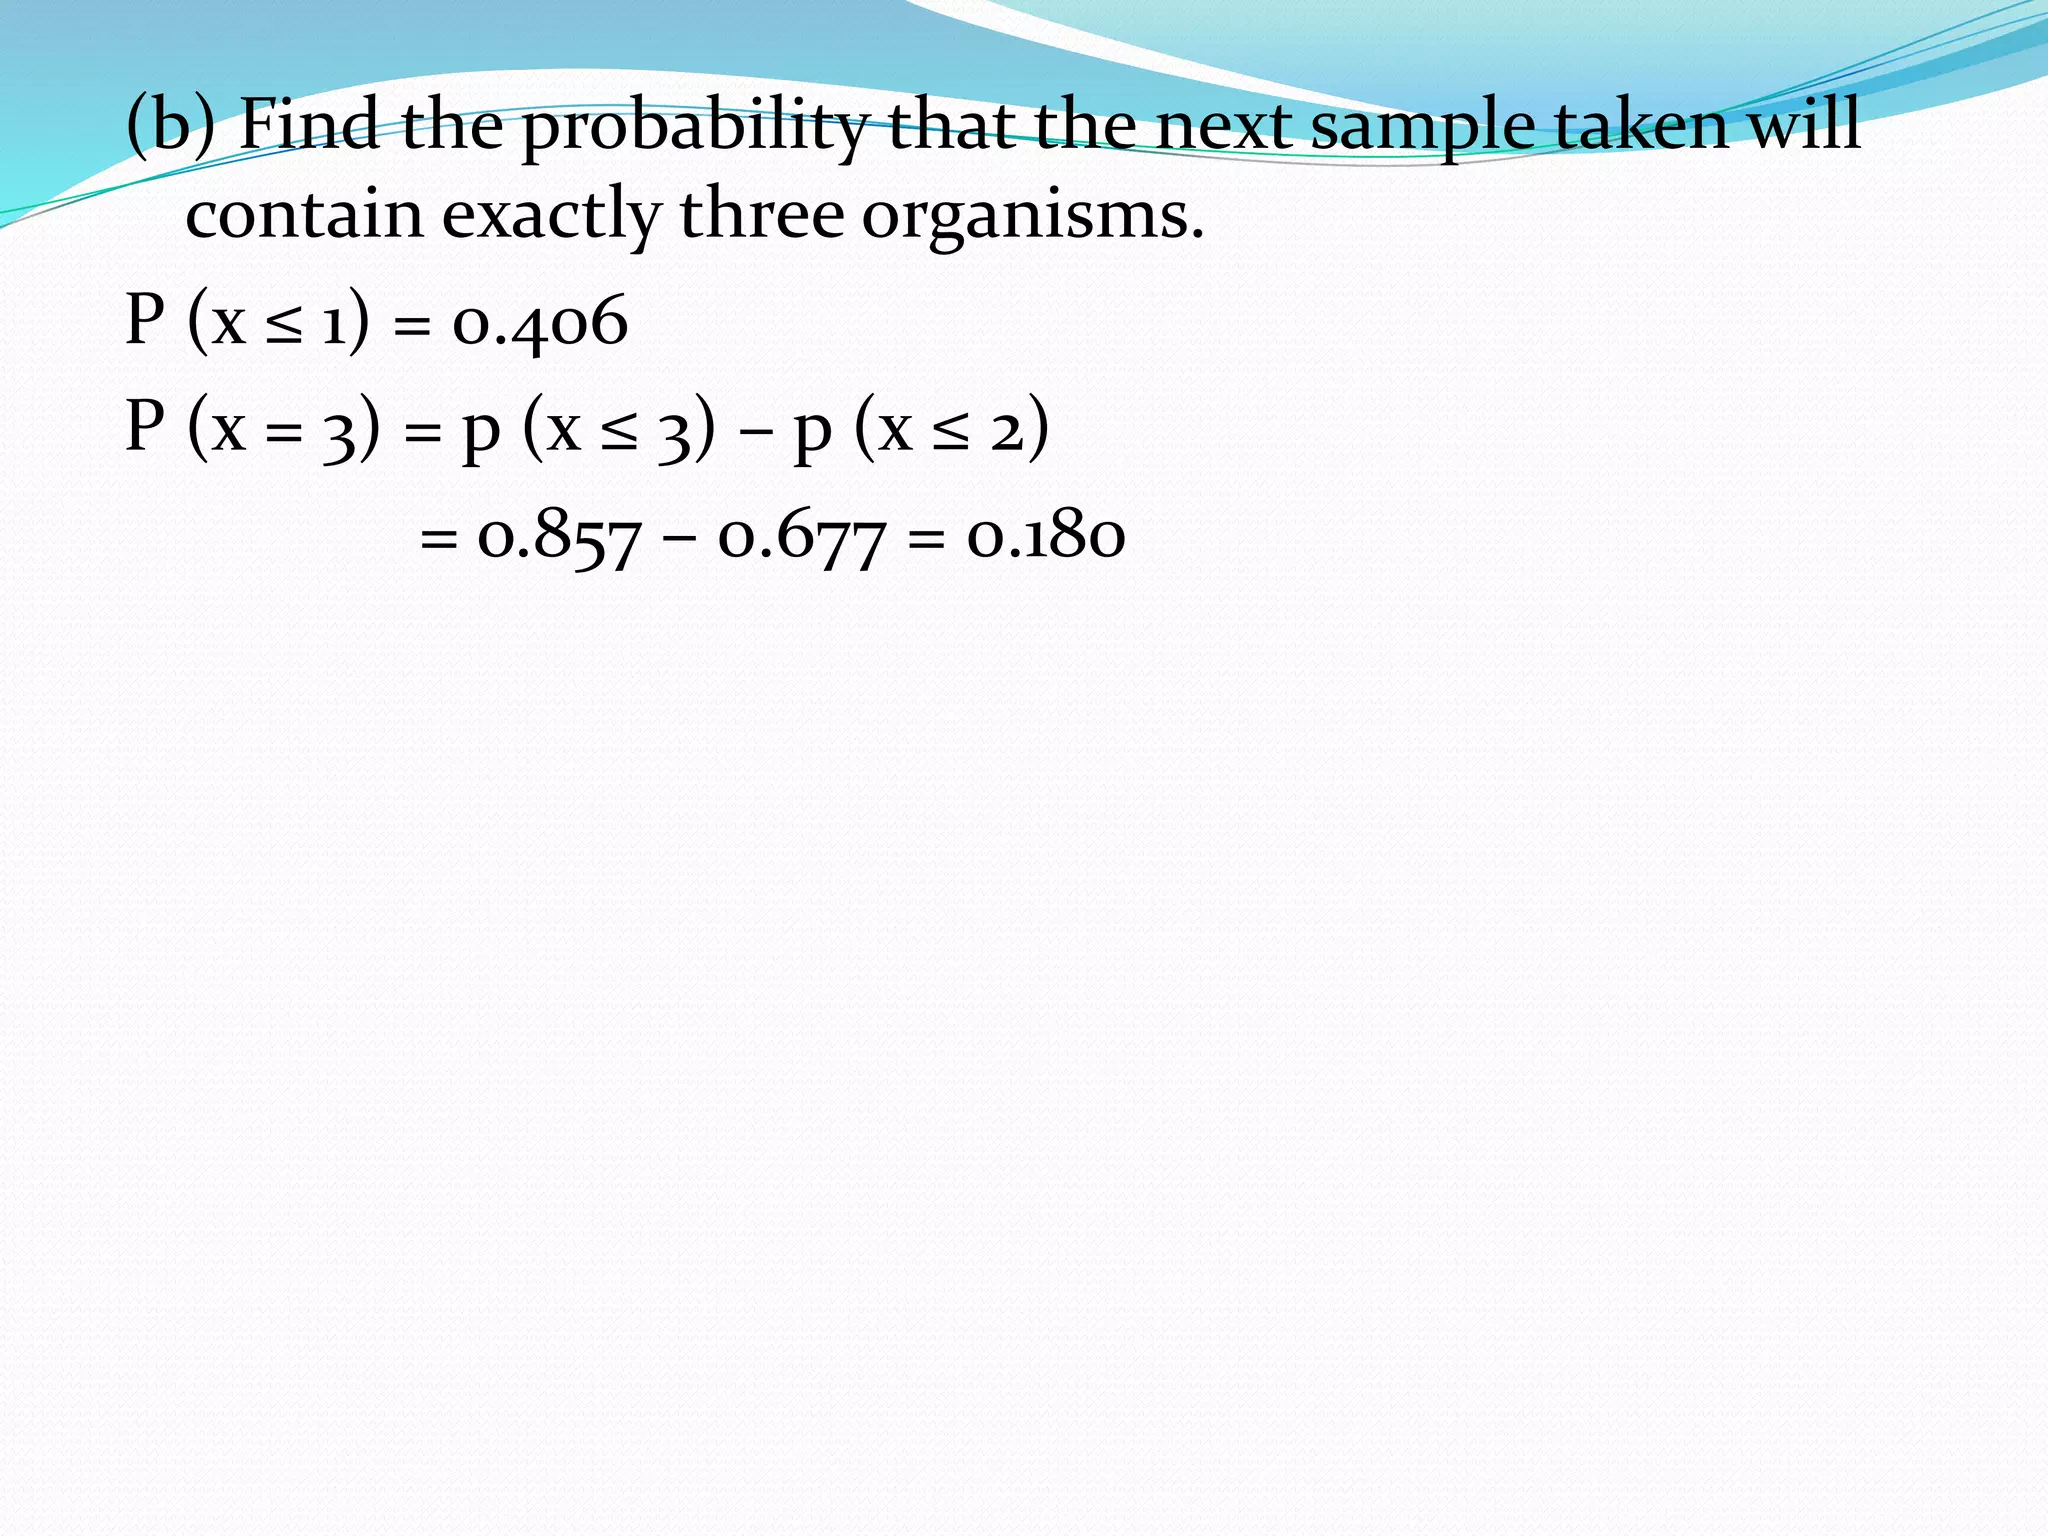
1. one of the most widely use probability distributions in
applied statistics.
the distribution is derived from a process known as a
Bernoulli trial.
when a random process or experiment, called a trial, can
result in only one of two mutually exclusive outcomes such
as dead or alive, sick or well, full term or premature, the
trial is called a Bernoulli trial.
2. 1. Each trial results in one of two mutually exclusive,
outcomes. One of the possible outcomes is denoted
(arbitrary) as a success, and the other is denoted as a
failure.
2. The probability of a success, denoted by p, remains
constant from trial to trial. The probability of a
failure, 1-p, is denoted by q
3. The trials are independent, that is, the outcome of
any particular trial is not affected by the outcome of
any other trial.
3. Example
If we examine all birth records from the North Carolina state
Centre for Health Statics (A-3) for the calendar year 2001, we
fine that 85.8% of the pregnancies had delivery in week 37 or
later. We will refer to this as a full-term birth. With that
percentage, we can interpret the probability of a recorded
from this population, what is the probability that exactly
three of the records will be for full-term births?
4. full term birth denoted as ‘success’ (F)
premature birth denoted as ‘failure’ (P)
FPFFP
assign 1 as success and failure as 0
10110
success is denoted as p, failure is denoted as q
the probability of the above sequence of outcomes is
p(1,0,1,1,0) = pqppq = q2 p3
6. P = .0.858, q = (1- 0.858) = 0.142
The probability in random sample of size 5, drawn from
the specific population, of observing three success and
two failures is
10 x (0.142)2 x(0.858)3 =10 x 0.0202 x 0.6316
= 0.1276
Formula for large sample procedure
n c x = x!(n – x)!
n!
the number of combinations of n objects that can be
formed by taking x of them at a time is given
7. f(x) = n c x qn-x px for x =0,1,2,…,n
The probability of obtaining exactly x successes in n
trials
8. Binomial Table
The probabilities for different values of n, p, and x have
been tabulated, so that we need only to consult an
appropriate table to obtain the desired probability.
Table B is one of many such tables available.
9. Example 1
Suppose we known that 10 percent of a certain
population is color blind. If a random sample of 25
people is drawn from this population, use Table B in
the Appendix to find the probability that
(a) Five or fewer will be color blind
(b) six or more will be color blind
(c) between six and nine inclusive will be color blind
(d) two, three, or four will be color blind
10. (a) P (x ≤ 5) = 0. 9666
(b) p (x ≥ 6) = 1 – p (x ≤ 5) =1 – 0.9666 = 0.966 = 0.0334
(c) p (6 ≤ x ≤ 9) = p (x ≤ 9) – (x ≤ 5) =
0.9999 – 0.9666 = 0.333
(d) p (2 ≤ x ≤ 4)
= p (x ≤ 4) – p (x≤ 1)
= 0.9020 – 0.2712 = 0.6308
11. Example 2
according to a June 2003 poll conducted by the
Massachusetts Health Benchmarks project,
approximately 55% of residents answered “serious
problem” to the question. “Some people think that
childhood obesity is a national health problem, not
much of a problem, or not a problem at all?” Assuming
that the probability of giving this answer to the
questions is 0.55 for any Massachusetts resident, use
Table B to find the probability that if 12 resident are
chosen at random.
12. (a) Exactly seven will answer serious problem
(b) five or fewer households will answer serious problem
(c) eight or more households will answer serious
problem
14. P = 1 – 0.55 = 0.45
n = 12
(a) P ( x = 7)
P (x ≤ 5) – p (x ≤ 4)
= 0. 5269 – 0.3044 = 0.2225
(b) P (x ≤ 5)
p (x ≥ 7) = 1 – p (x ≤ 6)
= 1 – 0.7393 = 0.2607
(c) P (x ≥ 8)
P (x ≤ 4)
=0.3044
15. Poisson Distribution
if x is the number of occurrences of some random
event in an interval of time or space (or some volume
of matter), the probability that x will occur is given by
f(x) = e-λ
x!
λx , x = 0, 1, 2, ……, n
λ is called the parameter of the distribution
e is constant (2.7183)
16. The Poisson Process
1. The occurrences of the events are independent. The
occurrences of an event in an interval of space or time
has no effect on the probability of a second occurrence of
the even in the same or any other interval.
2. an infinite number of occurrences of the event must be
possible in the interval.
3. the probability of the single occurrence of the event in a
given interval is proportional to the length of the
interval.
4. in any infinitesimally small portion of the interval, the
probability of more than one occurrence of the event is
negligible.
Table C is use for Poisson Distribution
17. Example
In the study of a certain aquatic organism, a large
number of samples were taken from a pond, and the
number of organism in each sample was counted. The
average number of organisms per sample was found to
be two. Assuming that the number of organisms
follows a Poisson distributions,(a) find the probability
that the next sample taken will contain one or fewer
organisms.
18. (b) Find the probability that the next sample taken will
contain exactly three organisms.
P (x ≤ 1) = 0.406
P (x = 3) = p (x ≤ 3) – p (x ≤ 2)
= o.857 – 0.677 = 0.180