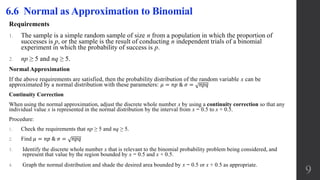
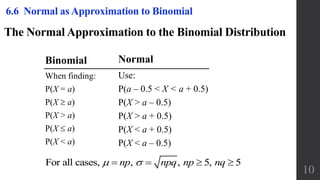
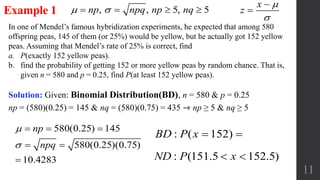
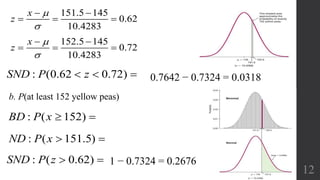
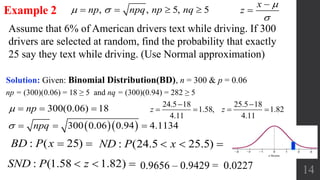
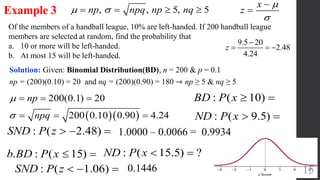
The document discusses approximating binomial probabilities with a normal distribution. It defines the binomial distribution and states the requirements for the normal approximation are that np and nq must both be greater than or equal to 5. The normal approximation involves using a normal distribution with mean np and standard deviation npq. Examples are provided demonstrating how to calculate probabilities for binomial experiments using the normal approximation.
Please Subscribe to this Channel for more solutions and lectures
http://www.youtube.com/onlineteaching
Chapter 5: Discrete Probability Distribution
5.2 - Binomial Probability Distributions
: Random Variable, Discrete Random variable, Continuous random variable, Probability Distribution of Discrete Random variable, Mathematical Expectations and variance of a discrete random variable.
Please Subscribe to this Channel for more solutions and lectures
http://www.youtube.com/onlineteaching
Chapter 5: Discrete Probability Distribution
5.1: Probability Distribution
Please Subscribe to this Channel for more solutions and lectures
http://www.youtube.com/onlineteaching
Chapter 6: Normal Probability Distribution
6.6: Normal as Approximation to Binomial
Please Subscribe to this Channel for more solutions and lectures
http://www.youtube.com/onlineteaching
Chapter 5: Discrete Probability Distribution
5.2 - Binomial Probability Distributions
: Random Variable, Discrete Random variable, Continuous random variable, Probability Distribution of Discrete Random variable, Mathematical Expectations and variance of a discrete random variable.
Please Subscribe to this Channel for more solutions and lectures
http://www.youtube.com/onlineteaching
Chapter 5: Discrete Probability Distribution
5.1: Probability Distribution
Please Subscribe to this Channel for more solutions and lectures
http://www.youtube.com/onlineteaching
Chapter 6: Normal Probability Distribution
6.6: Normal as Approximation to Binomial
Descriptive Statistics Formula Sheet Sample Populatio.docxsimonithomas47935
Descriptive Statistics Formula Sheet
Sample Population
Characteristic statistic Parameter
raw scores x, y, . . . . . X, Y, . . . . .
mean (central tendency) M =
∑ x
n
μ =
∑ X
N
range (interval/ratio data) highest minus lowest value highest minus lowest value
deviation (distance from mean) Deviation = (x − M ) Deviation = (X − μ )
average deviation (average
distance from mean)
∑(x − M )
n
= 0
∑(X − μ )
N
sum of the squares (SS)
(computational formula) SS = ∑ x
2 −
(∑ x)2
n
SS = ∑ X2 −
(∑ X)2
N
variance ( average deviation2 or
standard deviation
2
)
(computational formula)
s2 =
∑ x2 −
(∑ x)2
n
n − 1
=
SS
df
σ2 =
∑ X2 −
(∑ X)2
N
N
standard deviation (average
deviation or distance from mean)
(computational formula) s =
√∑ x
2 −
(∑ x)2
n
n − 1
σ =
√∑ X
2 −
(∑ X)2
N
N
Z scores (standard scores)
mean = 0
standard deviation = ± 1.0
Z =
x − M
s
=
deviation
stand. dev.
X = M + Zs
Z =
X − μ
σ
X = μ + Zσ
Area Under the Normal Curve -1s to +1s = 68.3%
-2s to +2s = 95.4%
-3s to +3s = 99.7%
Using Z Score Table for Normal Distribution
(Note: see graph and table in A-23)
for percentiles (proportion or %) below X
for positive Z scores – use body column
for negative Z scores – use tail column
for proportions or percentage above X
for positive Z scores – use tail column
for negative Z scores – use body column
to discover percentage / proportion between two X values
1. Convert each X to Z score
2. Find appropriate area (body or tail) for each Z score
3. Subtract or add areas as appropriate
4. Change area to % (area × 100 = %)
Regression lines
(central tendency line for all
points; used for predictions
only) formula uses raw
scores
b = slope
a = y-intercept
y = bx + a
(plug in x
to predict y)
b =
∑ xy −
(∑ x)(∑ y)
n
∑ x2 −
(∑ x)2
n
a = My - bMx
where My is mean of y
and Mx is mean of x
SEest (measures accuracy of predictions; same properties as standard deviation)
Pearson Correlation Coefficient
(used to measure relationship;
uses Z scores)
r =
∑ xy−
(∑ x)(∑ y)
n
√(∑ x2−
(∑ x)2
n
)(∑ y2−
(∑ y)2
n
)
r =
degree x & 𝑦 𝑣𝑎𝑟𝑦 𝑡𝑜𝑔𝑒𝑡ℎ𝑒𝑟
degree x & 𝑦 𝑣𝑎𝑟𝑦 𝑠𝑒𝑝𝑎𝑟𝑎𝑡𝑒𝑙𝑦
r
2
= estimate or % of accuracy of predictions
PSYC 2317 Mark W. Tengler, M.S.
Assignment #9
Hypothesis Testing
9.1 Briefly explain in your own words the advantage of using an alpha level (α) = .01
versus an α = .05. In general, what is the disadvantage of using a smaller alpha
level?
9.2 Discuss in your own words the errors that can be made in hypothesis testing.
a. What is a type I error? Why might it occur?
b. What is a type II error? How does it happen?
9.3 The term error is used in two different ways in the context of a hypothesis test.
First, there is the concept of sta
Please Subscribe to this Channel for more solutions and lectures
http://www.youtube.com/onlineteaching
Chapter 6: Normal Probability Distribution
6.4: The Central Limit Theorem
Please Subscribe to this Channel for more solutions and lectures
http://www.youtube.com/onlineteaching
Chapter 6: Normal Probability Distribution
6.1: The Standard Normal Distribution
Please Subscribe to this Channel for more solutions and lectures
http://www.youtube.com/onlineteaching
Elementary Statistics Practice Test 4
Chapter 9: Inferences about Two Samples
Please Subscribe to this Channel for more solutions and lectures
http://www.youtube.com/onlineteaching
Elementary Statistics Practice Test 4
Chapter 8: Hypothesis Testing
Solution to the practice test ch 10 correlation reg ch 11 gof ch12 anovaLong Beach City College
Please Subscribe to this Channel for more solutions and lectures
http://www.youtube.com/onlineteaching
Elementary Statistics Practice Test 5
Module 5
Chapter 10: Correlation and Regression
Chapter 11: Goodness of Fit and Contingency Tables
Chapter 12: Analysis of Variance
Please Subscribe to this Channel for more solutions and lectures
http://www.youtube.com/onlineteaching
Elementary Statistics Practice Test 5
Module 5
Chapter 10: Correlation and Regression
Chapter 11: Goodness of Fit and Contingency Tables
Chapter 12: Analysis of Variance
Please Subscribe to this Channel for more solutions and lectures
http://www.youtube.com/onlineteaching
Elementary Statistics Practice Test 4
Module 4:
Chapter 8, Hypothesis Testing
Chapter 9: Two Populations
Solution to the practice test ch 8 hypothesis testing ch 9 two populationsLong Beach City College
Please Subscribe to this Channel for more solutions and lectures
http://www.youtube.com/onlineteaching
Elementary Statistics Practice Test 4
Module 4:
Chapter 8, Hypothesis Testing
Chapter 9: Two Populations
Solution to the Practice Test 3A, Chapter 6 Normal Probability DistributionLong Beach City College
Please Subscribe to this Channel for more solutions and lectures
http://www.youtube.com/onlineteaching
Elementary Statistics Practice Test 3
Practice Test Chapter 6 (Normal Probability Distributions)
Chapter 6: Normal Probability Distributions
Please Subscribe to this Channel for more solutions and lectures
http://www.youtube.com/onlineteaching
Elementary Statistics Practice Test 3
Practice Test Chapter 6 (Normal Probability Distributions)
Chapter 6: Normal Probability Distributions
Please Subscribe to this Channel for more solutions and lectures
http://www.youtube.com/onlineteaching
Elementary Statistics Practice Test 2 Solutions
Chapter 4: Probability
Please Subscribe to this Channel for more solutions and lectures
http://www.youtube.com/onlineteaching
Elementary Statistics Practice Test 2
Chapter 4: Probability
Please Subscribe to this Channel for more solutions and lectures
http://www.youtube.com/onlineteaching
Elementary Statistics Practice Test 1
Module 1: Chapters 1-3
Chapter 1: Introduction to Statistics.
Chapter 2: Exploring Data with Tables and Graphs.
Chapter 3: Describing, Exploring, and Comparing Data.
Please Subscribe to this Channel for more solutions and lectures
http://www.youtube.com/onlineteaching
Chapter 12: Analysis of Variance
12.2: Two-Way ANOVA
Please Subscribe to this Channel for more solutions and lectures
http://www.youtube.com/onlineteaching
Chapter 12: Analysis of Variance
12.1: One-Way ANOVA
Please Subscribe to this Channel for more solutions and lectures
http://www.youtube.com/onlineteaching
Chapter 11: Goodness-of-Fit and Contingency Tables
11.2: Contingency Tables
Please Subscribe to this Channel for more solutions and lectures
http://www.youtube.com/onlineteaching
Chapter 11: Goodness-of-Fit and Contingency Tables
11.1: Goodness of Fit Notation
Welcome to TechSoup New Member Orientation and Q&A (May 2024).pdfTechSoup
In this webinar you will learn how your organization can access TechSoup's wide variety of product discount and donation programs. From hardware to software, we'll give you a tour of the tools available to help your nonprofit with productivity, collaboration, financial management, donor tracking, security, and more.
Operation “Blue Star” is the only event in the history of Independent India where the state went into war with its own people. Even after about 40 years it is not clear if it was culmination of states anger over people of the region, a political game of power or start of dictatorial chapter in the democratic setup.
The people of Punjab felt alienated from main stream due to denial of their just demands during a long democratic struggle since independence. As it happen all over the word, it led to militant struggle with great loss of lives of military, police and civilian personnel. Killing of Indira Gandhi and massacre of innocent Sikhs in Delhi and other India cities was also associated with this movement.
Ethnobotany and Ethnopharmacology:
Ethnobotany in herbal drug evaluation,
Impact of Ethnobotany in traditional medicine,
New development in herbals,
Bio-prospecting tools for drug discovery,
Role of Ethnopharmacology in drug evaluation,
Reverse Pharmacology.
How to Split Bills in the Odoo 17 POS ModuleCeline George
Bills have a main role in point of sale procedure. It will help to track sales, handling payments and giving receipts to customers. Bill splitting also has an important role in POS. For example, If some friends come together for dinner and if they want to divide the bill then it is possible by POS bill splitting. This slide will show how to split bills in odoo 17 POS.
2024.06.01 Introducing a competency framework for languag learning materials ...Sandy Millin
http://sandymillin.wordpress.com/iateflwebinar2024
Published classroom materials form the basis of syllabuses, drive teacher professional development, and have a potentially huge influence on learners, teachers and education systems. All teachers also create their own materials, whether a few sentences on a blackboard, a highly-structured fully-realised online course, or anything in between. Despite this, the knowledge and skills needed to create effective language learning materials are rarely part of teacher training, and are mostly learnt by trial and error.
Knowledge and skills frameworks, generally called competency frameworks, for ELT teachers, trainers and managers have existed for a few years now. However, until I created one for my MA dissertation, there wasn’t one drawing together what we need to know and do to be able to effectively produce language learning materials.
This webinar will introduce you to my framework, highlighting the key competencies I identified from my research. It will also show how anybody involved in language teaching (any language, not just English!), teacher training, managing schools or developing language learning materials can benefit from using the framework.
Synthetic Fiber Construction in lab .pptxPavel ( NSTU)
Synthetic fiber production is a fascinating and complex field that blends chemistry, engineering, and environmental science. By understanding these aspects, students can gain a comprehensive view of synthetic fiber production, its impact on society and the environment, and the potential for future innovations. Synthetic fibers play a crucial role in modern society, impacting various aspects of daily life, industry, and the environment. ynthetic fibers are integral to modern life, offering a range of benefits from cost-effectiveness and versatility to innovative applications and performance characteristics. While they pose environmental challenges, ongoing research and development aim to create more sustainable and eco-friendly alternatives. Understanding the importance of synthetic fibers helps in appreciating their role in the economy, industry, and daily life, while also emphasizing the need for sustainable practices and innovation.
Students, digital devices and success - Andreas Schleicher - 27 May 2024..pptxEduSkills OECD
Andreas Schleicher presents at the OECD webinar ‘Digital devices in schools: detrimental distraction or secret to success?’ on 27 May 2024. The presentation was based on findings from PISA 2022 results and the webinar helped launch the PISA in Focus ‘Managing screen time: How to protect and equip students against distraction’ https://www.oecd-ilibrary.org/education/managing-screen-time_7c225af4-en and the OECD Education Policy Perspective ‘Students, digital devices and success’ can be found here - https://oe.cd/il/5yV
2. Chapter 6: Normal Probability Distribution
6.1 The Standard Normal Distribution
6.2 Real Applications of Normal Distributions
6.3 Sampling Distributions and Estimators
6.4 The Central Limit Theorem
6.5 Assessing Normality
6.6 Normal as Approximation to Binomial
2
Objectives:
• Identify distributions as symmetric or skewed.
• Identify the properties of a normal distribution.
• Find the area under the standard normal distribution, given various z values.
• Find probabilities for a normally distributed variable by transforming it into a standard normal variable.
• Find specific data values for given percentages, using the standard normal distribution.
• Use the central limit theorem to solve problems involving sample means for large samples.
• Use the normal approximation to compute probabilities for a binomial variable.
3. Recall: The Standard Normal Distribution
Normal Distribution
If a continuous random variable has a distribution with a graph that
is symmetric and bell-shaped, we say that it has a normal
distribution. The shape and position of the normal distribution
curve depend on two parameters, the mean and the standard
deviation.
SND: 1) Bell-shaped 2) µ = 0 3) σ = 1
3
2 2
( ) (2 )
2
x
e
y
2
1
2
:
2
x
e
OR y
x
z
TI Calculator:
Normal Distribution Area
1. 2nd + VARS
2. normalcdf(
3. 4 entries required
4. Left bound, Right
bound, value of the
Mean, Standard
deviation
5. Enter
6. For −∞, 𝒖𝒔𝒆 − 𝟏𝟎𝟎𝟎
7. For ∞, 𝒖𝒔𝒆 𝟏𝟎𝟎𝟎
TI Calculator:
Normal Distribution: find
the Z-score
1. 2nd + VARS
2. invNorm(
3. 3 entries required
4. Left Area, value of the
Mean, Standard
deviation
5. Enter
4. An estimator is a statistic used to infer (or estimate) the value of a population
parameter.
Unbiased Estimator
An unbiased estimator is a statistic that targets the value of the corresponding
population parameter in the sense that the sampling distribution of the statistic has a
mean that is equal to the corresponding population parameter such as:
Proportion: 𝒑
Mean: 𝒙
Variance: s²
Biased Estimator
These statistics are biased estimators. That is, they do not target the value of the
corresponding population parameter:
• Median
• Range
• Standard deviation s
4
Recall: Sampling Distributions and Estimators
x
z
5. Recall: Central Limit Theorem and the Sampling Distribution 𝒙
A sampling distribution of sample means is a distribution obtained by using the means computed from random samples of a
specific size taken from a population. Sampling error is the difference between the sample measure and the corresponding
population measure due to the fact that the sample is not a perfect representation of the population.
The Central Limit Theorem tells us that for a population with any distribution, the distribution of the sample means
approaches a normal distribution as the sample size increases.
1. The random variable x has a distribution (which may or may not be normal) with mean μ and standard deviation σ.
2. Simple random samples all of size n are selected from the population. (The samples are selected so that all possible samples of
the same size n have the same chance of being selected.)
Conclusion:
1. The distribution of sample 𝑥 will, as the sample size increases, approach a normal distribution.
2. The mean of the sample means is the population mean 𝜇 𝑥 = 𝜇 .
3. The standard deviation of all sample means ( also called the standard error of the mean) is 𝜎 𝑥= 𝜎/ 𝑛
1. For samples of size n > 30, the distribution of the sample means can be approximated reasonably well by a normal distribution.
The approximation becomes closer to a normal distribution as the sample size n becomes larger.
2. If the original population is normally distributed, then for any sample size n, the sample means will be normally distributed (not
just the values of n larger than 30).
Requirements: Population has a normal distribution or n > 30:
5/
x
x
x x
z
n
6. Key Concept:
Determine whether the requirement of a normal distribution is satisfied:
(1) visual inspection of a histogram to see if it is roughly bell-shaped
(2) identifying any outliers; and
(3) constructing a normal quantile plot.
Normal Quantile Plot
A normal quantile plot (or normal probability plot) is a graph of points (x, y)
where each x value is from the original set of sample data, and each y value is the
corresponding z score that is expected from the standard normal distribution.
Recall: 6.5 Assessing Normality
6
(x, y = Z-score)
7. Key Concept:
Use a normal distribution as an approximation to the binomial probability distribution: BD:
n & p⇾ q = 1 − p
if the conditions of np ≥ 5 and nq ≥ 5 are both satisfied, then probabilities from a binomial probability
distribution can be approximated reasonably well by using a normal distribution having these
parameters: 𝜇 = 𝑛𝑝 & 𝜎 = 𝑛𝑝𝑞
The binomial probability distribution is discrete (with whole numbers for the random variable x), but
the normal approximation is continuous. To compensate, we use a “continuity correction” with a
whole number x represented by the interval from x − 0.5 to x + 0.5.
Recall: A binomial probability distribution has
(1) a fixed number of trials;
(2) trials that are independent;
(3) trials that are each classified into two categories commonly referred to as success and failure;
and
(4) trials with the property that the probability of success remains constant.
6.6 Normal as Approximation to Binomial
7
8. Notation
n = the fixed number of trials
x = the specific number of successes in n trials
p = probability of success in one of the n trials
q = probability of failure in one of the n trials (so q = 1 − p)
Rationale for Using a Normal Approximation:
We saw in a previous section that the sampling distribution of a sample proportion
tends to approximate a normal distribution. Also, see the following probability
histogram for the binomial distribution with n = 580 and p = 0.25. (In one of Mendel’s
famous hybridization experiments, he expected 25% of his 580 peas to be yellow, but
he got 152 yellow peas, for a rate of 26.2%.) The bell-shape of this graph suggests that
we can use a normal distribution to approximate the binomial distribution.
6.6 Normal as Approximation to Binomial
8
9. Requirements
1. The sample is a simple random sample of size n from a population in which the proportion of
successes is p, or the sample is the result of conducting n independent trials of a binomial
experiment in which the probability of success is p.
2. np ≥ 5 and nq ≥ 5.
Normal Approximation
If the above requirements are satisfied, then the probability distribution of the random variable x can be
approximated by a normal distribution with these parameters: 𝜇 = 𝑛𝑝 & 𝜎 = 𝑛𝑝𝑞
Continuity Correction
When using the normal approximation, adjust the discrete whole number x by using a continuity correction so that any
individual value x is represented in the normal distribution by the interval from x − 0.5 to x + 0.5.
Procedure:
1. Check the requirements that np ≥ 5 and nq ≥ 5.
2. Find 𝜇 = 𝑛𝑝 & 𝜎 = 𝑛𝑝𝑞
3. Identify the discrete whole number x that is relevant to the binomial probability problem being considered, and
represent that value by the region bounded by x − 0.5 and x + 0.5.
4. Graph the normal distribution and shade the desired area bounded by x − 0.5 or x + 0.5 as appropriate.
6.6 Normal as Approximation to Binomial
9
10. 6.6 Normal as Approximation to Binomial
The Normal Approximation to the Binomial Distribution
Binomial
When finding:
P(X = a)
P(X a)
P(X > a)
P(X a)
P(X < a)
Normal
Use:
P(a – 0.5 < X < a + 0.5)
P(X > a – 0.5)
P(X > a + 0.5)
P(X < a + 0.5)
P(X < a – 0.5)
For all cases, , , 5, 5 np npq np nq
10
11. 11
In one of Mendel’s famous hybridization experiments, he expected that among 580
offspring peas, 145 of them (or 25%) would be yellow, but he actually got 152 yellow
peas. Assuming that Mendel’s rate of 25% is correct, find
a. P(exactly 152 yellow peas).
b. find the probability of getting 152 or more yellow peas by random chance. That is,
given n = 580 and p = 0.25, find P(at least 152 yellow peas).
Example 1
Solution: Given: Binomial Distribution(BD), n = 580 & p = 0.25
np = (580)(0.25) = 145 & nq = (580)(0.75) = 435 ⇾ np ≥ 5 & nq ≥ 5
580(0.25) 145
580(0.25)(0.75)
10.4283
np
npq
, , 5, 5np npq np nq
: ( 152)BD P x
: (151.5 152.5)ND P x
x
z
12. 12
151.5 145
0.62
10.4283
x
z
152.5 145
0.72
10.4283
x
z
0.7642 − 0.7324 = 0.0318: (0.62 0.72)SND P z
b. P(at least 152 yellow peas)
: ( 152)BD P x
: ( 151.5)ND P x
: ( 0.62)SND P z 1 − 0.7324 = 0.2676
14. 14
Assume that 6% of American drivers text while driving. If 300
drivers are selected at random, find the probability that exactly
25 say they text while driving. (Use Normal approximation)
Example 2
Solution: Given: Binomial Distribution(BD), n = 300 & p = 0.06
np = (300)(0.06) = 18 ≥ 5 and nq = (300)(0.94) = 282 ≥ 5
300(0.06) 18
300 0.06 0.94 4.1134
np
npq
, , 5, 5np npq np nq
x
z
: ( 25)BD P x : (24.5 25.5)ND P x
24.5 18 25.5 18
1.58, 1.82
4.11 4.11
z z
0.9656 – 0.9429 = 0.0227: (1.58 1.82)SND P z
15. 15
Of the members of a handball league, 10% are left-handed. If 200 handball league
members are selected at random, find the probability that
a. 10 or more will be left-handed.
b. At most 15 will be left-handed.
Example 3
Solution: Given: Binomial Distribution(BD), n = 200 & p = 0.1
np = (200)(0.10) = 20 and nq = (200)(0.90) = 180 ⇾ np ≥ 5 & nq ≥ 5
200(0.1) 20
200 0.10 0.90 4.24
np
npq
, , 5, 5np npq np nq
: ( 10)BD P x
: ( 9.5)ND P x
x
z
9.5 20
2.48
4.24
z
: ( 2.48)SND P z 1.0000 – 0.0066 = 0.9934
. : ( 15)b BD P x : ( 15.5) ?ND P x
: ( 1.06)SND P z 0.1446