deals with temperature, density, pressure, winds and humidity parameters of the atmosphere; Prssure gradient force, coriolis force, gravity force and friction force and winds and currents, ; pressure lows and highs, atmospheric circulation, winds.
1. Air pressure is caused by the weight of the atmosphere and is exerted in all directions. It is measured using a barometer.
2. Wind is caused by differences in air pressure and is affected by pressure gradients, the Coriolis effect, and friction. Unequal heating of the Earth's surface creates pressure differences.
3. The atmosphere circulates in cells with air rising at the equator and sinking at the poles, driven by pressure and temperature differences. This circulation creates global wind patterns like the trade winds and westerlies.
Wind is caused by differences in air pressure and is responsible for weather patterns globally. The main drivers of wind include solar heating of the atmosphere creating pressure differences, the Coriolis effect which causes winds to bend, and pressure gradient force pushing air from high to low pressure areas. Global wind systems include the trade winds near the equator, the prevailing westerlies in mid-latitudes, and polar easterlies near the poles. Local winds are also influenced by differences in land and sea temperatures.
Fronts are boundaries between two air masses of differing characteristics. There are four main types of fronts: cold fronts, warm fronts, occluded fronts, and stationary fronts. Cold fronts are steep boundaries where cold air overrides warm air, bringing precipitation. Warm fronts are more gradual, with light, continuous precipitation as warm air rises over cold air. Occluded fronts occur when a cold front catches up to a warm front. Stationary fronts have little or no movement as the air masses are parallel.
The document discusses air masses and fronts. It defines air masses as large bodies of air with uniform properties that form over land or water surfaces. There are four main types of air masses classified by their region of formation: maritime/continental and polar/tropical. Fronts are boundaries between unlike air masses. There are three main types of fronts: cold fronts, where cold air overtakes warm air; warm fronts, where warm air overtakes cold air; and occluded fronts, where a warm air mass is overtaken by two cooler air masses.
The document discusses different types of winds and how they are caused. It explains that temperature variations between different regions of the Earth due to uneven heating from the sun lead to differences in air pressure and the formation of wind. Winds blow in three main circulation cells in each hemisphere - Hadley, Ferrel, and polar cells - helping to transport heat from the equator to poles. Primary winds include trade winds and westerlies that blow throughout the year between latitudes. Secondary winds change seasonally, like land and sea breezes. Local winds are influenced by local geographic features. Aeolian processes refer to how wind erosion, transportation, and deposition can shape the Earth's surface over time.
The solar radiation that reaches Earth is the primary energy source that drives atmospheric and oceanic circulation systems and the hydrologic cycle. Most of the radiation emitted from the sun is in the visible spectrum. While some solar radiation is reflected or scattered by gases, particles, and surfaces like clouds, ice, and snow, most is absorbed by Earth and its atmosphere. This absorbed solar energy is then re-radiated as terrestrial radiation and helps maintain the planet's heat balance.
The document discusses jet streams, which are narrow bands of strong winds found in the westerlies in the upper atmosphere. There are typically two jet streams in each hemisphere - a polar jet around 30-60°N and a subtropical jet around 20-30°N. Jet streams form due to temperature differences between air masses and can reach speeds of over 200 knots, influencing global weather and being an important factor for transcontinental flight planning.
1) Global atmospheric circulation patterns are driven by differences in air pressure, temperature, and density that produce wind flows from high to low pressure areas.
2) Major global circulation cells include the Hadley cell and polar cell systems, as well as jet streams and Rossby waves that transport air and influence weather patterns.
3) Local winds form due to differences in land-sea heating and terrain, and include sea/land breezes, downslope/upslope winds, monsoon patterns, and more.
Structure and Composition of the Atmospherebeaudry2011
The atmosphere is composed of gases, water droplets, and particles surrounding Earth. It has four main layers - the troposphere, stratosphere, mesosphere, and thermosphere - each decreasing or increasing in temperature with altitude. The troposphere is where weather occurs, extending 8-16km high. Above is the stratosphere where temperatures increase with little weather, then the mesosphere where temperatures decrease again up to 80km. The thermosphere is the outermost layer with increasing temperatures from 80km high. The atmosphere composition consists primarily of nitrogen, oxygen, argon, and trace gases. Water vapor is the most abundant variable gas.
Oceans are a vast body of salt water that covers almost three to fourths of the earth's surface.
Seas are smaller, found on the margins of the ocean and are partially enclosed by land.
Seawater:
High density, high heat capacity, colder, salty and slightly compressible (its volume decreases under pressure), thus its density increases with pressure.
Why is Ocean Circulation Important?
•Similar to winds in the atmosphere, they transfer significant amounts of heat from equatorial areas to the poles and thus play important roles in determining the climates of coastal regions.
•The ocean circulation pattern exchanges water of varying characteristics, such as temperature and salinity
•ocean currents and atmospheric circulation influence one another.
•in addition, they transport nutrients and organisms
1. The document discusses key concepts about Earth's atmosphere including how solar radiation drives global climate and local weather patterns.
2. It explains different climate types based on factors like latitude, proximity to bodies of water, and elevation. Humid climates receive more precipitation than potential evapotranspiration while arid climates experience the opposite.
3. Atmospheric circulation patterns like global wind belts and ocean currents play an important role in moderating Earth's climate by transporting heat energy from the tropics to poles and distributing it around the globe over long time periods.
Air can flow when there are differences in temperature and pressure conditions. It helps study variations in the atmosphere. Large masses of air with uniform temperature and humidity properties are called air masses. They start flowing from source regions and help study cyclones and anticyclones. The contact line between different air masses is called a front, which can be a warm front when warm air moves over cold air, or a cold front when cold air moves over warm air. Cyclones are areas of low pressure surrounded by high pressure, while anticyclones are areas of high pressure surrounded by low pressure. Tropical cyclones are circular over seas in summer, while extra-tropical or temperate cyclones are V-shaped over land
Cyclones involve a closed circulation around a low pressure center, spinning counterclockwise in the Northern Hemisphere. They bring strong winds inward and cause extensive damage from heavy rain. Cyclones are known by different names depending on location, such as hurricanes in the Atlantic and typhoons in the Western Pacific. Anticyclones circulate clockwise around a high pressure center, pushing winds outward and typically bringing fine weather. Key differences between cyclones and anticyclones are the direction of circulation and associated weather patterns.
This document discusses air masses and fronts. It defines air masses as large bodies of air that extend thousands of kilometers and have uniform temperature and humidity. Air masses form over source regions and are classified as either tropical or polar, and continental or maritime. Fronts occur at the boundary between differing air masses and can be cold, warm, stationary or occluded fronts. Each front type brings characteristic weather conditions from rain to thunderstorms as the warmer air is displaced.
The Köppen Climate Classification System categorizes climates into five main groups - A, B, C, D, and E - based on annual and monthly patterns of temperature and precipitation. Group A refers to tropical climates with high temperatures year-round. Group B includes dry climates with low precipitation. Group C covers mild and humid mid-latitude climates. Group D comprises climates with cold winters. Group E represents polar climates with extremely cold temperatures. Each group has several minor subtypes defined by specific characteristics of temperature and rainfall.
Temperature is a measure of the average kinetic energy of particles in a substance. It is expressed on comparative scales like Celsius, Fahrenheit and Kelvin. Thermometers use materials like mercury that expand with increasing heat to measure temperature. Temperature inversions occur when warm air is above cooler air near the surface, trapping pollutants. Inversions impact air quality by preventing the dispersion of pollution. Clouds also impact temperature by reflecting sunlight to lower maximum temperatures while trapping heat at night to raise minimums.
The Inter Tropical Convergence Zone (ITCZ) is a low pressure belt that circles the Earth near the equator, where the trade winds of the northern and southern hemispheres meet. It is characterized by convective thunderstorm activity and varies in position seasonally, tracking the sun's zenith point and being more prominent over land than water. The ITCZ generates the wettest weather around the equator through the year and can propagate several hundred miles north or south depending on the hemisphere and season.
This document discusses cloud formation and types of clouds. It presents that clouds are formed through convection as warmer air rises and cools, causing water vapor to condense into liquid droplets or ice crystals. Clouds are classified into high, middle, and low-level clouds based on their height and composition. Factors like surface heating, topography, fronts, convergence, and turbulence can influence cloud formation. Clouds impact the environment by regulating temperature through reflection and absorption of heat and enabling precipitation through the water cycle.
Horizontal Distribution & Differences of Temperature discusses how several factors influence the horizontal and latitudinal distribution of temperatures around the Earth. Some of the key factors discussed include:
1. Latitudinal variations in solar radiation, which causes temperatures to decrease with increasing latitude away from the equator.
2. The mosaic of land and ocean surfaces, which disrupts the strict latitudinal zonation of temperatures. Proximity to oceans moderates temperatures.
3. Altitude, with temperatures decreasing about 6.5°C for every 1000m increase in elevation due to thinner air.
4. Cloud cover, which influences the difference between day and night temperatures through absorption and reflection of radiation.
Winds are caused by differences in air pressure due to uneven heating of the atmosphere. Global wind patterns form large convection cells that circulate air from the equator to the poles. Local winds include sea breezes and land breezes, which occur when air over land or water is heated and cooled more quickly than the adjacent surface, causing pressure differences and winds to flow from the cooler to warmer surface during the day and night.
The document discusses climate classification systems, focusing on the Koeppen system which categorizes climates based on temperature and precipitation patterns. It examines the major climate types like tropical wet/dry, dry, mesothermal, microthermal, and polar climates. The document also covers topics like the hydrologic cycle, soil moisture, groundwater resources, water usage, and potential impacts of climate change.
The earth is the only known planet, on which life exists. The present condition and properties of earth’s atmosphere are one of the main reasons for earth to support life. The atmosphere is the blanket of gases or vapours that surrounds the earth, and held together by the force of gravity.
This document discusses various aspects of the water cycle and atmospheric water. It describes how snow, ice, rain, clouds, and water vapor influence weather and the atmosphere. It provides details on evaporation, transpiration, condensation, cloud formation, precipitation, humidity variables, and atmospheric stability. The key points are:
- Atmospheric water amounts to 3100 cubic miles and the earth's average annual rainfall is about 100 cm.
- Water turnover time in the atmosphere is approximately 10 days.
- Clouds form when rising air parcels reach their dew point due to cooling and condensation occurs.
- Atmospheric stability determines whether air parcels can rise to form clouds or remain stable.
Solid waste bio-methanation plants use anaerobic digestion to stabilize the biodegradable waste fraction and produce biogas. There are two types of digesters: wet digesters which use a liquid slurry system, and dry digesters which process higher consistency waste without water addition. The digestion process involves four stages - hydrolysis, acidogenesis, acetogenesis, and methanogenesis - with acid-forming and methane-forming bacteria and archaea working together to break down organic matter into biogas and digestate. Nutrients and optimal temperature and pH levels must be maintained for the microbes to function effectively in the anaerobic treatment process.
Regulatory Requirements of Solid Waste Management, Indian ContextAkepati S. Reddy
The document discusses the regulatory requirements for solid waste management in India. It outlines the various rules and laws governing plastic waste, e-waste, biomedical waste, construction waste, and other hazardous wastes. It also describes the duties and responsibilities of various stakeholders in the waste management process like local authorities, pollution control boards, waste generators, and transport and processing facilities. Finally, it provides details on proper waste handling, segregation, storage, collection, transportation, processing, and disposal in accordance with the Solid Waste Management Rules of 2016.
The document discusses various types of scrubbing systems used to remove particulate and gaseous pollutants from exhaust gases. It describes venturi scrubbers, orifice scrubbers, plate towers, spray towers, baffled spray scrubbers, cyclonic spray scrubbers, and packed tower scrubbers. Venturi scrubbers use high gas velocities to atomize liquid droplets and can achieve over 90% particle collection efficiency. Plate towers and packed towers are effective at removing gaseous pollutants due to long contact times between the gas and liquid phases. The document provides details on the operation, advantages, and maintenance considerations of different scrubbing technologies.
Air pressure refers to the weight of the air pressing down on the Earth's surface, which can be measured using a barometer. Low air pressure typically brings cloudy, stormy weather while high pressure usually results in good weather. Air pressure is equal both inside and outside the body, so we don't feel its effects. Understanding air pressure allows one to predict weather patterns by reading a barometer.
Air pressure is caused by air particles constantly moving and colliding with surfaces. It presses down on everything from above and its strength decreases with increasing altitude as there is less air. Many tools like syringes and sprayers use air pressure principles in their functions. Safety measures must be followed when working with pressurized gases.
Atmospheric pressure is the force exerted by the weight of air in the atmosphere. It affects objects in several ways: by applying a force to still or moving objects which can change their direction or shape; by soaking objects placed vertically in mud more than horizontally due to differences in surface area; and by being measured as pressure, which is force per unit area. Atmospheric pressure decreases with increasing altitude and changes over time and location, resulting in winds like sea breezes and land breezes.
Circulation activities in tertiary institutions in nigeriaAlexander Decker
This document discusses circulation activities at the Yaba College of Technology Library in Nigeria. It describes the processes for registering different types of library users including students, staff, and external researchers. It also outlines the procedures for charging, renewing, and discharging library materials. Key aspects of the circulation desk services are maintaining user records and statistical data on items borrowed and returned. The efficient management of circulation activities is important for promoting library services and resources.
This document summarizes a series of experiments conducted by students to learn about the properties of water. The experiments demonstrated that: 1) Water vapor condenses from the air onto cold surfaces; 2) Some materials are absorbent while others are waterproof; 3) Liquid water evaporates into water vapor; 4) Salt lowers the freezing point of water; 5) Hot water is less dense and floats above cold water; 6) Salty water is denser than fresh water; and 7) Adding soap decreases the surface tension of water, allowing for giant bubbles to form. The students found water to be an amazing substance and look forward to continuing their investigation with partners from other schools.
The document provides instructions for making a hot air balloon out of tissue paper over several days. It discusses the history of ballooning from the 18th century experiments of the Montgolfier brothers to modern uses. The steps include planning colors, tracing and cutting gore panels, gluing the panels together to form the balloon shape, attaching a bailing wire hoop at the bottom for stability, and hanging the balloon to test lift-off. A group contract and calendar are also included to manage the multi-day project.
Bernoulli's principle states that as the speed of a fluid increases, the pressure within the fluid decreases. This principle explains several phenomena including how airplanes are able to fly and how carburetors work. Specifically, the principle explains that the faster moving air over the top of an airplane's wing has lower pressure than the slower moving air underneath, creating an upward lift force. It also explains how the high speed gas flowing from a Bunsen burner nozzle creates a region of low pressure that draws in surrounding air.
This document summarizes experiments conducted by children ages 5 to 7 about the properties of water. The children made predictions about water and recorded their observations and discoveries in worksheets. Some of their predictions were correct and some were incorrect. The experiments explored states of water, floating and sinking, mixing materials in water, and the difference between fresh water and salty water.
This document discusses atmospheric pressure and how it is measured. It defines atmospheric pressure as the force per unit area exerted by the entire air mass above a specified surface. Atmospheric pressure can be measured using a mercury barometer or an aneroid barometer. It describes how pressure decreases with increasing altitude and discusses standard atmospheric pressure units and how pressure varies globally and with weather patterns.
How do scientists predict weather (the whole lesson )nermine_ghis
Isobars are lines connecting areas with equal air pressure on weather maps. They indicate wind patterns, with closer lines showing higher winds. Low pressure systems have decreasing pressure towards their center and are associated with clouds and rain. High pressure systems have higher pressure at their center and fair weather. Isobars provide information about current and expected weather conditions.
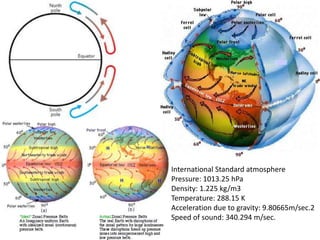
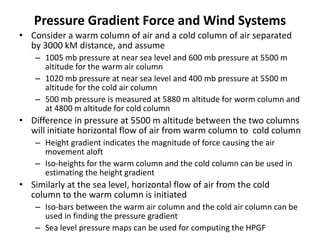
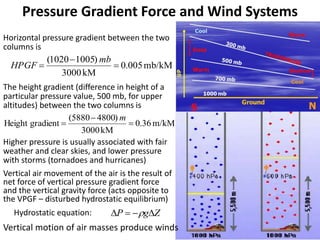
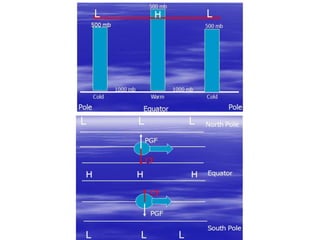
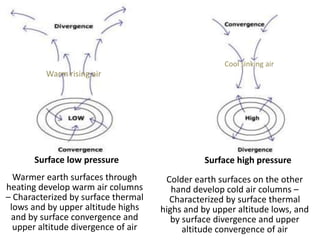
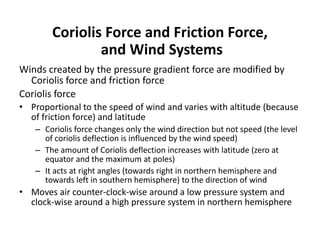
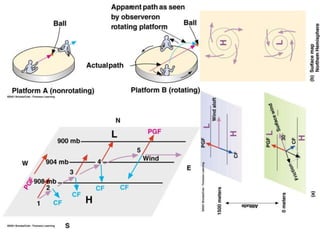
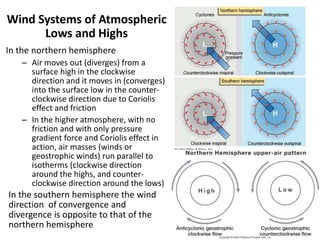
The document discusses atmospheric pressure and how it is caused by the weight of air above the Earth's surface. It explains that atmospheric pressure decreases with increasing altitude as there is less air above. Instruments like mercury barometers, aneroid barometers, and manometers can be used to measure atmospheric pressure. Gas pressure inside a container is also explained using kinetic molecular theory, where gas molecule collisions with the container walls exert pressure.
The plastic bottle was sealed at an altitude of 14,000 feet and crushed when it reached 9,000 feet, indicating that atmospheric pressure is higher at lower altitudes and lower at higher altitudes. Atmospheric pressure decreases with increasing altitude because there is less air and oxygen above ground level, so places at sea level have higher pressure than places at higher elevations.
1) Radiation transfers heat through electromagnetic waves without a medium and travels at the speed of light. The amount radiated and wavelengths depend on an object's temperature according to Stefan-Boltzmann and Planck's laws.
2) Solar radiation reaches Earth's surface through reflection, scattering, absorption and transmission in the atmosphere. Gases like ozone and oxygen absorb most harmful UV rays while scattering by air molecules causes blue skies.
3) On Earth's surface, radiation is mostly absorbed and re-emitted, with some reflected depending on surface albedo. The atmosphere emits terrestrial radiation both upwards, lost to space, and downwards to the surface.
1) A planet's atmosphere is determined by its gravity - large planets with strong gravity can hold thicker atmospheres than low-mass planets with weak gravity.
2) Atmospheric pressure depends on the thickness of the atmosphere, which is influenced by a planet's gravity. Stronger gravity holds more gas and increases atmospheric pressure.
3) On Earth, atmospheric pressure is measured using barometers like mercury barometers invented by Torricelli, and aneroid barometers which indicate pressure changes using mechanical means without toxic materials. Atmospheric pressure decreases with increasing elevation and a falling barometer often signals approaching low pressure weather systems.
This document discusses the temporal and spatial variation of temperature and pressure on Earth. It begins with basics on temperature scales and how temperature decreases with altitude and increases with height, known as lapse rate. Factors like latitude, altitude, land/water distribution, and winds affect temperature variation across locations. Temperature ranges from highest at equator to lowest at poles. Pressure also decreases with height due to gravity and air compressibility. Global pressure belts include tropical lows and high and polar zones. Both temperature and pressure exhibit daily, seasonal and annual cycles over time.
This document provides an overview of atmospheric pressure and how it varies with height, location, time of day, and season. It discusses that pressure decreases with increasing height due to lower air density. Horizontally, pressure varies with temperature, latitude, and land/sea distribution, forming belts of high and low pressure. Diurnally, pressure shows two highs and lows as air expands and contracts. Seasonally, pressure varies more in tropical regions due to changes in solar heating. Isobars on maps connect places of equal pressure, and their spacing indicates the rate of pressure change.
This document defines meteorological terms and describes the vertical structure of Earth's atmosphere. It discusses:
1. The layers of the atmosphere including the troposphere, stratosphere, and mesosphere. The troposphere is where weather occurs and has decreasing temperature with altitude.
2. The boundary layer, a sublayer of the troposphere directly influenced by surface friction and turbulence.
3. Temperature and pressure decrease logarithmically with altitude. Horizontal gradients are generally much smaller than vertical gradients.
4. Time is usually reported in UTC and units include Kelvin, Celsius, Fahrenheit for temperature and millibars, Pascals for pressure.
The document discusses global patterns of climatic elements like solar energy and temperature. It explains that solar insolation is controlled by factors like sun angle, day length, cloud cover, and surface albedo. Land areas generally receive more solar energy than adjacent bodies of water. Horizontal temperature patterns are influenced by sun angle, land-sea contrasts, ocean currents, elevation, albedo effects, and atmospheric circulation. Isotherms on maps will shift equatorward over cold surfaces and poleward over warm surfaces.
This document discusses key concepts about the atmosphere and factors that influence weather and climate. It describes the main components of the atmosphere including nitrogen, oxygen, water vapor, carbon dioxide and ozone. It explains how solar radiation interacts with different layers of the atmosphere and Earth's surface. Key factors that determine climate patterns such as latitude, proximity to bodies of water, altitude, wind currents and cloud cover are also summarized. The greenhouse effect and how atmospheric gases regulate Earth's temperature are briefly explained.
AIR POLLUTION CONTROL course material by Prof S S JAHAGIRDAR,NKOCET,SOLAPUR for BE (CIVIL ) students of Solapur university. Content will be also useful for SHIVAJI and PUNE university students
This document provides information about weather and climate elements such as temperature, humidity, clouds, rainfall, and pressure and winds. It discusses factors that affect temperature like latitude, altitude, distance from the sea, and cloud cover. It also explains concepts such as relative humidity, cloud formation, convectional and relief rainfall, land and sea breezes, and monsoon winds. Students are prompted to think about questions related to these topics and provided exercises to reinforce their understanding.
The document discusses the key components and layers of the Earth's atmosphere. It notes that the atmosphere begins at the planet's surface and extends upwards approximately 1,000 km. It is composed primarily of oxygen, nitrogen, and other gases like argon and carbon dioxide. The atmosphere protects the Earth from the sun's rays and weather phenomena occur in its lower layers. It then provides more details on the specific atmospheric layers including the troposphere, stratosphere, mesosphere, thermosphere, and exosphere.
This document provides an overview of climate modeling lectures, including 4 chapters on the global climate system, basics of climate change, climate modeling, and practicals. It discusses key concepts like the difference between weather and climate, components of the climate system including the atmosphere, oceans, land surface, cryosphere, and biosphere. Specific topics covered include the composition and layers of the atmosphere, atmospheric absorption spectrum, ocean basins and characteristics, stratification of the different atmospheric layers, and landcover categories. The overall goal is to familiarize students with climate science and enable them to understand, analyze, and process climate model outputs.
This presentation contains
i. Wind Science and its Measurement
ii Wind Measurement Tools
iii. Mathematical Background of Theoretical Power Limits of Wind Energy Extraction
iv. Wind Turbines
The document discusses the composition, structure, and properties of Earth's atmosphere. It describes how the atmosphere forms the basis of weather and climate. Weather is defined as short-term atmospheric conditions averaged over days, while climate refers to averaged conditions over decades. The atmosphere is composed primarily of nitrogen, oxygen, and argon. It also contains greenhouse gases like carbon dioxide and water vapor that trap heat and influence Earth's temperature. Solar energy interacts with the atmosphere through reflection, absorption, and the greenhouse effect. Uneven heating of the atmosphere due to Earth's tilted axis drives global wind patterns and local breezes that influence weather conditions around the world.
This document discusses habitat technology and climatology. It begins by defining climatology and habitat engineering. It then covers different climate factors like solar radiation, temperature, humidity, winds and precipitation. It discusses different types of winds like local winds, trade winds and monsoons. It also covers micro and macro climate, and factors that affect site climate like vegetation and urbanization. Finally, it discusses concepts of sustainable development and sustainable materials.
This document summarizes key concepts about solar and terrestrial radiation, including:
- Solar radiation is energy from the sun, while terrestrial radiation is energy reflected back from Earth.
- Radiation can be direct, diffuse after scattering, or reflected. Some is absorbed by the atmosphere or Earth's surface.
- The reflectivity of surfaces like snow, sand, forests and grasslands affects how much radiation is reflected.
- Daily temperature cycles are driven by variations in net radiation from changes in solar insolation over 24 hours.
Tropospheric Zonal Wind And Temperature Profiles.pptxMihirDasgupta1
A brief examination of the thermal tropospheric profile.
The PPT specifically discusses zonal wind, temperature, meridional wind, wind anomalies, and thermal wind. Figures made using NOAA data.
Mentions to matrix calculations/data scraping techniques also included.
The document summarizes key aspects of Earth's atmosphere including its composition, structure, and the water and wind patterns within it. It notes that nitrogen and oxygen make up most of the atmosphere and describes the nitrogen, oxygen, water, and carbon dioxide cycles. It explains the varying temperature and density of the atmosphere from Earth's surface to the exosphere. Key points include the greenhouse effect, evaporation and condensation processes, dew point, fog and cloud formation, and global wind patterns driven by differential heating.
The document is a chapter from a textbook on meteorology. It introduces key concepts and variables studied in meteorology, including weather, climate, temperature, pressure, water in the atmosphere, clouds, precipitation, and the seasons. It explains that meteorology is the scientific study of the atmosphere and its processes, while climatology specifically studies climate over long time periods.
This document discusses the atmosphere and factors that influence weather and climate. It covers topics like meteorology, the greenhouse effect, how solar radiation heats the atmosphere, controls of temperature including latitude, elevation, proximity to water, and ocean currents. Seasonal changes are caused by variations in the Earth's axial tilt and elliptical orbit around the sun. Temperature is also influenced by factors like the amount of water vapor, whether a region is arid or humid, and its geographic position relative to prevailing wind patterns.
General Atmospheric
Circulation
Unit 6b
General Circulation of the Atmosphere
• Single-cell model (Hadley, 1735)
• Assumes:
– non-rotating earth
– uniform surface
• Low Pressure at Equator (warm air rising)
• High Pressure at Poles (cold air sinking)
• Creates a thermal convection cell
Three Cell Model
• Due to earth’s rotation and other
dynamic factors there are typically 3
primary cells
– Hadley Cell (tropics)
– Midlatitude Cell (Ferrel)
– Polar Cell (polar zones)
Three Cell Model
Hadley Cell
Primary High & Low Pressure Areas
Equatorial Low Pressure (ITCZ)
Subtropical High Pressure
Subpolar Low Pressure
Polar High Pressure
Equatorial Low Pressure
Intertropical Convergence Zone (ITCZ)
±10° N & S
Thermally-induced low pressure
Clouds and rain
Limited wind (doldrums)
Seasonal shift N-S
Subtropical High Pressure
• Dynamic high pressure
– subsiding air of Hadley Cell
– between 20° - 35° N & S
• Creates hot, dry air
– Clear skies, limited wind (horse latitudes)
– e.g., Bermuda High, Hawaiian High
• Strengthen/weaken seasonally
• Shift N & S with sun’s declination
Subpolar Low Pressure
• Dynamic low pressure
– air forced to rise
– along polar front
• Cool, moist, cloudy
• Frequent cyclonic storms
– e.g., Aleutian Low, Icelandic Low
• strengthen/weaken seasonally
General Circulation
(Side-View)
General Circulation – Surface Winds
Trade Winds (tropical)
Westerlies (midlatitudes)
Polar Easterlies
Trade Winds
Trade Winds (tropical)
– from subtropical highs to equatorial lows
– northeast trades & southeast trades
Westerlies
Westerlies (midlatitudes)
– from the subtropical highs to the subpolar lows (west à
east)
– tend to be wavy (meridional flow)
Polar Easterlies
Polar Easterlies
– from polar highs to subpolar lows
– variable, cold, dry winds
www.atmo.arizona.edu
General Circulation – Upper Air Flow
(geostrophic winds)
• Westerlies
– subtropics à poles
– occur as Rossby Waves Jet Streams
– areas of high wind velocity within the westerlies
• Subtropical Jet
– 20° - 50° N & S
– 10,000 – 15,000 m
• Polar Jet
– 30° - 70° N & S
– 8,000 – 12,000 m
Jet Stream
Rossby Waves
http://svs.gsfc.nasa.gov/vis/a010000/a0
10900/a010902/
http://www.geography.hunter.cuny.edu/tbw/wc
.notes/7.circ.atm/rossby_waves.htm
Local and Regional Winds
Ocean Circulation
Unit 6c
Local and Regional Winds
Land/Sea Breeze
Mountain/Valley Breeze
Katabatic Winds
Compressional Winds
Monsoons
Land/Sea Breeze
• thermal circulation
• best developed in summer
• land heats up during day, creates relative low
pressure forming sea breeze
• land cools off at night creates relative high pressure
forming land breeze
Mountain/Valley Breeze
• thermal circulation
• best developed in summer
• slopes heat up during the day causing an upslope
wind (valley breeze)
• slopes cool off at night causing a downslope wind
(mountain breeze)
Katabatic Wind
Cold downslope wind
cold air = greater densit ...
This document defines and describes various types of suspended solids and organic matter that are measured in wastewater treatment. It discusses total suspended solids (TSS), volatile suspended solids (VSS), biodegradable VSS, settleable solids, fixed suspended solids, and colloidal solids. It also covers measurements of organic matter including total organic carbon (TOC), theoretical oxygen demand (ThOD), chemical oxygen demand (COD), biochemical oxygen demand (BOD), and BOD kinetics. The document provides details on procedures for measuring these parameters, including the use of filters, ignition, centrifugation, Imhoff cones, and demand tests.
Total suspended solids (TSS), volatile suspended solids (VSS), and biochemical oxygen demand (BOD) are key parameters used to analyze wastewater and biosolids. TSS is determined by filtering a sample and weighing the solid residue, while VSS is the weight loss when ignited at 550°C. The sludge volume index (SVI) measures sludge settling characteristics important for activated sludge process design and operation. Colloidal solids cause turbidity which is removed through bioflocculation in biological treatment.
The document discusses characterization and measurement of sewage flow. It describes parameters used to characterize sewage such as flow rate, solids, organic matter, nutrients, biological quality, pH and more. Methods of measuring flow rate discussed include differential pressure meters, velocity meters, positive displacement meters, and open channel meters. Specific flow meter types are then defined and explained such as venturi meters, orifice plates, electromagnetic and ultrasonic flow meters, weirs and more. Equations for calculating flow using various meter types are also provided.
This document discusses various types of flow meters used to measure flow in pipes and open channels. It begins by explaining why flow measurement is important, such as to quantify water and wastewater flows, facilitate proportionate sampling, and determine treatment plant and chemical dosage sizes. The document then covers basic requirements of flow meters and various technologies, including differential pressure, velocity, positive displacement, and mass flow meters. It also discusses open channel flow measurement using weirs and flumes.
This document discusses various forms of nitrogen and phosphorus found in water samples and their analysis methods. It describes:
1) The different forms of nitrogen including total Kjeldahl nitrogen (TKN), which is the sum of organic nitrogen and ammonia nitrogen.
2) Methods for analyzing ammonia nitrogen including distillation, Nesslerization, and titration. Organic nitrogen is measured after converting it to ammonia through digestion.
3) The Kjeldahl method for determining TKN which involves sample digestion using sulfuric acid and a catalyst to convert organic nitrogen to ammonia, followed by distillation and ammonia measurement.
This document describes the MPN (Most Probable Number) test for testing biological water quality and detecting the presence of fecal contamination and pathogens. It involves testing for the indicator organism E. coli using a multiple tube fermentation technique with three phases - presumptive, confirmed, and completed tests. Samples are collected and stored properly then inoculated into lactose broth tubes at serial dilutions and incubated to detect coliform growth. Positive tubes are then tested with BGLB/MacConkey broth and EC/A1 broth to confirm total and fecal coliforms, respectively. Definitive identification involves plating and gram staining from positive confirmed tubes.
The document discusses preliminary treatment units for sewage treatment plants, focusing on bar screens and grit separators. It provides details on the components, design considerations, and operating principles of bar screens including bar rack specifications, head loss calculations, and screen classifications. It also covers grit chamber types, Stoke's law for particle settling velocities, discrete particle settling calculations, and design of horizontal flow grit channels. Key aspects addressed are screen approach channel design, screen raking mechanisms, and grit removal to protect equipment from abrasion.
This document summarizes secondary treatment, which involves the biological removal of biodegradable organic matter from wastewater. It focuses on the activated sludge process (ASP), the most commonly used secondary treatment technique. The ASP uses microbes to convert soluble organic matter into biological flocs that are then removed. Key components of the ASP include an aeration basin for treatment and a secondary clarifier for solids separation. The document also discusses the mechanisms, kinetics, design considerations, and equations for calculating parameters like effluent quality and sludge production rates in the ASP.
The document discusses characterization and measurement of sewage flow. It describes parameters used to characterize sewage such as flow rate, solids, organic matter, nutrients, biological quality, pH and more. Methods of measuring flow rate discussed include differential pressure meters, velocity meters, positive displacement meters, and open channel measurement using weirs and flumes. Key flow meter types are also summarized such as orifice plates, venturi meters, turbine meters, electromagnetic meters and ultrasonic meters.
The document summarizes the activated sludge process for aerobic biological wastewater treatment. It describes the basic concepts, components, and operating principles of the activated sludge system. The key components include the aeration tank, secondary sedimentation tank, recycling system, and surplus sludge treatment. The document also discusses the characteristics of activated sludge, including its physical properties, composition, microorganisms, and performance indicators like MLSS, MLVSS, sludge volume index. It provides operational parameters for evaluating the organic loading rate and sludge loading rate of the aeration tank.
This document provides information about the activated sludge process for wastewater treatment. The activated sludge process uses microorganisms and oxygen to biologically treat wastewater. Microorganisms consume organic matter in the wastewater to grow, reproducing and removing pollutants through metabolic processes. Key components of an activated sludge system include the aeration tank where microorganisms and wastewater are mixed with air, and the secondary clarifier where microorganisms are separated from treated water. The food to microorganism ratio (F:M ratio) is important to balance to maintain effective treatment. Calculations are provided to determine pounds of biochemical oxygen demand (BOD), mixed liquor suspended solids (MLSS),
Deals with the biological removal of nitrogen and phosphorus, Nitrification-denitrification removal of nitrogen, and Phosphate accumulating organisms and poly-hydroxibutirate in the phosphorus removal.
This document provides information on aerobic attached growth systems, specifically trickling filters. Key points include:
- Trickling filters are fixed film bioreactors that use media like rock or plastic to develop biofilms, treating wastewater as it trickles through the media.
- Wastewater flows over the biofilms, exposing them alternately to wastewater and air to facilitate treatment.
- Design considerations include media type, wastewater distribution, ventilation, and secondary clarification after treatment.
- Empirical equations are provided to help design trickling filters based on parameters like organic loading, temperature, media characteristics, and wastewater flow.
Deals with primary sedimentation tanks for the primary treatment of sewage. settling column test, settling profile graph construction and use of the settling profile graph for the design of primary sedimentation tank. both circular and rectangular settling tanks are described here.
Deals with UASB reactors for the primary treatment of sewage, stabilization of sludge and removal of BOD. Various components of a UASB reactor are described and design details are included. Modifications to UASB such as UASB ponds, Anaerobic baffle reactors, migrating blanket reactors are also described here.
Deals anaerobic ponds for the primary treatment of sewage, stabilization of the settled sludge and BOD removal. It also includes design and physical design of the anaerobic ponds.
Deals with what is activated sludge, mechanisms and kinetics of treatment, design of activated sludge process, secondary clarifiers and their design and bulking sludge, raising sludge and foaming of ASP.
Evolving Lifecycles with High Resolution Site Characterization (HRSC) and 3-D...Joshua Orris
The incorporation of a 3DCSM and completion of HRSC provided a tool for enhanced, data-driven, decisions to support a change in remediation closure strategies. Currently, an approved pilot study has been obtained to shut-down the remediation systems (ISCO, P&T) and conduct a hydraulic study under non-pumping conditions. A separate micro-biological bench scale treatability study was competed that yielded positive results for an emerging innovative technology. As a result, a field pilot study has commenced with results expected in nine-twelve months. With the results of the hydraulic study, field pilot studies and an updated risk assessment leading site monitoring optimization cost lifecycle savings upwards of $15MM towards an alternatively evolved best available technology remediation closure strategy.
Climate Change All over the World .pptxsairaanwer024
Climate change refers to significant and lasting changes in the average weather patterns over periods ranging from decades to millions of years. It encompasses both global warming driven by human emissions of greenhouse gases and the resulting large-scale shifts in weather patterns. While climate change is a natural phenomenon, human activities, particularly since the Industrial Revolution, have accelerated its pace and intensity
Microbial characterisation and identification, and potability of River Kuywa ...Open Access Research Paper
Water contamination is one of the major causes of water borne diseases worldwide. In Kenya, approximately 43% of people lack access to potable water due to human contamination. River Kuywa water is currently experiencing contamination due to human activities. Its water is widely used for domestic, agricultural, industrial and recreational purposes. This study aimed at characterizing bacteria and fungi in river Kuywa water. Water samples were randomly collected from four sites of the river: site A (Matisi), site B (Ngwelo), site C (Nzoia water pump) and site D (Chalicha), during the dry season (January-March 2018) and wet season (April-July 2018) and were transported to Maseno University Microbiology and plant pathology laboratory for analysis. The characterization and identification of bacteria and fungi were carried out using standard microbiological techniques. Nine bacterial genera and three fungi were identified from Kuywa river water. Clostridium spp., Staphylococcus spp., Enterobacter spp., Streptococcus spp., E. coli, Klebsiella spp., Shigella spp., Proteus spp. and Salmonella spp. Fungi were Fusarium oxysporum, Aspergillus flavus complex and Penicillium species. Wet season recorded highest bacterial and fungal counts (6.61-7.66 and 3.83-6.75cfu/ml) respectively. The results indicated that the river Kuywa water is polluted and therefore unsafe for human consumption before treatment. It is therefore recommended that the communities to ensure that they boil water especially for drinking.
Optimizing Post Remediation Groundwater Performance with Enhanced Microbiolog...Joshua Orris
Results of geophysics and pneumatic injection pilot tests during 2003 – 2007 yielded significant positive results for injection delivery design and contaminant mass treatment, resulting in permanent shut-down of an existing groundwater Pump & Treat system.
Accessible source areas were subsequently removed (2011) by soil excavation and treated with the placement of Emulsified Vegetable Oil EVO and zero-valent iron ZVI to accelerate treatment of impacted groundwater in overburden and weathered fractured bedrock. Post pilot test and post remediation groundwater monitoring has included analyses of CVOCs, organic fatty acids, dissolved gases and QuantArray® -Chlor to quantify key microorganisms (e.g., Dehalococcoides, Dehalobacter, etc.) and functional genes (e.g., vinyl chloride reductase, methane monooxygenase, etc.) to assess potential for reductive dechlorination and aerobic cometabolism of CVOCs.
In 2022, the first commercial application of MetaArray™ was performed at the site. MetaArray™ utilizes statistical analysis, such as principal component analysis and multivariate analysis to provide evidence that reductive dechlorination is active or even that it is slowing. This creates actionable data allowing users to save money by making important site management decisions earlier.
The results of the MetaArray™ analysis’ support vector machine (SVM) identified groundwater monitoring wells with a 80% confidence that were characterized as either Limited for Reductive Decholorination or had a High Reductive Reduction Dechlorination potential. The results of MetaArray™ will be used to further optimize the site’s post remediation monitoring program for monitored natural attenuation.
ENVIRONMENT~ Renewable Energy Sources and their future prospects.tiwarimanvi3129
This presentation is for us to know that how our Environment need Attention for protection of our natural resources which are depleted day by day that's why we need to take time and shift our attention to renewable energy sources instead of non-renewable sources which are better and Eco-friendly for our environment. these renewable energy sources are so helpful for our planet and for every living organism which depends on environment.
Presented by The Global Peatlands Assessment: Mapping, Policy, and Action at GLF Peatlands 2024 - The Global Peatlands Assessment: Mapping, Policy, and Action
Improving the viability of probiotics by encapsulation methods for developmen...Open Access Research Paper
The popularity of functional foods among scientists and common people has been increasing day by day. Awareness and modernization make the consumer think better regarding food and nutrition. Now a day’s individual knows very well about the relation between food consumption and disease prevalence. Humans have a diversity of microbes in the gut that together form the gut microflora. Probiotics are the health-promoting live microbial cells improve host health through gut and brain connection and fighting against harmful bacteria. Bifidobacterium and Lactobacillus are the two bacterial genera which are considered to be probiotic. These good bacteria are facing challenges of viability. There are so many factors such as sensitivity to heat, pH, acidity, osmotic effect, mechanical shear, chemical components, freezing and storage time as well which affects the viability of probiotics in the dairy food matrix as well as in the gut. Multiple efforts have been done in the past and ongoing in present for these beneficial microbial population stability until their destination in the gut. One of a useful technique known as microencapsulation makes the probiotic effective in the diversified conditions and maintain these microbe’s community to the optimum level for achieving targeted benefits. Dairy products are found to be an ideal vehicle for probiotic incorporation. It has been seen that the encapsulated microbial cells show higher viability than the free cells in different processing and storage conditions as well as against bile salts in the gut. They make the food functional when incorporated, without affecting the product sensory characteristics.
1. Atmospheric Pressure and
Winds
Dr. Akepati S. Reddy
Professor, School of Energy & Environment
Thapar University, Patiala – 147 001
Punjab (INDIA)
2. Air Density, Temperature and Pressure
Air or atmospheric density
• Mass per unit volume (kg/m3) and indicated by ‘ρ’
• Mass subjected to gravity results in weight (same mass has different
weights depending on varying gravity of different planets
• At MSL, air density is 1.2 kg/m3 and it decreases with altitude
• Air density is pressure and temperature dependent
• At the same temperature and pressure conditions, density of the
moist air is lower than that of dry air – Why?
Air or atmospheric temperature
• Temperature is a measure of average speed of moving molecules
(kinetic energy)
• Measured in Kelvin scale (K) – at 0 K, there is no kinetic energy
• Temperature increases with increasing air density
• Atmospheric temperature is affected by
– Short-wave radiation from above and long-wave from below - further,
sensible and latent heat received from below (earth surface)
– Varying radiation absorption/emission properties of the atmosphere
3. Air Density, Temperature and Pressure
Atmospheric temperature
• Atmosphere has a distinctive temperature profile
• Temperature profile of the lower atmosphere is very variable (due
to the variable heating and cooling by earth surface (sensible and
latent heat, and radiation)
• Average temperature of the Earth is 288 K – in troposphere it
decreases with altitude (average vertical lapse rate is 6.6°C/km)
Atmospheric pressure
• Pressure is force per unit area – force is mass multiplied by
acceleration (kg.m/sec.2) – acceleration is change in velocity
through time (m/sec./sec. or m/sce2)
• Pressure units: N/m2 or Pa; Bars/millibars (1 mb = 100 Pa) –at MSL
pressure is 1013 mb or 101.3 kPa or 10130 kg air over one m2 area
• Atmospheric pressure decreases with altitude (700 mb at 3 km, 500
at 5.5 and 300 at 10) – mass of the overlying air reduces with height
4. Density, Temperature and Pressure, and Winds
Atmospheric pressure
• Atmospheric pressure also varies horizontally on the earth surface
(results from unequal heating of the earth surface)
– Recorded highest & lowest sea level pressures: 1084 mb and 870 mb
(typical range is 950 mb to 1050 mb)
– Surface pressure tendency over the fast several hours is useful in local
short range weather predictions
• Pressure (scalar quantity) is exerted in all directions – still an air
parcel is in equilibrium (pressure exerted by it is balanced by the
force -gravity pull- exerted by overlying air: hydrostatic equilibrium)
• Air parcels with pressures different from the surroundings, have
disturbed hydrostatic equilibria, and move in the atmosphere
• Pressure gradient force is responsible winds
– Despite very large vertical pressure gradients, because of the
hydrostatic equilibrium, vertical movement of air is very limited –
Vertical pressure gradient force operates opposite to gravity force
– Hydrostatic equilibrium or balance is disturbed in case of convection
currents and thunderstorms
– Horizontal pressure gradient on the other hand causes winds, though
it is many times lower than the vertical pressure gradient
5. Density, Temperature and Pressure, and Winds
Winds
• Movement of wind is due to the pressure gradient force from high
pressure region to low pressure region
• Divisible into surface winds and aloft or upper atmosphere winds
and also into vertical currents
• Winds carry and transport heat, moisture and pollutants, and wind
create conditions for clouds formation/dissipation and precipitation
• Wind is a vector quantity and has both speed and direction
components
– Increasing PGF (closer spacing of isobars) increases wind speed
– Wind speed is influenced by friction force (slows down the wind)
– Wind is named after from where it is blowing (west wind: wind coming
from the west)
– Wind direction (indicated in degrees in the clockwise direction from
the north) is influenced by both friction and coriolis effect
6. Density, Temperature and Pressure, and Winds
Winds
• General wind pattern of the Earth ( also called general circulation,
global circulation, or primary circulation) includes three circulation
cells (Hadley cells, Ferrel cells and Polar cells)
– Trade winds, Westerlies, and Polar Easterlies
– Geostrophic winds, and Jet streams
• Secondary circulation winds: Regional scale winds
– Monsoon winds ?
• Tertiary circulation winds: local winds (upto 100 km distance)
– Sea level breezes and mountain and valley breezes
• Wind is an important renewable energy source (indirect solar
energy)
– Wind speed matters a for wind energy (energy potential is
proportional to the cube of wind speed)
– Consistent winds are preferred (variability is not desirable)
7. Due to compressibility of air, atmospheric pressure decreases faster
near the surface but less so aloft
8. International Standard atmosphere
Pressure: 1013.25 hPa
Density: 1.225 kg/m3
Temperature: 288.15 K
Acceleration due to gravity: 9.80665m/sec.2
Speed of sound: 340.294 m/sec.
9. Measurement/Monitoring and Analysis
• Temperature
– Bimetallic thermometers (differential expansion of two different metals
by temperature is the basis of measurement)
– Electronic thermometers (elec. resistance changes with temp.)
• Pressure
– Mercury barometer (Evangelista Torricelli, 1643)
– Aneroid barometer – no liquid is used – air pressure deforms an
evacuated chamber and this is the basis of measurement
• Winds
– Wind velocity is measured by Anemometer
– Wind direction by Wind Vane (aerovanes for both speed and direction)
• Humidity (dew point monitoring!)
– Dew point: Temp. to which air needs cooling for saturation moisture
– Humidity is measured by hygrometer (Filamentous hygrometers – hair
expands/contracts with humidity variation; Electrical hygrometers –
chemicals absorb moisture and change resistance)
– Sling psychrometer (measures cooling by evaporation) and Wet bulb
and dry bulb thermometers
10.
11. Measurement/Monitoring and Analysis
• Monitored at the surface and at higher altitudes and use
– Surface weather stations
– Doppler radar (detects precipitation types and amounts , and
measures wind velocities)
– Radiosondes
• Package of instruments (thermometer, barometer, hygrometer and
transmitter)
• Launched twice daily (at 0000 and 1200 Universal Time Coordinate
on balloons from earth stations
• As the balloon ascends, temperature, dew point and wind are
measured and reported as a function of pressure (radiosonde
telemetry)
– Geostationary satellites and aeroplanes
• Data analysis and calculations for the parameters through indirect
measurements
12. Measurement/Monitoring and Analysis
• Wind roses from wind data analysis
– Wind speed, direction and frequency are pictorially presented
– How to construct wind roses and how to read them?
– Wind energy potential assessment
• Theoretically available power of a wind is expressed as
– Density of air decreases with temperature and altitude
– Wind velocity is the major factor in power generation (20% increase in
velocity increases power output by 73%)
• Potential temperature: Temperature that a parcel of air (at pressure
P) would acquire if adiabatically brought to a standard pressure P0
– It is denoted by θ and given by
P = 1/2 ρ A v3
P = power (W)
ρ = density of air (kg/m3)
A = area perpendicular to the wind (m2)
v = wind velocity (m/s)
T is current temperature (in K) of air parcel
R is the gas constant of air
Cp is specific heat capacity at constant pressure
R/ Cp for air is 0.286
13.
14. Atmospheric Pressure Gradient Force
• Horizontal pressure differences are mapped in the Average Sea
Level Pressure Charts (constant height charts) using isobars
– Pressure differences in the upper atmosphere are mapped in the
Constant Pressure Charts using iso-hypse (iso-heights)
• Iso-hypse gradient and horizontal pressure gradient influence the
speed of surface winds and upper atmospheric winds respectively
• Atmospheric pressure patterns are controlled by
– Temperature changes (thermal air pressure lows and highs)
– Earth rotation also creates air pressure systems (dynamic air pressure
lows and highs)
• Moving air masses (winds) affect changes in atmospheric
pressures
• Temperature changes can be
– Latitudinal (high temperature at equator and decreasing temperature
with higher latitudes
– Land and ocean surfaces (land surfaces rapidly heated and rapidly
cooled when compared to oceans)
– Elevation/Topography of the surface
15. January July
Isobars and Mean Sea Level Pressure Maps
Depicts how pressure changes while holding the height
constant
Good weather analysis tool
Surface/station pressure is reduced to sea level and
depicted by isobars (lines of equal MSLP) – station
pressure is adjusted for elevation to obtain the SLP
Wind speed is proportional to distance between isobars
These maps show low and high pressure centres, and troughs and ridges
Troughs: curved isobars forming elongated regions of low pressure
Ridges: curved isobars forming elongated regions of high pressure
ratiopressuretotaltopressureourwater vapis
61.01Texp v
10
10
rhere
rThere
TR
zg
PP
vd
16.
17. Isohypse (Isoheights) Constant Pressure Charts
Pressure is held constant.
Used to describe upper air
conditions.
Prepared twice a day at
0000 and 1200 UTC for
several mandatory
pressure levels (925, 850,
700, 500 mb, etc.)
Temperature, humidity and
wind data required is
provided by radiosonde -
data is supplemented from
other sources (aircraft and
satellites)
Forecast data is also
depicted on constant
pressure charts
18.
19. 2211PP
ConstantPVor
1
VPV
V
P
Pressure of a given mass of an ideal gas
is inversely proportional to its volume at
a constant temperature
Boyle’s law
Avogadro number and molar volume
The number of elementary particles (molecules and/or atoms) per mole
of a substance (6.022×10 23 mol -1) – it is expressed by the symbol NA
Molar volume: volume occupied by one mole of ideal gas – Its value at
STP is 22.414 L/mol and at NTP is 22.414 L/mol - it is same for all the
gases or mixture of gases
Volume of an ideal gas at constant
pressure is directly proportional to the
absolute temperature.
V1 = original volume and V2 = new volume
T1 = original temperature and T2 = new temp.
Charle’s law
2
2
1
1
T
V
T
1
Constant
T
V
or
T
V
TV
2
2
1
1
T
P
Constant
T
P
or
T
P
TP Gay-Lussac’s law
20. Ideal gas law for dry air
Ideal Gas Law expresses the relation between pressure, temperature
and volume or density in an ideal or perfect gas – expressed as
P V = n Ru T or p V = m R T or P = (m / V) R T or P = ρ R T
Ru (universal gas constant) = 8314.47 (J/kmol/K) n is number of moles
R (individual gas constant)(R = Ru / Mgas) = 8314/29 = 287 J/Kg/K
V = volume of gas (m3) p = absolute pressure (N/m2, Pa)
m = mass of gas (kg) T = absolute temperature (K)
ρ = density (kg/m3) (ρ = m / V) Mgas = molecular weight of the gas
Ideal gas law for moist air
• Daltons Law states that the total pressure exerted by a mixture of
gases is the sum of the partial pressures of the individual gases
pt = pa + pw pt is total pressure
pa is dry air partial pressure pw is water vapour partial pressure
• Dry Air Partial Pressure is pa = ρa (286.9 J/kg K) T
• Water Vapor Partial Pressure is pw = ρw (461.5 J/kg K) T
• For moist the ideal gas law can be written as P = ρ R Tv
Here R should be for moist air rather than for dry air – Instead correction is
made to temperature, T (as virtual temperature,Tv) Tv = T (1 + 0.61 r)
Here r is volume ratio of water vapour in the moist air
21. Pressure Gradient Force and Wind Systems
• Consider a warm column of air and a cold column of air separated
by 3000 kM distance, and assume
– 1005 mb pressure at near sea level and 600 mb pressure at 5500 m
altitude for the warm air column
– 1020 mb pressure at near sea level and 400 mb pressure at 5500 m
altitude for the cold air column
– 500 mb pressure is measured at 5880 m altitude for worm column and
at 4800 m altitude for cold column
• Difference in pressure at 5500 m altitude between the two columns
will initiate horizontal flow of air from warm column to cold column
– Height gradient indicates the magnitude of force causing the air
movement aloft
– Iso-heights for the warm column and the cold column can be used in
estimating the height gradient
• Similarly at the sea level, horizontal flow of air from the cold
column to the warm column is initiated
– Iso-bars between the warm air column and the cold air column can be
used in finding the pressure gradient
– Sea level pressure maps can be used for computing the HPGF
22. Horizontal pressure gradient between the two
columns is
The height gradient (difference in height of a
particular pressure value, 500 mb, for upper
altitudes) between the two columns is
mb/kM005.0
kM3000
)10051020(
mb
HPGF
m/kM36.0
kM3000
)48005880(
gradientHeight
m
Higher pressure is usually associated with fair
weather and clear skies, and lower pressure
with storms (tornadoes and hurricanes)
Pressure Gradient Force and Wind Systems
Vertical air movement of the air is the result of
net force of vertical pressure gradient force
and the vertical gravity force (acts opposite to
the VPGF – disturbed hydrostatic equilibrium)
Vertical motion of air masses produce winds
ZgP Hydrostatic equation:
23.
24. Low Pressure & High Pressure Wind Systems
• Atmospheric pressure patterns are controlled by
– Temperature changes created by differential heating (thermal air
pressure lows and highs)
– Dynamic air pressure lows and highs created by upper level winds and
earth rotation
• Temperature changes can be
– Latitudinal (high temperature at equator and low at higher latitudes
– Land and ocean surfaces (land surfaces are rapidly heated and rapidly
cooled when compared with ocean surfaces)
• The horizontal pressure gradients on the earth surface and the
height gradients of the upper atmosphere are highly dynamic
– Average Sea Level Pressure charts and Constant Pressure Charts are
used to show the dynamism
• Wind movement on the surface, in the upper atmosphere and
vertical movement of winds influence the pressure gradients
– Surface low pressure wind systems are maintained or intensified by
the divergence aloft of air
25. Colder earth surfaces on the other
hand develop cold air columns –
Characterized by surface thermal
highs and by upper altitude lows, and
by surface divergence and upper
altitude convergence of air
Warmer earth surfaces through
heating develop warm air columns
– Characterized by surface thermal
lows and by upper altitude highs
and by surface convergence and
upper altitude divergence of air
Surface high pressure
Cool sinking air
Surface low pressure
Warm rising air
26. Coriolis Force and Friction Force,
and Wind Systems
Winds created by the pressure gradient force are modified by
Coriolis force and friction force
Coriolis force
• Proportional to the speed of wind and varies with altitude (because
of friction force) and latitude
– Coriolis force changes only the wind direction but not speed (the level
of coriolis deflection is influenced by the wind speed)
– The amount of Coriolis deflection increases with latitude (zero at
equator and the maximum at poles)
– It acts at right angles (towards right in northern hemisphere and
towards left in southern hemisphere) to the direction of wind
• Moves air counter-clock-wise around a low pressure system and
clock-wise around a high pressure system in northern hemisphere
27.
28. Wind Systems of Atmospheric
Lows and Highs
In the northern hemisphere
– Air moves out (diverges) from a
surface high in the clockwise
direction and it moves in (converges)
into the surface low in the counter-
clockwise direction due to Coriolis
effect and friction
– In the higher atmosphere, with no
friction and with only pressure
gradient force and Coriolis effect in
action, air masses (winds or
geostrophic winds) run parallel to
isotherms (clockwise direction
around the highs, and counter-
clockwise direction around the lows)
In the southern hemisphere the wind
direction of convergence and
divergence is opposite to that of the
northern hemisphere
29. Coriolis Force and Friction Force,
and Wind Systems
Friction force
• It is Earth’s surface drag and it is limited to planetary boundary layer
(1 to 3 kM) – reduces with altitude – surface roughness increases
• Experienced by surface winds (through slowing down the wind
speeds it is reduces the Coriolis deflection)
In the upper atmosphere beyond the boundary layer, friction force is
negligible and Coriolis force is exactly equal and opposite to PGF
• Wind moves parallel to the isobars at constant speed (these winds
are called geostrophic winds)
– The air masses run parallel to the isobars (clockwise direction around
the highs, and counter-clockwise direction around the lows)
– Sub-geostrophic flow occurs around low pressure centres and super-
geostrophic flow occurs around high pressure centres
• Gradient winds: winds that blow at constant speed parallel to the
curved isobars (around highs/lows of the upper atmosphere)
30. Global Pressure Patterns and General Circulation
• Temperature difference between the equator and the poles
generates global general circulation
– Thermal lows at the equator and thermal highs at the poles are
generated
– Large scale vertical air movement generates pressure differences
across the Earth and assist in the development of surface winds
– 60% of the heat energy redistribution is by the atmospheric circulation)
• For an ideal earth (non-rotating and all oceanic earth) a single
circulation cell is expected
– Air raises near the equator, moves towards the poles in the upper
atmosphere, descends near the poles and moves towards the equator
on the earth surface
• What makes global air circulation very complicated?
– Latitude (radiation received varies)
– Earth’s rotation and tilt of the earth’s rotational axis (seasonality)
– Positions of continents and oceans - northern hemisphere has more
land than the southern hemisphere
– Altitude and roughness of the earth surface
– Cloud cover (during daytime clouds reflect radiation and during nights
clouds prevent escape of radiation
31. Global Pressure Patterns and General Circulation
• Due to the rotation, instead of a single cell, three cells of large-scale
circulation (of rising and descending air) are existing
– Hadley cells, Ferrel cells and Polar cells
• Continents gain and loose heat much more quickly than oceans
– Become warmer during day time and colder during nights (land-sea
breezes)
– Become much warmer in summers and much colder in winters - low
pressure cyclones are developed during summer and high pressure
anticyclones during winters - (monsoons!)
– Coastal land areas stay warmer in winter and cooler in summer
– Because of the land-sea distribution differences, mid-latitude cyclonic
depressions are rapidly developed in the northern hemisphere oceans
32. Atmospheric pressure patterns
Thermal highs and lows
• Equatorial thermal lows at 5 N to 5 S (intertropical convergence
zone –ITCC)
• Polar thermal highs at 90 N and S: Characterized by descending air
• Monsoon lows
• Highs and lows associated with land-sea breezes and Mountain-
valley breezes
Rotation induced or dynamic air lows and highs
• Earth rotation causes accumulation of air at certain latitudes (highs)
and air divergence at other latitudes (lows)
• Sub-tropical highs (at 25 to 40 N and S) characterized by descending
dry air and clear skies
• Sub-polar lows (at 55 to 70 N and S) characterized by ascending air
and storm centers (warm air from low latitudes is lifted up by the
cold polar air)
33. Global Pressure Patterns & Climate Zones
Tropical climate:
• Intertropical convergence zone (ITCC)
• Equatorial thermal lows near the equator (between 5 N to 5 S)
• Characterized by high sun angles, long days, high surface
temperatures, ascending air, heavy precipitation, cloud cover and
thunder storms
• This zone shifts to the north of the equator in summer and to the
south in winter
Subtropical climate:
• This zone is between 25-40° N and between 25-40 S latitudes
• Air rising at the equator spreads out, cools, and descends here
• This zone is associated with clear skies, low rainfall, and high day
time temperatures (>40°C)
• Many of the hot deserts are found here
• This zone expands towards higher latitudes during summer
34. Global Pressure Patterns & Climate Zones
Temporate climate:
• Between 50-60 N and between 50-60 S latitudes
• Some of the descending air of subtropical zone (warm surface air)
and the cold surface air from the poles moves towards this zone
• The warm surface air and the cold polar collide in this zone, and rises
up, developing a low pressure zone
• This zone is cyclonic in nature, and is associated with the
development of frontal depressions (more dominant in winters)
• Sometimes, during summers, the subtropical highs expand into, and
the temperate zone experience calming influence on weather
Polar zone of climate:
• Polar thermal highs at 90 N and S
• Characterized by very low temperatures, descending and heavy air,
and creation of highs
• This zone has permanent, thick snow and ice cover
• This zone can be as dry as hot deserts of subtropical climate zone
35. Winds and Currents
• Horizontal motion of air is considered as wind and vertical motion
as current
• Wind is a constituent of weather and wind is also a determinant of
other elements of the weather (temperature and precipitation)
• Air movement is because of the interacting forces imbalances
– Interacting forces include real forces (horizontal & vertical PGFs,
gravity force and friction force) and apparent forces (Coriolis force)
– Air movement is meant for the balancing or equilibriating the forces
– Since the factors causing the force imbalances are constantly
changing, the equilibriating process is an unending process
• Vertical movement of air occurs only when gravity is not balanced
by VPGF (at lows and highs)
– Air moves up when the vertical pressure gradient force is stronger
then the gravity force, and moves down when it is weaker
• Moving winds experience no Coriolis deflection at the equator and
the deflection increases with latitude (the maximum at poles)
• Winds in the upper atmosphere experience no surface drag
(frictional force) and hence have higher wind speeds (geostrophic)
36. Winds and Currents
Surface winds
• Intertropical convergence zone (ITCZ): the equatorial (between 5 N
and 5 S) belt of variable winds and calm (also known as doldrums)
• Trade winds: North-East and South-East winds seen at 5 to 25 N and
S latitudes; the winds are steady and persistant
• Horse latitudes: subtropical belt of variable winds and calm; seen in
30 to 35 N and S latitudes
• Weterlies: seen at 35 to 60 N and S latitudes; these winds are
neither persistent nor steady.
• Polar front: seen in 60 to 65 N and S latitudes; it is a zone ofconflict
among different air masses – the boundary between the polar
easterlies and the westerly winds of the mid latitudes – it separates
the cold polar air from the warm temperate air
• Polar easterlies: seen at 65 to 80 N and S latitudes; more prevalent
in the southern hemisphere than in the northern hemisphere
• Polar zone: seen in 80 to 90 N and S latitudes; variable winds and
calm are characteristics
37. Winds and Currents
Winds aloft
• Surface lows/highs have matching upper atmosphere highs/lows
• In the upper atmosphere air moves under the influence of PGF and
Coriolis force and parallel to the isobars
• Upper atmosphere has westerly jet streams - Rivers of extremely
high speed winds - occurs in the zones of strong temperature
contrasts – polar and sub-tropical jet streams
Winds of the upper atmosphere
• Upper level westerlies: seen between 25-90 latitudes
• Tropical high pressure belt (5 to 20 N and S latitudes)
• Equatorial easterlies
Jet streams:
• Polar jet: moves from west to east at ~10 kM altitude – when the
cold air from poles meets the warm air from the other side, strong
temperature and pressure gradient is developed - seasonally shifts
• Subtropical jet (westerly jet) – located at 13 kM altitude above the
subtropical high zone – this jet is relatively weaker because of the
weeker latitudinal temperature and pressure gradients
38. Regional Winds and Local winds
Regional winds
• Monsoons
Local winds are caused by contrasts in heating of the
atmosphere at the surface
• Water and land, at coastlines of seas and lakes
• Urban and rural areas
• Vegetated and unvegetated areas
• Wet and dry areas
• Snow-covered ground and bare ground
Day time sea breeze Night time land breeze
Mass of the atmosphere - pressure and surface area of the earth to be considered (π D2)
For finding the number of moles mass can be divided by molecular weight of the atmosphere
Hydrostatic equation:
Reported wind speeds and directions are usually one or two minute averages.
Theoretical and rated wind power generation from typical windmills are indicated in the "wind speed-power curve" below. Cut-in wind speed, rated wind speed, shut-down wind speed and rated power for windmills with 20% and 40% efficiency are indicated.
Surface low pressure centre indicates cyclonic condition and associated with unstable conditions and stormy weather
Surface high pressure center indicated anticyclonic condition and is associated with fair weather conditions
Pressure gradient force, coriolis force and friction affect movement of air into and out of air pressure systems
Most of these are found over the world oceans
The pacific high: at 30 N of the coast of california – shifts to south during winters and north during summers
Aleutian low: at 60 N in the gulf of alaska – shows seasonal shifts
Bermuda – azores: at 30N and shows seasonal shifts
Icelandic low: at 60 N near iceland