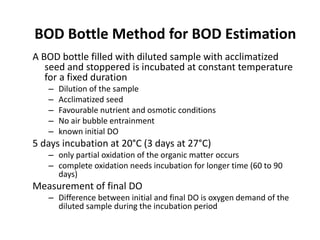
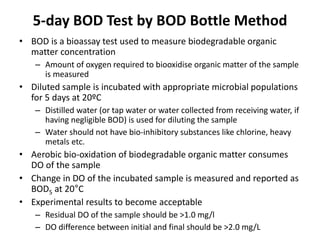
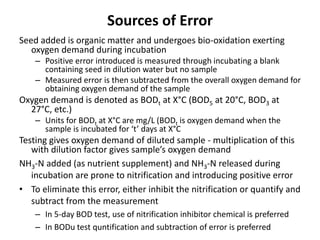
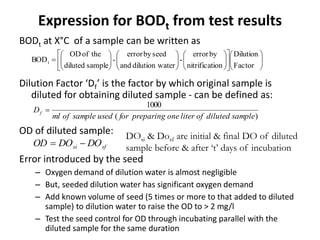
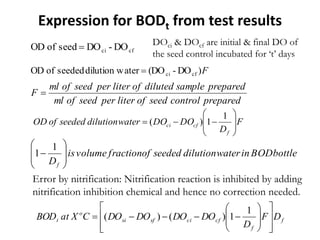
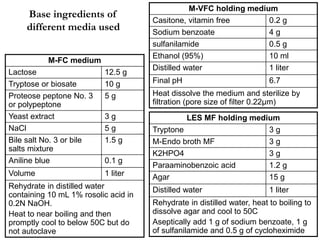
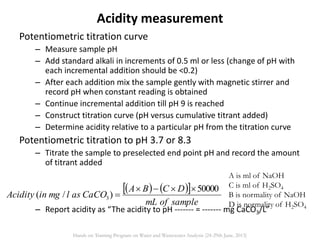
This document defines and describes various types of suspended solids and organic matter that are measured in wastewater treatment. It discusses total suspended solids (TSS), volatile suspended solids (VSS), biodegradable VSS, settleable solids, fixed suspended solids, and colloidal solids. It also covers measurements of organic matter including total organic carbon (TOC), theoretical oxygen demand (ThOD), chemical oxygen demand (COD), biochemical oxygen demand (BOD), and BOD kinetics. The document provides details on procedures for measuring these parameters, including the use of filters, ignition, centrifugation, Imhoff cones, and demand tests.


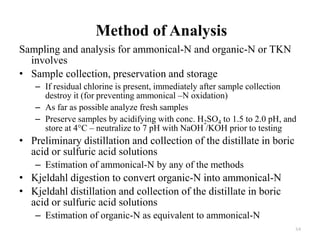


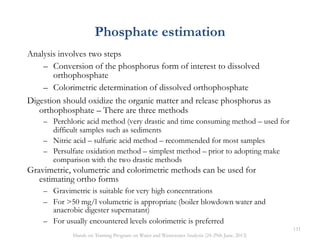


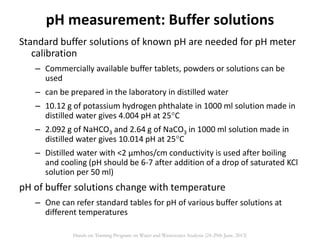

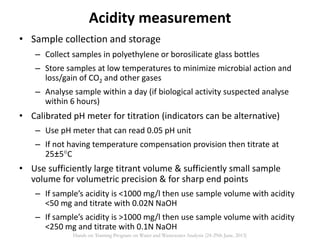
![Carbon dioxide estimation
Nomographic chart can be used
– Requires pH, alkalinity, dissolved solids and temperature of the sample
for the measurement
Can also be measured from the following expression
– If pH is not accurately measured CO2 measurement will be erroneous
(25% error in CO2 measurement for 0.1 unit error in pH measurement)
1
32
3
AK
COH
HCOH
Here [H2CO3] is sum of carbonic acid and free
Carbon dioxide (99% is free CO2)
Hands on Training Program on Water and Wastewater Analysis (24-29th June, 2013)](https://image.slidesharecdn.com/phacidityandalkanity-201014122543/85/PH-acidity-and-alkanity-203-320.jpg)

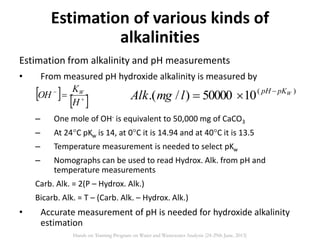
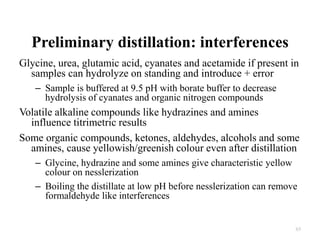
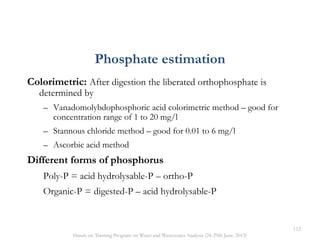
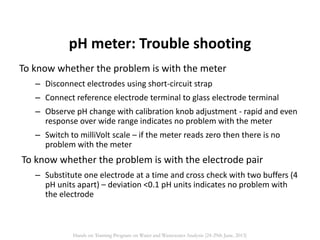
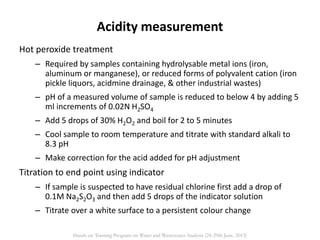
![Estimation from equilibrium
equations
Measurement of pH, total alkalinity, TDS and
temperature are needed
Sum of equivalent concentrations of cations
must be equal to the sum of
equivalent concentrations of anions
From pH and temperature measurements
[H+] and [OH-] can be estimated
Carb. Alk. and Bicarb. Alk. Can be measured
by
At 20C KA2 is 4.7X10⁻¹¹
Temp. and ionic concentrations influence
the value of KA2
Nomographs can be used to know KA2 from
temp and TDS measurements
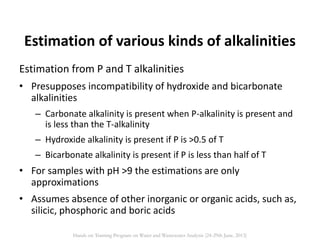
Estimation of various kinds of alkalinities
OHCOHCO
Alk
H 2
32
50000
.
WKHOH
H
K
H
K
H
T
AlkCarb
A
W
22
1
50000
50000
..
22
1
50000
50000
..
A
W
K
H
H
K
H
T
AlkBicarb
2
3
2
3
AK
HCO
COH
Hands on Training Program on Water and Wastewater Analysis (24-29th June, 2013)](https://image.slidesharecdn.com/phacidityandalkanity-201014122543/85/PH-acidity-and-alkanity-214-320.jpg)