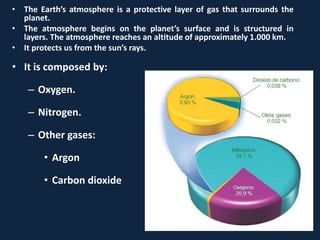
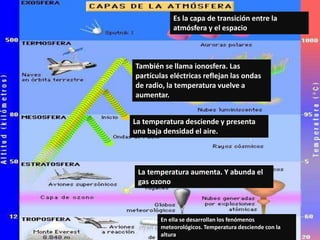
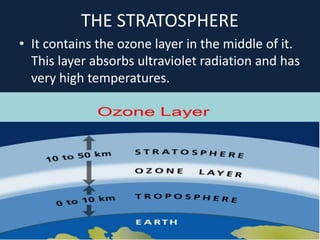
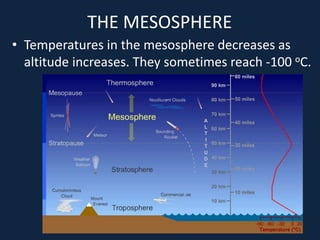
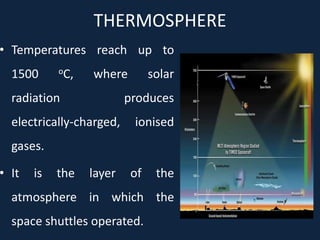
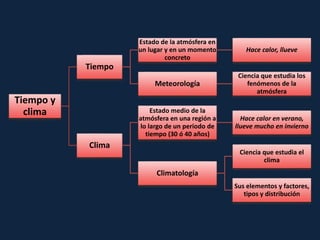
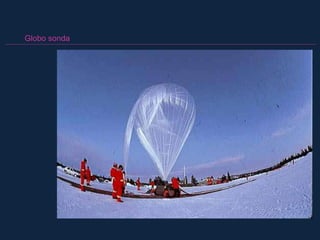
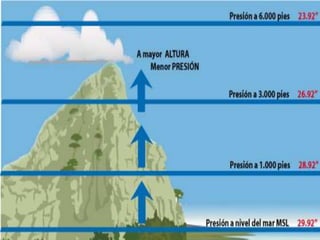
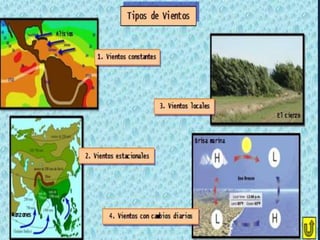
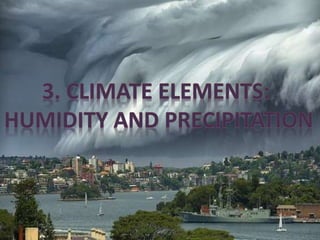
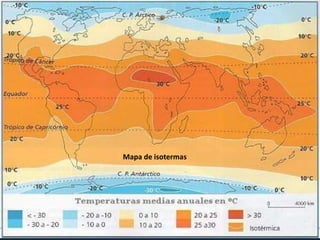
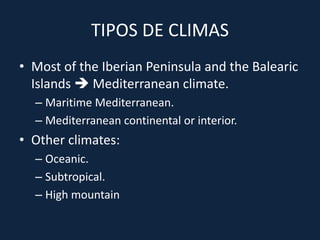
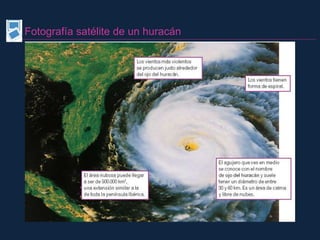
• The Earth’s atmosphere is a protective layer of gas that surrounds the
planet.
• The atmosphere begins on the planet’s surface and is structured in
layers. The atmosphere reaches an altitude of approximately 1.000 km.
• It protects us from the sun’s rays.
• It is composed by:
– Oxygen.
– Nitrogen.
– Other gases:
• Argon
• Carbon dioxide
CAPAS DE LA ATMÓSFERA
Es la capa de transición entre la
atmósfera y el espacio
También se llama ionosfera. Las
partículas eléctricas reflejan las ondas
de radio, la temperatura vuelve a
aumentar.
La temperatura desciende y presenta
una baja densidad el aire.
La temperatura aumenta. Y abunda el
gas ozono
En ella se desarrollan los fenómenos
meteorológicos. Temperatura desciende con la
altura
THE TROPOSPHERE
• It is in contact with the surface of the Earth. It
is almost all water vapour.
• Here temperatures drop by 0.65 oC for every
100 m of altitude.
• Most meteorological phenomena, such as
cloud formation, wind and rain, occur here.
• The air does not remain static. Their
alterations cause meteorological phenomena,
such as wind or humidity.
THE STRATOSPHERE
• It contains the ozone layer in the middle of it.
This layer absorbs ultraviolet radiation and has
very high temperatures.
THE MESOSPHERE
• Temperatures in the mesosphere decreases as
altitude increases. They sometimes reach -100 oC.
THERMOSPHERE
• Temperatures reach up to
1500 oC, where solar
radiation produces
electrically-charged, ionised
gases.
• It is the layer of the
atmosphere in which the
space shuttles operated.
EXOSPHERE
• It is the outermost layer of atmosphere. It
extends to the highest limits of the
atmosphere where only molecules of helium
and hydrogen are found.
• The temperature may fall to -273.15 oC at
night.
• Air is matter; it has mass, temperature and pressure.
TEMPERATURE
 When air is heated it expands, becomes lighter and rises.
 Air temperature becomes colder as it gets further from the Earth’s surface. When it is
cooler, the air begins to fall back towards the surface.
ATMOSPHERIC PRESSURE
 The gases in air have weight that presses down on the Earth’s surface. It is measured
with a barometer.
 Altitude and temperature determine atmospheric pressure.
RELATIVE HUMIDITY
• Relative humidity refers to the amount of water vapour that air contains. Warmer air can
hold more water vapour, but all air temperatures have a maximum amount of water vapour.
• We call air the set of gases in the atmosphere.
WEATHER the state of the lower layers of the atmosphere
at a certain time and place on Earth. So, for example, if
we say that one day it's hot or it's raining, we're
referring to weather. Meteorology is the study of the
atmosphere and the atmospheric phenomena that affect
weather.
CLIMATE refers to the state of the weather in a certain region
of the planet over a long period of time, usually 30 years or
more. So, when we say that in a place it is hot every day in
summer, or that it rains a lot in winter, we are alluding to
characteristics of its climate.
Climatology is the study of climate.
ELTIEMPO ATMOSFÉRICO es el estado de la atmósfera
(sequedad, lluvia, calor, frío, etc.) en un lugar
determinado del planeta y en un momento concreto. Así,
por ejemplo, si decimos que un día hace calor o llueve,
e s t a m o s r e f i r i é n d o n o s a l t i e m p o
atmosférico.
La METEOROLOGÍA es la ciencia que estudia los fenómenos
que suceden en la atmósfera.
EL CLIMA es la sucesión periódica y habitual de esos estados
de la atmósfera en una zona de la Tierra, medida durante un
largo período de tiempo. Así, cuando decimos que en un lugar
hace calor todos los días en verano, o que llueve mucho en
i n v i e r n o , e s t a m o s a l u d i e n d o a c a r a c t e r í s t i c a s d e
su clima.
La CLIMATOLOGÍA es la ciencia que estudia el clima, sus
distintos tipos y su disposición.
Tiempo y
clima
Tiempo
Estado de la atmósfera en
un lugar y en un momento
concreto
Hace calor, llueve
Meteorología
Ciencia que estudia los
fenómenos de la
atmósfera
Clima
Estado medio de la
atmósfera en una región a
lo largo de un periodo de
tiempo (30 ó 40 años)
Hace calor en verano,
llueve mucho en invierno
Climatología
Ciencia que estudia el
clima
Sus elementos y factores,
tipos y distribución
MAPA DEL TIEMPO
WEATHER = Atmospheric pressure + Temperature +
Precipitations + Wind
+ +
The WEATHER in one place and that is repeated throughout
all the years in the same way, is the CLIMATE.
MAPA CLIMAS DE
EUROPA
THE WEATHER FORECAST
In our country, the National
Institute of Meteorology
elaborates every day the weather
map with the data received at
land and sea stations (thanks to
instruments such as the
barometer, the anemometer,
the rain gauge, etc.), and with
the photograph sent by the
Meteosat satellite.
The satellites provide a
systematic and real-time
information of the most
important weather conditions for
weather prediction.
Globo sonda
Satélite meteorológico Meteosat
Estación meteorológica
Imagen realizada por el satélite Meteosat
• The elements that make up a climate are
atmospheric phenomena that can be
measured and analysed.
• The elements of the climate are:
 Atmospheric pressure.
 Wind.
 Precipitation
 Temperature.
PRESIÓN ATMOSFÉRICA
• It is the weight of the air in the atmosphere,
as a consequence of gravity, on a specific area
of the Earth.
• It is measured with an instrument called a
barometer and expressed in millibars.
• The air pressure is not the same throughout
the Earth's surface. It depends on two factors:
altitude and temperature.
Atmospheric
pressure
Altitude Temperature
• The higher altitude,
the lower atmospheric
pressure.
• The higher
temperatura, the
lower atmospheric
pressure.
• ISOBARS  Lines that join points of equal atmospheric
pressure on a map.
• ANTICYCLONES Areas of high pressure (more than
1013 mb). They form when a mass of cold air descends
and the pressure increases. They produce stable
weather.
• DEPRESSIONS  Areas of low pressure (less than 1013
mb). They form when a mass of warm air rises and the
pressure decreases. They produce unstable weather. .
Mapas del tiempo
● Representaciones del
estado de la atmósfera
en un lugar y momento
determinado.
● Para interpretarlo, es
necesario observar:
o Centros de acción.
o Distribución de las
isobaras y gradiente
de presión.
o Frentes.
Isobaras. Líneas
que marcan puntos
de igual presión.
Frente frío (línea azul con triángulos).
Frente cálido (línea roja con círculos).
Gradiente de presión.
•Diferencia de presión entre dos puntos.
•Indica la fuerza del viento (mayor cuanto
más próximas estén).
Centros de acción
Anticiclones (A) y
Borrascas (B)
• The wind is a mass of air in
motion.
• It is caused by differences in
atmospheric pressure. The air
goes from the high pressure to
the low pressure zones.
• The wind speed is measured with
the anemometer and is expressed
in meters per second (m/s) or
kilometers per hour (km/h). The
weathercock or weather-vane
indicates the direction of the
wind.
Viento
Aire en
movimiento
Se origina cuando hay
diferencia de presión
atmosférica
El aire se desplaza de las altas
(A) a las bajas presiones (B)
Instrumentos de
medición
Veleta
Señala la
dirección
Indica la
procedencia
Puede ser N, S, E, O
Anemómetro
Mide la
velocidad
Se mide en m/s o km/h
• Types of winds:
– Prevailing winds (Vientos constantes). They always
blow in the same direction and in the same regions.
– Periodic winds (Vientos estacionales). They vary
depending on the season, such as monsoons.
– Local winds (Vientos regionales o locales). are found
in small areas. They usually blows in the same
direction. Some examples in Spain are tramontane,
galerna or cierzo.
Globo con la distribución de las presiones y los vientos
AIR HUMIDITY
• It is the amount of
water vapour that is
in the air.
• To measure the
humidity of the air
the hygrometer is
used and when it
marks 100% it is said
that the air is
saturated.
• The humidity of the air comes from the
evaporation of the water.
• The water contained in the air masses is in the
form of water vapour.
• The amount of water in the air depends on
the temperature:
The higher the temperature, the greater the
amount of water in the air mass.
• Condensation: process by which the water
vapour that contains a mass of air turns into
liquid water when the mass rises and cools.
• It produces rainfall or precipitations. In the
form of rain, snow or hail.
Rainfall or precipitations is
water that falls from the
atmosphere to the earth's
surface in the form of rain,
snow, sleet or hail.
To measure
precipitation, the
rain gauge
(pluviómetro) is used
and is expressed in
litres por m2 (l/m2)
or in mm.
An isohyet or isohyetal line is a line joining
points of equal precipitation on a map. A map
with isohyets is called an isohyetal map.
TYPES OF PRECIPITATION
• Convection rainfall (Lluvias de convección)
• Frontal rainfall (Lluvias de frente)
• Relief rainfall (Lluvias de relieve)
1. El sol evapora
el agua del suelo
h ú m e d o .
2 . A l
ascender el
v a p o r d e
a g u a s e
e n f r í a .
3. El vapor de
a g u a , a l
enfriarse, se
c o n d e n s a
f o r m a n d o
n u b e s , q u e
p r o v o c a n
l l u v i a s .
Por Evaporación o
convección
1 . L l e g a
a i r e
caliente y
s e
e n c u e n t r a
c o n u n a
m o n t a ñ a .
2 . E l
a i r e
asciende
y s e
e n f r í a .
3 . S e
f o r m a n
n u b e s y
l l u e v e .
Por Relieve
1. Una masa
d e a i r e
caliente y
h ú m e d o s e
e n c u e n t r a
c o n u n a
m a s a d e
aire frío.
2. La masa de
aire caliente
p e s a m e n o s y
a s c i e n d e p o r
encima de la de
a i r e f r í o ,
e n f r i á n d o s e .
3 . S e
f o r m a n
n u b e s y
llueve.
Por Frentes
• The Earth's surface is heated by the sun's rays.
• The Earth's surface radiates heat and heats
the masses of air that are in contact with it.
• Isotherm map  map with lines joining the
places with identical thermal values.
Mapa de isotermas
PHYSICAL FACTORS THAT INFLUENCE
TEMPERATURE
• The regulatory action of the sea  The sea
cools and warms more slowly than the Earth.
Temperatures in coastal areas are milder.
• The altitude  Every 100 m in height, the
temperature decreases by 0.6 ° C.
• The latitude  The temperature decreases as
we move away from the Equator and we
approach the Poles.
• The Earth is divided into climatic zones or
regions, depending on temperatures and
rainfall.
Two cold climate zones.
Two temperate climate zones.
One hot climate zone.
TROPICAL OR HOT CLIMATIC ZONE
• Located between the two
tropics: it receives the name
of intertropical zone.
• High temperatures, more
than 18o C of annual
average.
• It is due to the
perpendicular incidence of
the sun's rays, most of the
year.
TEMPERATE CLIMATIC ZONES
• Located between the tropics
and the polar circles.
• The solar rays arrive more
inclined.
• The average temperatures are
between 0 and 18o C.
• A cold season (winter),
another hot (summer) and
two intermediate: spring and
autumn.
• Since there is a temperate zone in each
hemisphere  the seasons are interchanged.
• When in the northern hemisphere it is
summer, in the south it is winter.
COLD CLIMATIC ZONES
• Located between the polar
circles and the poles.
• The incidence of solar rays
is very oblique.
• Annual temperatures
lower than 0o C.
• Rainy climate: more than 800 l/m2 per year.
• Intermediate climate: 300-800 l/m2 per year.
• Dry climate: less than 300 l/m2 per year.
• The combination of annual temperature and
precipitation data results in nine different climate
types.
CLIMA POLAR
• Temperatures below 0o C.
• Little rainfall, not exceeding 200 mm, almost
always in the form of snow.
• Between the polar circles and the poles.
• Landscape: permafrost (permanently frozen
ground), with extensive glaciers or indlandsis and
the layer of ice that covers the oceans, called ice
field (banquisa). In summer, when the ice melts,
tundra (landscape composed of shrubs, lichens
and mosses).
• Wildlife: polar bears, penguins, sea lions, seals ...
• Polar environment
– Location in polar
areas:
• Arctic Circle.
• Antarctic polar circle.
• They represent 25% of
the land area.
• Polar environment
– Rivers
• There are no rivers, but ice:
– In the Arctic, the ice sheet or banquisa is 5 m thick.
– In the Antarctic, the inlandsis or ice cap, 2,000 m thick on the
continent.
• Polar environment
– Vegetation
• The cold and the frozen ground (permafrost) prevents the vegetation.
• Tundra: at lower latitudes, the ice-free land is covered with mosses,
lichens and some shrubs.
POLAR LANDSCAPE
SALIRSALIRANTERIORANTERIOR
• Polar biome
– Fauna:
 Limited.
 Species of thick fur skins
(bears, reindeer)
 Fat species (seals, penguins).
• Polar biome
– Population:
• Only 0.02% of the
world's population lives
there.
• In the Arctic zone:
Eskimos or Inuit
(America) and Lapps
(Scandinavia).
• In Antarctica, only
scientific bases.
ALPINE CLIMATE / CLIMA DE ALTA MONTAÑA
• Cold winters and cool summers.
• Abundant rainfall, exceeding 1500 mm and
throughout the year.
• It is located in the main mountain systems.
• Stepped landscape: in areas of lower height,
coniferous forests and deciduous forests; from
2500 m, bushes and meadows; from 3500 m,
naked rock and perpetual snow.
• Alpine biome
– Location
• Great mountain ranges: Himalayas (Asia), Andes (America) and
Alps (Europe).
• It is considered high mountain above 2500 m, although it
varies throughout the planet.
• Alpine biome
– Rivers
• In the mountains are the
upper course of rivers: of
great slope and erosive
force.
• In the highest areas:
glaciers.
• Alpine biome
– Vegetation
• Staggered in floors according to altitude: crops, deciduous
forests, coniferous forests, meadows, rock and perpetual snow.
• Varies according to the slope of sun and shade.
• Alpine biome
– Fauna
• High mountain species: birds of prey, mountain goats, chamois,
marmot ..
• Alpine biome
– Population
• Half inhabited (except in valleys).
• Livestock and agricultural activity.
• Exploitation of forests.
• Tourism and leisure (skiing,
mountaineering ...).
EQUATORIAL CLIMATE
• Very warm temperatures: above
22o C all year round. Average of
25o C without differences
between day and night.
• Abundant and regular rainfall
every month of the year.
Superior to 1500 or 2000 mm
per year.
• It is located north and south of
the Equator.
• Landscape: jungle and
mangroves (swamp areas).
• Animals: showy birds,
amphibians and reptiles, lots of
insects.
Bosque de manglares
Mangroves
Jungle / Selva ecuatorial
• Equatorial biome
– Location
• Around the Equator.
• Central America and the Amazon Basin, the Congo
Basin and Guinea Coast (Africa), Southeast of Asia.
• Equatorial
biome
– Rivers
• Regular and
large
(Amazonas
and Congo).
• They drag a
lot of
materials.
• Equatorial biome
– Vegetation
• Jungle (en Asia, jungla).
– Dense forest of diverse
species of great height (up
to 80 m) like ebony,
mahogany ...
– Undergrowth, dark and
humid (ferns, mimosas,
mosses).
– Eg Amazon.
Mapa de distribución de la selva
La selva amazónica
• Equatorial
biome
– Fauna
• Varied:
mammals
(jaguar,
apes),
reptiles
(snakes),
amphibians,
birds and
insects.
• Equatorial biome
– Population
• Almost uninhabited in Africa and
America, where there are primitive
peoples (Pygmies, Yanomami).
– The population is concentrated in
the coast, the plateaus and average
mountain slopes.
• In Asia, very populated by plantations
(rice, tea ...).
TROPICAL CLIMATE
• Temperatures above 20o C all year round.
• It has two seasons: one rainy and one dry.
• Very abundant rains.
• It is located on both sides of the equatorial zone:
central plateaus of Africa, regions of South
America, northern Australia and areas of South
and Southeast Asia.
• Most characteristic landscape: savannah.
• Fauna: large herbivores, such as elephants,
giraffes ...; big carnivores, like lions, leopards;
scavengers, like hyenas ...
• Tropical biome
– Location
• Around the tropics.
• Central and South America.
• South Asia and Australia.
• Central and South Africa.
• Tropical biome
– Rivers
• Irregular
• They depend on the seasons: high
water / low water (Zambezi, Nile).
• Sometimes, catastrophic floods.
• Tropical biome
Vegetation
– Savannah
 Huge plain of tall,
thick grasses, bushes
and scattered
deciduous trees
(acacias, baobab).
 Green and leafy in
wet season; yellow
and withered in the
dry.
– It degrades in the
steppe.
– On the banks of
rivers, forest-gallery
like those of the
jungle.
Mapa de distribución de la sabana
Esquema de la sabana
• Tropical biome
– Fauna
• Rich in large
herbivores
(elephants,
giraffes, zebras
...) and
carnivores
(lions,
hyenas…)
• Tropical biome
– Population
• It is concentrated
on the coast and
banks of rivers.
• Traditional
shepherd peoples:
Masai and Kikuyus
(Kenya), Podokos
(Cameroon),
Serere (Senegal).
• Monoculture
plantations
(cocoa, coffee,
sugar, tobacco ...).
MONSOON CLIMATE / CHINESE CLIMATE
• It is a tropical variety.
• Conditioned by monsoon winds.
• The rainy season can exceed 2000 mm.
• It occurs in Southeast Asia.
DESERT CLIMATE
• It has very high temperatures (annual average
above 20o C), with strong contrasts between day
and night.
• Very little rainfall, does not exceed 250 mm.
• They are located in areas close to the tropics.
• Xerophilous vegetation (with thorns instead of
leaves and capable of storing water - cactus).
Sometimes with oasis.
• Scarce fauna: reptiles, insects, birds and small
mammals. In addition to camels and
dromedaries.
Desierto del Sáhara
• Desert biome
– Location
 Tropical deserts
– Sáhara
– Arabia
– Kalahari
 Coastal deserts
– Atacama
– Namibia
– Gran Desierto de
Arena
 Interior deserts
– Gobi
– Colorado
• Desert biome
– Rivers
• There are no rivers, only ouadis: they carry water only when it rains.
• Desert biome
– Vegetation
• Scarce and adapted to aridity (thorny shrubs and cactus).
• In oases (areas where there is water) there are palm trees
and fruit trees.
• Desert biome
– Fauna
• Scarce and
adapted to
aridity:
camels,
dromedarie
s, reptiles,
rodents,
insects.
• Desert biome
– Population
• Almost uninhabited (<2% of the world's population).
• Primitive peoples: Bushmen (Kalahari); or nomadic shepherds:
tuareg (Sahara), Bedouin (Arabia).
• Exploitation of gas and oil.
OCEANIC OR ATLANTIC CLIMATE
• Soft temperatures throughout the year. With
thermal amplitude less than 15o C.
• Abundant rainfall, above 800 mm, spread over all
seasons.
• It is situated on the western facades of the
European Atlantic coasts and in some areas of the
Pacific coast.
• Landscape: oceanic forest with deciduous trees
(oak, beech, elm and chestnut), meadows.
• Fauna: large herbivores (deer) and predators
(bears, wolves, foxes), as well as birds, rodents,
reptiles ...
• Oceanic biome
– Location
• Parallel 40-60o N
and S: western
coasts of Europe
and North
America; SO
coast of South
America, SE
coast of
Australia,
Tasmania and
New Zealand.
• Oceanic biome
– Rivers
• With abundant and regular flow.
• Thames, Loire, Rhin.
• Oceanic biome
– Vegetation
• Forests deciduous or deciduous (oak, chestnut, beech, ash ...).
• Oceanic biome
– Vegetation
• It degrades in:
– Landa with bushes and bushes (heather and broom).
– Meadows, in coastal and mountainous areas.
• Oceanic biome
– Fauna
• Abundant
(mammals,
migratory
birds).
• Oceanic biome
– Population
• In Europe it is a very inhabited
and transformed medium
(agriculture, cities, industries,
communications ...).
• In America and Oceania, it is
less inhabited.
CLIMA MEDITERRÁNEO
• Its average temperature ranges between 15 and 20o C,
without large temperature variations. Soft all year
round. Hot summers and mild winters.
• Little rainfall, less than 700 mm, especially in autumn
and spring, very scarce in summer and winter.
• Location: Mediterranean coast, South coast of
Australia, America in the Pacific and Africa.
• Landscape: Mediterranean forest, with evergreen trees
(holm oak, cork oak, pine). Shrubs such as garrigue,
rockrose (jaras) and aromatic bushes (rosemary,
thyme).
• Mediterranean biome
– Rivers
• Low flow (especially in summer) and irregular (Segura,
Tíber).
• Floods and floods are frequent due to heavy rains.
• Mediterranean biome
– Vegetation
• Mediterranean forest, with
evergreen trees (oak, cork,
pine), low, thick and hard
leaves.
• It degrades in maquis and
garrigue of odorous plants
(rockrose, lavender, thyme,
rosemary, lavender).
Bosque mediterráneo:
encina, alcornoque,
pino carrasco y pino
piñonero
Jara
Brezo
Lentisco
Retama
Maquia
Tomillo
Espartal
Garriga
EstepaLavanda
Romero
Palmito
• Mediterranean
biome
– Fauna
• Abundant:
small mammals,
birds, reptiles,
insects.
• Mediterranean biome
Population
– Very inhabited and transformed
environment.
– They are given:
 Rainfed crops (wheat, vine, olive) and
pasture areas in the interior.
 Irrigated crops (vegetables, vegetables,
fruits) near rivers, on the coast and
greenhouses.
– Development of tourism.
CONTINENTAL CLIMATE
• Warm summers and very cold winters, with
temperatures below 0o C.
• Precipitation between 300 and 700 mm (more
frequent in summer).
• Areas of the interior of the continents.
• Landscapes: meadows with tall grasses,
steppes (with small shrubs and low grass),
conifers. In very cold areas, taiga (coniferous
forests and large meadows).
• Continental biome
– Location
• Inland lands of Europe, Asia and North America, in places far
from the large bodies of water and their regulatory effects.
• Continental biome
– Rivers
• Long and flowing (Volga,
Yukon).
• Ice cream in the coldest areas
in winter.
• In spring they suffer great
swellings due to the thaw.
• Continental biome
– Vegetation
• Taiga or coniferous forest, with evergreen trees (firs, pines,
larches).
• Meadows in less cold and wetter areas, composed of tall
grasses.
• Steppes in warmer and drier areas, with smaller herbs.
• Continental
biome
– Fauna
• Large mammals:
bears, moose,
wolves ...
• Great rodents:
martens, beavers,
minks ...
• Continental biome
– Population
• Lumber and infrastructure are concentrated in the taiga,
although the population is scarce.
• The grasslands are more populated and are dedicated to the
cultivation or to the raising of cattle.
• A climograph is a graphic representation of
the temperatures and rainfall of a given place
over a year.
1. Draw the axes
–On a graph paper, we draw the axes of
the climograph and point to the data:
 Horizontal axis: months, 1 square for each
month, total 12 squares.
 Left vertical axis: T (o C).
 Right vertical axis: Pp (mm).
–The value of the precipitations must be
twice that of the temperature at the same
height (5o C - 10 mm), if possible.
TO DRAW A CLIMOGRAPH
2. Indicate the
precipitation (rainfall)
data.
With the help of a ruler and looking at
the right vertical axis, we will indicate
with a line on each month the total
rainfall of that month.
Once indicated every month we will
complete the bars and color them blue.
TO DRAW A CLIMOGRAPH
3. Indicate the temperature
data
With the help of a ruler we transfer the
temperature data to the graph.
We will make a signal about each month in
the place that corresponds to the
temperatures.
When we have completed the twelve
months we will join the points with a red
line
TO DRAW A CLIMOGRAPH
4. Indicate the location
–We will complete the graph by writing
the location of the weather station to
which the data refer, if we know it.
ANALYSE A CLIMOGRAPH
1. Annual average temperature.
2. 𝑻𝑴𝑨 =
𝐓𝐣𝐚𝐧+𝐓𝐟𝐞𝐛+𝐓𝐦𝐚𝐫+𝐓𝐚𝐩𝐫+𝐓𝐦𝐚𝐲+𝐓𝐣𝐮𝐧+𝐓𝐣𝐮𝐥+𝐓𝐚𝐮𝐠+𝐓𝐬𝐞𝐩+𝐓𝐨𝐜𝐭+𝐓𝐧𝐨𝐯+𝐓𝐝𝐞𝐜
𝟏𝟐
(oC)
3. Total of precipitations.
4. 𝑻𝑷 = 𝐏𝐣𝐚𝐧 + 𝐏𝐟𝐞𝐛 + 𝐏𝐦𝐚𝐫 + 𝐏𝐚𝐩𝐫 + 𝐏𝐦𝐚𝐲 + 𝐏𝐣𝐮𝐧 + 𝐏𝐣𝐮𝐥 + 𝐏𝐚𝐮𝐠 +
𝐏𝐬𝐞𝐩 + 𝐏𝐨𝐜𝐭 + 𝐏𝐧𝐨𝐯 + 𝐏𝐝𝐞𝐜 (𝐦𝐦)
5. Months with maximum and minimum temperatures.
6. Temperature range (difference between the hottest and the coldest months).
7. Months with more and less precipitations.
8. Climate.
9. Possible localization (hemisphere and area).
10. Type of biomes (vegetation)
Climograma del clima ecuatorial
• Climogramas del clima tropical.
• Medio desértico
– Clima desértico
• Temperaturas
– Desiertos cálidos: elevadas
(hasta 50oC); grandes
diferencias día/noche.
– Desiertos fríos: veranos
muy cálidos e inviernos
muy fríos (10o C).
• Precipitaciones
– Escasas (<250 mm) e
irregulares.
– Gran evaporación.
• Medio oceánico
– Clima oceánico
• Temperaturas
– Entre 10 y 18º C.
– Suaves todo el año.
• Precipitaciones
– Abundantes (1000
mm) y regulares.
Climograma: clima mediterráneo
• Medio continental
– Clima continental
• Temperaturas
– Medias entre 0 y 10º C.
– Muy frías en invierno y cálidas en verano.
• Precipitaciones
– Entre 300 y 1000 mm anuales (menores más lejos
de la costa).
– Se concentran en verano.
• Medio polar
– Clima polar
• Temperaturas muy bajas:
– Medias por debajo de los 0º.
– En invierno hasta -40º/-50º C.
– El verano no existe (no llega a los
10º C).
• Precipitaciones muy escasas:
– Menos de 250 mm.
– En forma de nieve
• Fuertes vientos.
• Medio de alta montaña
– Clima de alta montaña
• Temperaturas:
– Descienden con la altitud (0,6º cada 100
m).
– Temperaturas bajas en invierno; suaves en
verano.
• Precipitaciones
– Aumentan con la altitud.
– Abundantes y regulares.
– Frecuentemente caen en forma de nieve.
• Most of its climates are temperate:
• Oceanic.
• Mediterranean.
• Continental
• We will also have cold climates:
• Polar climate
• High mountain or alpine climate.
• Climates are determined by physical factors:
• Latitude  Spain is in the temperate zone, in
the northern hemisphere.
• The relief  The average altitude of Spain is
over 650 meters. The relief influences the
regional varieties.
TIPOS DE CLIMAS
TIPOS DE CLIMAS
• Most of the Iberian Peninsula and the Balearic
Islands  Mediterranean climate.
– Maritime Mediterranean.
– Mediterranean continental or interior.
• Other climates:
– Oceanic.
– Subtropical.
– High mountain
ANÁLISIS DE UN PAISAJE
• Tipos de paisajes:
Paisaje natural  poco o nada modificado por el
hombre.
Paisaje transformado  Intervención notable del ser
humano.
Paisaje mixto  Conserva cierto equilibrio entre el
paisaje natural y la intervención humana. Ej: zonas
rurales poco habitadas.
Paisaje natural
Paisaje transformado
Paisaje mixto
• En un paisaje debemos distinguir:
Elementos naturales:
– Formas del relieve (montañas, formas litorales…)
– Elementos hidrográficos (ríos, aguas marinas,
lagos…)
– Formaciones vegetales (paisaje asociado…)
Elementos antrópicos (realizados por el ser
humano)
– Formas agrarias (tipos de cultivos…)
– Estructuras industriales y mineras.
– Asentamientos
– Infraestructuras de comunicación y transporte.
• Analizar el paisaje:
– Observar e identificar el paisaje.
– Análisis de los elementos del paisaje (naturales o
antrópicos).
– Conclusión  Valoración del tipo de paisaje y sus
riesgos.
Catástrofes
climáticas
Huracán (en Asia,
tifón o ciclón)
Fuerte borrasca
de forma espiral
Grandes vientos
(120-300 km/h)
Lluvias
torrenciales
(600 mm en
unas horas)
Tsunamis de 20
m
Se forma en los
océanos de
zonas tropicales
entre mayo y
noviembre
T elevada
(26º C)
Evaporación
Tormentas
Sequía
Largo periodo de
tiempo (> 1 año)
sin o escasas
precipitaciones
Afecta sobre
todo a zonas
semiáridas
(Cuerno de
África)
Son
impredecibles
Efectos
Desertización
Resecación de
plantas
Pérdida de
cosechas y
hambrunas
Aumento de la
contaminación
Reducción del
agua disponible
Inundaciones
Llueve mucho
en poco tiempo
La tierra no
puede absorber
esa agua
Los ríos se
desbordan
Efectos
devastadores
Muertes
Destrozos
materiales
Epidemias
Se ven
agravados por
Hormigón y
asfalto
Deforestación
Ampliación de
las zonas de
cultivo
CATÁSTROFES CLIMÁTICAS
Fotografía satélite de un huracán
Catástrofes
climáticas
Tornado
Torbellino de aire
que gira a gran
velocidad
Corta duración y
extensión
Granizo o
pedrisco
Precipitación en
estado sólido
La temperatura del
aire es inferior a 0º
Puede destrozar
cultivos e
infraestructuras
Incendios
forestales
Los bosques tardan
mucho en
regenerarse
- Vegetación

+ temperaturas y
- precipitaciones
7. Catástrofes climáticas
• Pág. 140-143 del libro. Resumen
• Ejercicios, pág. 144-145. 2, 3, 4, 5, 6, 7, 10.
• Pág. 146. 2.
• Pág. 147. 1, 2, 3, 4, 5, 10, 11.

THE ATMOSPHERE. WEATHER AND CLIMATE

  • 3.
    • The Earth’satmosphere is a protective layer of gas that surrounds the planet. • The atmosphere begins on the planet’s surface and is structured in layers. The atmosphere reaches an altitude of approximately 1.000 km. • It protects us from the sun’s rays. • It is composed by: – Oxygen. – Nitrogen. – Other gases: • Argon • Carbon dioxide
  • 4.
    CAPAS DE LAATMÓSFERA Es la capa de transición entre la atmósfera y el espacio También se llama ionosfera. Las partículas eléctricas reflejan las ondas de radio, la temperatura vuelve a aumentar. La temperatura desciende y presenta una baja densidad el aire. La temperatura aumenta. Y abunda el gas ozono En ella se desarrollan los fenómenos meteorológicos. Temperatura desciende con la altura
  • 5.
    THE TROPOSPHERE • Itis in contact with the surface of the Earth. It is almost all water vapour. • Here temperatures drop by 0.65 oC for every 100 m of altitude. • Most meteorological phenomena, such as cloud formation, wind and rain, occur here.
  • 6.
    • The airdoes not remain static. Their alterations cause meteorological phenomena, such as wind or humidity.
  • 7.
    THE STRATOSPHERE • Itcontains the ozone layer in the middle of it. This layer absorbs ultraviolet radiation and has very high temperatures.
  • 8.
    THE MESOSPHERE • Temperaturesin the mesosphere decreases as altitude increases. They sometimes reach -100 oC.
  • 9.
    THERMOSPHERE • Temperatures reachup to 1500 oC, where solar radiation produces electrically-charged, ionised gases. • It is the layer of the atmosphere in which the space shuttles operated.
  • 10.
    EXOSPHERE • It isthe outermost layer of atmosphere. It extends to the highest limits of the atmosphere where only molecules of helium and hydrogen are found. • The temperature may fall to -273.15 oC at night.
  • 12.
    • Air ismatter; it has mass, temperature and pressure. TEMPERATURE  When air is heated it expands, becomes lighter and rises.  Air temperature becomes colder as it gets further from the Earth’s surface. When it is cooler, the air begins to fall back towards the surface. ATMOSPHERIC PRESSURE  The gases in air have weight that presses down on the Earth’s surface. It is measured with a barometer.  Altitude and temperature determine atmospheric pressure. RELATIVE HUMIDITY • Relative humidity refers to the amount of water vapour that air contains. Warmer air can hold more water vapour, but all air temperatures have a maximum amount of water vapour. • We call air the set of gases in the atmosphere.
  • 14.
    WEATHER the stateof the lower layers of the atmosphere at a certain time and place on Earth. So, for example, if we say that one day it's hot or it's raining, we're referring to weather. Meteorology is the study of the atmosphere and the atmospheric phenomena that affect weather. CLIMATE refers to the state of the weather in a certain region of the planet over a long period of time, usually 30 years or more. So, when we say that in a place it is hot every day in summer, or that it rains a lot in winter, we are alluding to characteristics of its climate. Climatology is the study of climate.
  • 15.
    ELTIEMPO ATMOSFÉRICO esel estado de la atmósfera (sequedad, lluvia, calor, frío, etc.) en un lugar determinado del planeta y en un momento concreto. Así, por ejemplo, si decimos que un día hace calor o llueve, e s t a m o s r e f i r i é n d o n o s a l t i e m p o atmosférico. La METEOROLOGÍA es la ciencia que estudia los fenómenos que suceden en la atmósfera. EL CLIMA es la sucesión periódica y habitual de esos estados de la atmósfera en una zona de la Tierra, medida durante un largo período de tiempo. Así, cuando decimos que en un lugar hace calor todos los días en verano, o que llueve mucho en i n v i e r n o , e s t a m o s a l u d i e n d o a c a r a c t e r í s t i c a s d e su clima. La CLIMATOLOGÍA es la ciencia que estudia el clima, sus distintos tipos y su disposición.
  • 16.
    Tiempo y clima Tiempo Estado dela atmósfera en un lugar y en un momento concreto Hace calor, llueve Meteorología Ciencia que estudia los fenómenos de la atmósfera Clima Estado medio de la atmósfera en una región a lo largo de un periodo de tiempo (30 ó 40 años) Hace calor en verano, llueve mucho en invierno Climatología Ciencia que estudia el clima Sus elementos y factores, tipos y distribución
  • 17.
    MAPA DEL TIEMPO WEATHER= Atmospheric pressure + Temperature + Precipitations + Wind + + The WEATHER in one place and that is repeated throughout all the years in the same way, is the CLIMATE. MAPA CLIMAS DE EUROPA
  • 19.
    THE WEATHER FORECAST Inour country, the National Institute of Meteorology elaborates every day the weather map with the data received at land and sea stations (thanks to instruments such as the barometer, the anemometer, the rain gauge, etc.), and with the photograph sent by the Meteosat satellite. The satellites provide a systematic and real-time information of the most important weather conditions for weather prediction.
  • 20.
  • 21.
  • 22.
  • 23.
    Imagen realizada porel satélite Meteosat
  • 25.
    • The elementsthat make up a climate are atmospheric phenomena that can be measured and analysed. • The elements of the climate are:  Atmospheric pressure.  Wind.  Precipitation  Temperature.
  • 28.
    PRESIÓN ATMOSFÉRICA • Itis the weight of the air in the atmosphere, as a consequence of gravity, on a specific area of the Earth. • It is measured with an instrument called a barometer and expressed in millibars.
  • 30.
    • The airpressure is not the same throughout the Earth's surface. It depends on two factors: altitude and temperature. Atmospheric pressure Altitude Temperature
  • 31.
    • The higheraltitude, the lower atmospheric pressure. • The higher temperatura, the lower atmospheric pressure.
  • 33.
    • ISOBARS Lines that join points of equal atmospheric pressure on a map. • ANTICYCLONES Areas of high pressure (more than 1013 mb). They form when a mass of cold air descends and the pressure increases. They produce stable weather. • DEPRESSIONS  Areas of low pressure (less than 1013 mb). They form when a mass of warm air rises and the pressure decreases. They produce unstable weather. .
  • 38.
    Mapas del tiempo ●Representaciones del estado de la atmósfera en un lugar y momento determinado. ● Para interpretarlo, es necesario observar: o Centros de acción. o Distribución de las isobaras y gradiente de presión. o Frentes. Isobaras. Líneas que marcan puntos de igual presión. Frente frío (línea azul con triángulos). Frente cálido (línea roja con círculos). Gradiente de presión. •Diferencia de presión entre dos puntos. •Indica la fuerza del viento (mayor cuanto más próximas estén). Centros de acción Anticiclones (A) y Borrascas (B)
  • 40.
    • The windis a mass of air in motion. • It is caused by differences in atmospheric pressure. The air goes from the high pressure to the low pressure zones.
  • 41.
    • The windspeed is measured with the anemometer and is expressed in meters per second (m/s) or kilometers per hour (km/h). The weathercock or weather-vane indicates the direction of the wind.
  • 42.
    Viento Aire en movimiento Se originacuando hay diferencia de presión atmosférica El aire se desplaza de las altas (A) a las bajas presiones (B) Instrumentos de medición Veleta Señala la dirección Indica la procedencia Puede ser N, S, E, O Anemómetro Mide la velocidad Se mide en m/s o km/h
  • 43.
    • Types ofwinds: – Prevailing winds (Vientos constantes). They always blow in the same direction and in the same regions. – Periodic winds (Vientos estacionales). They vary depending on the season, such as monsoons. – Local winds (Vientos regionales o locales). are found in small areas. They usually blows in the same direction. Some examples in Spain are tramontane, galerna or cierzo.
  • 46.
    Globo con ladistribución de las presiones y los vientos
  • 48.
    AIR HUMIDITY • Itis the amount of water vapour that is in the air. • To measure the humidity of the air the hygrometer is used and when it marks 100% it is said that the air is saturated.
  • 49.
    • The humidityof the air comes from the evaporation of the water. • The water contained in the air masses is in the form of water vapour. • The amount of water in the air depends on the temperature: The higher the temperature, the greater the amount of water in the air mass.
  • 50.
    • Condensation: processby which the water vapour that contains a mass of air turns into liquid water when the mass rises and cools. • It produces rainfall or precipitations. In the form of rain, snow or hail.
  • 51.
    Rainfall or precipitationsis water that falls from the atmosphere to the earth's surface in the form of rain, snow, sleet or hail. To measure precipitation, the rain gauge (pluviómetro) is used and is expressed in litres por m2 (l/m2) or in mm.
  • 52.
    An isohyet orisohyetal line is a line joining points of equal precipitation on a map. A map with isohyets is called an isohyetal map.
  • 53.
    TYPES OF PRECIPITATION •Convection rainfall (Lluvias de convección) • Frontal rainfall (Lluvias de frente) • Relief rainfall (Lluvias de relieve) 1. El sol evapora el agua del suelo h ú m e d o . 2 . A l ascender el v a p o r d e a g u a s e e n f r í a . 3. El vapor de a g u a , a l enfriarse, se c o n d e n s a f o r m a n d o n u b e s , q u e p r o v o c a n l l u v i a s . Por Evaporación o convección 1 . L l e g a a i r e caliente y s e e n c u e n t r a c o n u n a m o n t a ñ a . 2 . E l a i r e asciende y s e e n f r í a . 3 . S e f o r m a n n u b e s y l l u e v e . Por Relieve 1. Una masa d e a i r e caliente y h ú m e d o s e e n c u e n t r a c o n u n a m a s a d e aire frío. 2. La masa de aire caliente p e s a m e n o s y a s c i e n d e p o r encima de la de a i r e f r í o , e n f r i á n d o s e . 3 . S e f o r m a n n u b e s y llueve. Por Frentes
  • 55.
    • The Earth'ssurface is heated by the sun's rays. • The Earth's surface radiates heat and heats the masses of air that are in contact with it. • Isotherm map  map with lines joining the places with identical thermal values.
  • 56.
  • 58.
    PHYSICAL FACTORS THATINFLUENCE TEMPERATURE • The regulatory action of the sea  The sea cools and warms more slowly than the Earth. Temperatures in coastal areas are milder. • The altitude  Every 100 m in height, the temperature decreases by 0.6 ° C. • The latitude  The temperature decreases as we move away from the Equator and we approach the Poles.
  • 63.
    • The Earthis divided into climatic zones or regions, depending on temperatures and rainfall. Two cold climate zones. Two temperate climate zones. One hot climate zone.
  • 65.
    TROPICAL OR HOTCLIMATIC ZONE • Located between the two tropics: it receives the name of intertropical zone. • High temperatures, more than 18o C of annual average. • It is due to the perpendicular incidence of the sun's rays, most of the year.
  • 66.
    TEMPERATE CLIMATIC ZONES •Located between the tropics and the polar circles. • The solar rays arrive more inclined. • The average temperatures are between 0 and 18o C. • A cold season (winter), another hot (summer) and two intermediate: spring and autumn.
  • 68.
    • Since thereis a temperate zone in each hemisphere  the seasons are interchanged. • When in the northern hemisphere it is summer, in the south it is winter.
  • 69.
    COLD CLIMATIC ZONES •Located between the polar circles and the poles. • The incidence of solar rays is very oblique. • Annual temperatures lower than 0o C.
  • 71.
    • Rainy climate:more than 800 l/m2 per year. • Intermediate climate: 300-800 l/m2 per year. • Dry climate: less than 300 l/m2 per year.
  • 73.
    • The combinationof annual temperature and precipitation data results in nine different climate types.
  • 77.
    CLIMA POLAR • Temperaturesbelow 0o C. • Little rainfall, not exceeding 200 mm, almost always in the form of snow. • Between the polar circles and the poles. • Landscape: permafrost (permanently frozen ground), with extensive glaciers or indlandsis and the layer of ice that covers the oceans, called ice field (banquisa). In summer, when the ice melts, tundra (landscape composed of shrubs, lichens and mosses). • Wildlife: polar bears, penguins, sea lions, seals ...
  • 79.
    • Polar environment –Location in polar areas: • Arctic Circle. • Antarctic polar circle. • They represent 25% of the land area.
  • 81.
    • Polar environment –Rivers • There are no rivers, but ice: – In the Arctic, the ice sheet or banquisa is 5 m thick. – In the Antarctic, the inlandsis or ice cap, 2,000 m thick on the continent.
  • 82.
    • Polar environment –Vegetation • The cold and the frozen ground (permafrost) prevents the vegetation. • Tundra: at lower latitudes, the ice-free land is covered with mosses, lichens and some shrubs.
  • 83.
  • 84.
    • Polar biome –Fauna:  Limited.  Species of thick fur skins (bears, reindeer)  Fat species (seals, penguins).
  • 85.
    • Polar biome –Population: • Only 0.02% of the world's population lives there. • In the Arctic zone: Eskimos or Inuit (America) and Lapps (Scandinavia). • In Antarctica, only scientific bases.
  • 87.
    ALPINE CLIMATE /CLIMA DE ALTA MONTAÑA • Cold winters and cool summers. • Abundant rainfall, exceeding 1500 mm and throughout the year. • It is located in the main mountain systems. • Stepped landscape: in areas of lower height, coniferous forests and deciduous forests; from 2500 m, bushes and meadows; from 3500 m, naked rock and perpetual snow.
  • 90.
    • Alpine biome –Location • Great mountain ranges: Himalayas (Asia), Andes (America) and Alps (Europe). • It is considered high mountain above 2500 m, although it varies throughout the planet.
  • 92.
    • Alpine biome –Rivers • In the mountains are the upper course of rivers: of great slope and erosive force. • In the highest areas: glaciers.
  • 93.
    • Alpine biome –Vegetation • Staggered in floors according to altitude: crops, deciduous forests, coniferous forests, meadows, rock and perpetual snow. • Varies according to the slope of sun and shade.
  • 94.
    • Alpine biome –Fauna • High mountain species: birds of prey, mountain goats, chamois, marmot ..
  • 95.
    • Alpine biome –Population • Half inhabited (except in valleys). • Livestock and agricultural activity. • Exploitation of forests. • Tourism and leisure (skiing, mountaineering ...).
  • 99.
    EQUATORIAL CLIMATE • Verywarm temperatures: above 22o C all year round. Average of 25o C without differences between day and night. • Abundant and regular rainfall every month of the year. Superior to 1500 or 2000 mm per year. • It is located north and south of the Equator. • Landscape: jungle and mangroves (swamp areas). • Animals: showy birds, amphibians and reptiles, lots of insects.
  • 100.
  • 101.
    Jungle / Selvaecuatorial
  • 102.
    • Equatorial biome –Location • Around the Equator. • Central America and the Amazon Basin, the Congo Basin and Guinea Coast (Africa), Southeast of Asia.
  • 104.
    • Equatorial biome – Rivers •Regular and large (Amazonas and Congo). • They drag a lot of materials.
  • 105.
    • Equatorial biome –Vegetation • Jungle (en Asia, jungla). – Dense forest of diverse species of great height (up to 80 m) like ebony, mahogany ... – Undergrowth, dark and humid (ferns, mimosas, mosses). – Eg Amazon.
  • 106.
  • 107.
  • 108.
    • Equatorial biome – Fauna •Varied: mammals (jaguar, apes), reptiles (snakes), amphibians, birds and insects.
  • 109.
    • Equatorial biome –Population • Almost uninhabited in Africa and America, where there are primitive peoples (Pygmies, Yanomami). – The population is concentrated in the coast, the plateaus and average mountain slopes. • In Asia, very populated by plantations (rice, tea ...).
  • 111.
    TROPICAL CLIMATE • Temperaturesabove 20o C all year round. • It has two seasons: one rainy and one dry. • Very abundant rains. • It is located on both sides of the equatorial zone: central plateaus of Africa, regions of South America, northern Australia and areas of South and Southeast Asia. • Most characteristic landscape: savannah. • Fauna: large herbivores, such as elephants, giraffes ...; big carnivores, like lions, leopards; scavengers, like hyenas ...
  • 114.
    • Tropical biome –Location • Around the tropics. • Central and South America. • South Asia and Australia. • Central and South Africa.
  • 116.
    • Tropical biome –Rivers • Irregular • They depend on the seasons: high water / low water (Zambezi, Nile). • Sometimes, catastrophic floods.
  • 117.
    • Tropical biome Vegetation –Savannah  Huge plain of tall, thick grasses, bushes and scattered deciduous trees (acacias, baobab).  Green and leafy in wet season; yellow and withered in the dry. – It degrades in the steppe. – On the banks of rivers, forest-gallery like those of the jungle.
  • 118.
  • 119.
  • 120.
    • Tropical biome –Fauna • Rich in large herbivores (elephants, giraffes, zebras ...) and carnivores (lions, hyenas…)
  • 121.
    • Tropical biome –Population • It is concentrated on the coast and banks of rivers. • Traditional shepherd peoples: Masai and Kikuyus (Kenya), Podokos (Cameroon), Serere (Senegal). • Monoculture plantations (cocoa, coffee, sugar, tobacco ...).
  • 122.
    MONSOON CLIMATE /CHINESE CLIMATE • It is a tropical variety. • Conditioned by monsoon winds. • The rainy season can exceed 2000 mm. • It occurs in Southeast Asia.
  • 124.
    DESERT CLIMATE • Ithas very high temperatures (annual average above 20o C), with strong contrasts between day and night. • Very little rainfall, does not exceed 250 mm. • They are located in areas close to the tropics. • Xerophilous vegetation (with thorns instead of leaves and capable of storing water - cactus). Sometimes with oasis. • Scarce fauna: reptiles, insects, birds and small mammals. In addition to camels and dromedaries.
  • 125.
  • 127.
    • Desert biome –Location  Tropical deserts – Sáhara – Arabia – Kalahari  Coastal deserts – Atacama – Namibia – Gran Desierto de Arena  Interior deserts – Gobi – Colorado
  • 129.
    • Desert biome –Rivers • There are no rivers, only ouadis: they carry water only when it rains.
  • 130.
    • Desert biome –Vegetation • Scarce and adapted to aridity (thorny shrubs and cactus). • In oases (areas where there is water) there are palm trees and fruit trees.
  • 131.
    • Desert biome –Fauna • Scarce and adapted to aridity: camels, dromedarie s, reptiles, rodents, insects.
  • 132.
    • Desert biome –Population • Almost uninhabited (<2% of the world's population). • Primitive peoples: Bushmen (Kalahari); or nomadic shepherds: tuareg (Sahara), Bedouin (Arabia). • Exploitation of gas and oil.
  • 135.
    OCEANIC OR ATLANTICCLIMATE • Soft temperatures throughout the year. With thermal amplitude less than 15o C. • Abundant rainfall, above 800 mm, spread over all seasons. • It is situated on the western facades of the European Atlantic coasts and in some areas of the Pacific coast. • Landscape: oceanic forest with deciduous trees (oak, beech, elm and chestnut), meadows. • Fauna: large herbivores (deer) and predators (bears, wolves, foxes), as well as birds, rodents, reptiles ...
  • 137.
    • Oceanic biome –Location • Parallel 40-60o N and S: western coasts of Europe and North America; SO coast of South America, SE coast of Australia, Tasmania and New Zealand.
  • 139.
    • Oceanic biome –Rivers • With abundant and regular flow. • Thames, Loire, Rhin.
  • 140.
    • Oceanic biome –Vegetation • Forests deciduous or deciduous (oak, chestnut, beech, ash ...).
  • 141.
    • Oceanic biome –Vegetation • It degrades in: – Landa with bushes and bushes (heather and broom). – Meadows, in coastal and mountainous areas.
  • 142.
    • Oceanic biome –Fauna • Abundant (mammals, migratory birds).
  • 143.
    • Oceanic biome –Population • In Europe it is a very inhabited and transformed medium (agriculture, cities, industries, communications ...). • In America and Oceania, it is less inhabited.
  • 145.
    CLIMA MEDITERRÁNEO • Itsaverage temperature ranges between 15 and 20o C, without large temperature variations. Soft all year round. Hot summers and mild winters. • Little rainfall, less than 700 mm, especially in autumn and spring, very scarce in summer and winter. • Location: Mediterranean coast, South coast of Australia, America in the Pacific and Africa. • Landscape: Mediterranean forest, with evergreen trees (holm oak, cork oak, pine). Shrubs such as garrigue, rockrose (jaras) and aromatic bushes (rosemary, thyme).
  • 148.
    • Mediterranean biome –Rivers • Low flow (especially in summer) and irregular (Segura, Tíber). • Floods and floods are frequent due to heavy rains.
  • 149.
    • Mediterranean biome –Vegetation • Mediterranean forest, with evergreen trees (oak, cork, pine), low, thick and hard leaves. • It degrades in maquis and garrigue of odorous plants (rockrose, lavender, thyme, rosemary, lavender).
  • 150.
  • 151.
  • 152.
  • 153.
    • Mediterranean biome – Fauna •Abundant: small mammals, birds, reptiles, insects.
  • 154.
    • Mediterranean biome Population –Very inhabited and transformed environment. – They are given:  Rainfed crops (wheat, vine, olive) and pasture areas in the interior.  Irrigated crops (vegetables, vegetables, fruits) near rivers, on the coast and greenhouses. – Development of tourism.
  • 156.
    CONTINENTAL CLIMATE • Warmsummers and very cold winters, with temperatures below 0o C. • Precipitation between 300 and 700 mm (more frequent in summer). • Areas of the interior of the continents. • Landscapes: meadows with tall grasses, steppes (with small shrubs and low grass), conifers. In very cold areas, taiga (coniferous forests and large meadows).
  • 157.
    • Continental biome –Location • Inland lands of Europe, Asia and North America, in places far from the large bodies of water and their regulatory effects.
  • 158.
    • Continental biome –Rivers • Long and flowing (Volga, Yukon). • Ice cream in the coldest areas in winter. • In spring they suffer great swellings due to the thaw.
  • 159.
    • Continental biome –Vegetation • Taiga or coniferous forest, with evergreen trees (firs, pines, larches). • Meadows in less cold and wetter areas, composed of tall grasses. • Steppes in warmer and drier areas, with smaller herbs.
  • 161.
    • Continental biome – Fauna •Large mammals: bears, moose, wolves ... • Great rodents: martens, beavers, minks ...
  • 162.
    • Continental biome –Population • Lumber and infrastructure are concentrated in the taiga, although the population is scarce. • The grasslands are more populated and are dedicated to the cultivation or to the raising of cattle.
  • 167.
    • A climographis a graphic representation of the temperatures and rainfall of a given place over a year.
  • 168.
    1. Draw theaxes –On a graph paper, we draw the axes of the climograph and point to the data:  Horizontal axis: months, 1 square for each month, total 12 squares.  Left vertical axis: T (o C).  Right vertical axis: Pp (mm). –The value of the precipitations must be twice that of the temperature at the same height (5o C - 10 mm), if possible. TO DRAW A CLIMOGRAPH
  • 169.
    2. Indicate the precipitation(rainfall) data. With the help of a ruler and looking at the right vertical axis, we will indicate with a line on each month the total rainfall of that month. Once indicated every month we will complete the bars and color them blue. TO DRAW A CLIMOGRAPH
  • 170.
    3. Indicate thetemperature data With the help of a ruler we transfer the temperature data to the graph. We will make a signal about each month in the place that corresponds to the temperatures. When we have completed the twelve months we will join the points with a red line TO DRAW A CLIMOGRAPH
  • 171.
    TO DRAW ACLIMOGRAPH 4. Indicate the location –We will complete the graph by writing the location of the weather station to which the data refer, if we know it.
  • 172.
    ANALYSE A CLIMOGRAPH 1.Annual average temperature. 2. 𝑻𝑴𝑨 = 𝐓𝐣𝐚𝐧+𝐓𝐟𝐞𝐛+𝐓𝐦𝐚𝐫+𝐓𝐚𝐩𝐫+𝐓𝐦𝐚𝐲+𝐓𝐣𝐮𝐧+𝐓𝐣𝐮𝐥+𝐓𝐚𝐮𝐠+𝐓𝐬𝐞𝐩+𝐓𝐨𝐜𝐭+𝐓𝐧𝐨𝐯+𝐓𝐝𝐞𝐜 𝟏𝟐 (oC) 3. Total of precipitations. 4. 𝑻𝑷 = 𝐏𝐣𝐚𝐧 + 𝐏𝐟𝐞𝐛 + 𝐏𝐦𝐚𝐫 + 𝐏𝐚𝐩𝐫 + 𝐏𝐦𝐚𝐲 + 𝐏𝐣𝐮𝐧 + 𝐏𝐣𝐮𝐥 + 𝐏𝐚𝐮𝐠 + 𝐏𝐬𝐞𝐩 + 𝐏𝐨𝐜𝐭 + 𝐏𝐧𝐨𝐯 + 𝐏𝐝𝐞𝐜 (𝐦𝐦) 5. Months with maximum and minimum temperatures. 6. Temperature range (difference between the hottest and the coldest months). 7. Months with more and less precipitations. 8. Climate. 9. Possible localization (hemisphere and area). 10. Type of biomes (vegetation)
  • 173.
  • 174.
    • Climogramas delclima tropical.
  • 175.
    • Medio desértico –Clima desértico • Temperaturas – Desiertos cálidos: elevadas (hasta 50oC); grandes diferencias día/noche. – Desiertos fríos: veranos muy cálidos e inviernos muy fríos (10o C). • Precipitaciones – Escasas (<250 mm) e irregulares. – Gran evaporación.
  • 176.
    • Medio oceánico –Clima oceánico • Temperaturas – Entre 10 y 18º C. – Suaves todo el año. • Precipitaciones – Abundantes (1000 mm) y regulares.
  • 177.
  • 178.
    • Medio continental –Clima continental • Temperaturas – Medias entre 0 y 10º C. – Muy frías en invierno y cálidas en verano. • Precipitaciones – Entre 300 y 1000 mm anuales (menores más lejos de la costa). – Se concentran en verano.
  • 179.
    • Medio polar –Clima polar • Temperaturas muy bajas: – Medias por debajo de los 0º. – En invierno hasta -40º/-50º C. – El verano no existe (no llega a los 10º C). • Precipitaciones muy escasas: – Menos de 250 mm. – En forma de nieve • Fuertes vientos.
  • 180.
    • Medio dealta montaña – Clima de alta montaña • Temperaturas: – Descienden con la altitud (0,6º cada 100 m). – Temperaturas bajas en invierno; suaves en verano. • Precipitaciones – Aumentan con la altitud. – Abundantes y regulares. – Frecuentemente caen en forma de nieve.
  • 182.
    • Most ofits climates are temperate: • Oceanic. • Mediterranean. • Continental • We will also have cold climates: • Polar climate • High mountain or alpine climate.
  • 185.
    • Climates aredetermined by physical factors: • Latitude  Spain is in the temperate zone, in the northern hemisphere. • The relief  The average altitude of Spain is over 650 meters. The relief influences the regional varieties.
  • 186.
  • 187.
    TIPOS DE CLIMAS •Most of the Iberian Peninsula and the Balearic Islands  Mediterranean climate. – Maritime Mediterranean. – Mediterranean continental or interior. • Other climates: – Oceanic. – Subtropical. – High mountain
  • 190.
    ANÁLISIS DE UNPAISAJE • Tipos de paisajes: Paisaje natural  poco o nada modificado por el hombre. Paisaje transformado  Intervención notable del ser humano. Paisaje mixto  Conserva cierto equilibrio entre el paisaje natural y la intervención humana. Ej: zonas rurales poco habitadas.
  • 191.
  • 192.
  • 193.
  • 194.
    • En unpaisaje debemos distinguir: Elementos naturales: – Formas del relieve (montañas, formas litorales…) – Elementos hidrográficos (ríos, aguas marinas, lagos…) – Formaciones vegetales (paisaje asociado…) Elementos antrópicos (realizados por el ser humano) – Formas agrarias (tipos de cultivos…) – Estructuras industriales y mineras. – Asentamientos – Infraestructuras de comunicación y transporte.
  • 195.
    • Analizar elpaisaje: – Observar e identificar el paisaje. – Análisis de los elementos del paisaje (naturales o antrópicos). – Conclusión  Valoración del tipo de paisaje y sus riesgos.
  • 196.
    Catástrofes climáticas Huracán (en Asia, tifóno ciclón) Fuerte borrasca de forma espiral Grandes vientos (120-300 km/h) Lluvias torrenciales (600 mm en unas horas) Tsunamis de 20 m Se forma en los océanos de zonas tropicales entre mayo y noviembre T elevada (26º C) Evaporación Tormentas Sequía Largo periodo de tiempo (> 1 año) sin o escasas precipitaciones Afecta sobre todo a zonas semiáridas (Cuerno de África) Son impredecibles Efectos Desertización Resecación de plantas Pérdida de cosechas y hambrunas Aumento de la contaminación Reducción del agua disponible Inundaciones Llueve mucho en poco tiempo La tierra no puede absorber esa agua Los ríos se desbordan Efectos devastadores Muertes Destrozos materiales Epidemias Se ven agravados por Hormigón y asfalto Deforestación Ampliación de las zonas de cultivo CATÁSTROFES CLIMÁTICAS
  • 197.
  • 198.
    Catástrofes climáticas Tornado Torbellino de aire quegira a gran velocidad Corta duración y extensión Granizo o pedrisco Precipitación en estado sólido La temperatura del aire es inferior a 0º Puede destrozar cultivos e infraestructuras Incendios forestales Los bosques tardan mucho en regenerarse - Vegetación  + temperaturas y - precipitaciones 7. Catástrofes climáticas
  • 201.
    • Pág. 140-143del libro. Resumen • Ejercicios, pág. 144-145. 2, 3, 4, 5, 6, 7, 10. • Pág. 146. 2. • Pág. 147. 1, 2, 3, 4, 5, 10, 11.