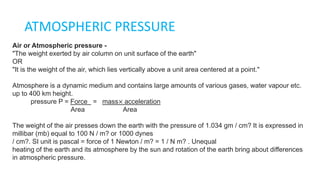
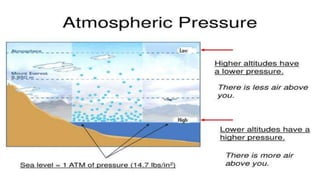
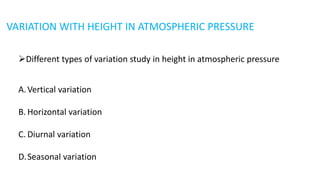
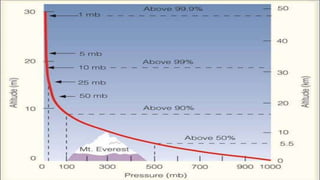
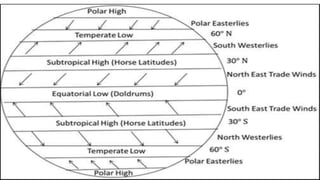
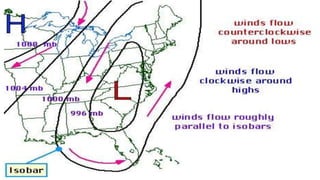
1. INTRODUCTORY AGRO-METROLOGY
AND CLIMATE CHANGE
(AGRO-112)
Sharadchandraji Pawar institute Of Agricultural Sciences
Mr. Kaival J Patel
Assistant Professor
Department ofAgronomy
Sharadchandraji Pawar institute Of
Agricultural Sciences, Ratnagiri.
Sharadchandraji Pawar institute Of Agricultural Sciences
3. ATMOSPHERIC PRESSURE
Air or Atmospheric pressure -
"The weight exerted by air column on unit surface of the earth"
OR
"It is the weight of the air, which lies vertically above a unit area centered at a point."
Atmosphere is a dynamic medium and contains large amounts of various gases, water vapour etc.
up to 400 km height.
pressure P = Force = mass× acceleration
Area Area
The weight of the air presses down the earth with the pressure of 1.034 gm / cm? It is expressed in
millibar (mb) equal to 100 N / m? or 1000 dynes
/ cm?. SI unit is pascal = force of 1 Newton / m? = 1 / N m? . Unequal
heating of the earth and its atmosphere by the sun and rotation of the earth bring about differences
in atmospheric pressure.
4.
5. VARIATION WITH HEIGHT IN ATMOSPHERIC PRESSURE
Different types of variation study in height in atmospheric pressure
A.Vertical variation
B. Horizontal variation
C. Diurnal variation
D.Seasonal variation
6. A) Vertical variation
A Density or mass of air influence the pressure. The density of air depends on its
temperature. Its composition and force of gravity.
Density of air decreases with increase in height, so the pressure also decreases with
increase in height.
At sea level the air column exerts its full pressure, but when we stand on a hill or when
we go in the upper layers of atmosphere, we leave a portion of air which cannot exert
its full pressure.
At sea level, a coastal town enjoys high pressure but on high altitude one will register a
low pressure.
For every 10 m of ascend, the pressure gets reduced by 1 h pa. or we can say that
pressure decreases on an average at the rate of about 34 millibars per every 300
meters height.
7.
8. B) Horizontal variation
• The horizontal variation of atmospheric pressure depends temperature, water vapour, latitude and
land and water relationship. When temperature is high the pressure is low and vice-versa, water
vapour in the air makes the air mass lighter.
• The shape of the earth is not uniform and subjected to uneven distribution of solar radiation, when it
revolves around the sun, it results in the contrast in air temperature which is responsible for
variations in atmospheric pressure systems, that is called as standard atmospheric pressure
systems or belts. There are total seven different pressure belts on the earth's surface those are as
given below:
1.Equatorial trough of low pressure (Between 5° N & 5° S)
2.Subtropical high pressure belt
(Northern hemisph.) (25° & 35°N)
3.Subtropical high pressure belt
(Southern hemisphere) (25° & 35°S)
4.Subpolar low-pressure belt
(Northern hemisphere (60° and 70° N)
5.Subpolar low-pressure belt
(Southern hemisphere) (60° and 70° S)
6.Polar high (Northern hemisphere)
7.Polar high (Southern hemisphere)
9.
10. C)Diurnal variation
At a given station the pressure shows two highs and two
lows.
Two maximums - one at 10 A.M. & Another at 10 P.M.
Two minimums - One at 4.00 P.M.&Second at 4.00 A.M.
Air expansion and die calracion are main reasons for diurnal
variations in the air pressure.
This variation is more prominent near the equator than at the
mid
Equatorial regions absorbs more heat than it loses while the
polar region gives up more heat than they receive.
11. D) Seasonal variation
Due to annual variation in the amount of incoming solar
radiation, distinct seasonal pressure variations are observed.
Tropical region shows these variation in large as compared
to the mid latitude and Polar Regions.
Over land high pressure is recorded during the cold season
and over the sea during the warm season.
12. Isobars
The distribution of pressure is represented on maps by isobars.
Isobars are defined as the imaginary lines drawn on a map to join
places having the same atmospheric pressure. Such lines are drawn by
reducing the pressures at sea level to eliminate the effect of altitude on
pressure. If the isobars are closely spaced it indicates rapid or steep
change in pressure.
If widely spaced, a slow change in pressure is indicated and two
isobars never cross each others. Isobars are drawn at pressure
intervals of 2,3,4 or 5 millibars.
Isobars assume different shapes as depression, secondary depression,
trough, anticyclones, ridge and col and straight isobars.
13.
14. Pressure gradient
The rate of decrease of pressure in space at a given time is called as pressure
gradient.
The pressure gradient force (PGF) like any other force has a magnitude and a
direction/Direction-the pressure gradient force direction is always directed from
high to low pressure and is always perpendicular to the isobars/Magnitude - is
determined by computing the pressure gradient.
This exerts a force on air particle and is important in determing the strength of
wind.
Pressure gradient is expressed in decrease in pressure per unit horizontal
distance as mb/100 m