SlideShare a Scribd company logo
1 of 141
Climate modeling lectures
Chapter 1: Global Climate System
Chapter 2: Basics of Climate change
Chapter 3: Climate Modeling
Chapter 4: Practicals
- Get familiarised with the science of climate
- Know how the Climate System works
- Understand the problematic of climate change
- Acquire some basics on climate change
- Able to understand, process and analyze climate
models output
 Learning outcomes
Why study climate?
• Studying climate is important?
• Because its changes will affect people around the world:
 Increasing global temperatures are expected to rise sea levels,
increase extreme events and change other local climate conditions.
 Regional climate change could alter forests, crop yields, and water
supply and demand.
It could also affect human health, animals and plants, and many
types of ecosystems.
Weather Vs. Climate
• The difference between weather and climate is a measure of timescale
• Weather is the state of the atmosphere, land, and ocean conditions on a day in a
particular place
• It is measured in terms of temperature, humidity, precipitation, cloudiness,
visibility, wind, and atmospheric pressure
• Climate is the average weather in a location over a long period of time (30 years
or more)
• Climate is what you expect, like a very hot summer. Weather is what you get,
like a hot day with thunderstorms.
• When you travel, Climate decides what to pack and Weather will tell you
whether to put on short sleeves tee-shirt or jacket.
Chapter 1
The Global Climate System
Dr. Mouhamadou Bamba SYLLA
AIMS-Canada Research Chair in Climate Change Science
AIMS-Rwanda Center, Kigali, Rwanda
Our HOME
II.1/ The different components
-The Atmosphere
-The Ocean
-The Land Surface
-The Chryosphere
-The Biosphere
The climate system is a highly non-linear coupled system whose
components interact on a wide range of spatial and temporal scales
Cross section view
II.1/ The different components
9
Some useful definitions
- Black Body: any object that is a perfect emitter and a perfect
absorber of radiation
- Radiation: energy that travels and spreads out as it goes
- Wavelength: distance between successive crests of a wave
- Spectrum: a bunch of types of radiation
Some useful definitions
II.1.1. The Atmosphere
- Composition (Gas)
Gas Name (*variable) Formula Percent Volume
Nitrogen N2 78.08%
Oxygen O2 20.95%
*Water Vapor H2O 0 to 4%
Argon Ar 0.93%
*Carbon Dioxide CO2 0.0360%
Neon Ne 0.0018%
Helium He 0.0005%
*Methane CH4 0.00017%
Hydrogen H2 0.00005%
*Nitrous Oxide N2O 0.00003%
*Ozone O3 0.000004%
Blackbody radiation curves & absorption
of radiation at each wavelength
Fraction of radiation absorbed at each
wavelength as it passes through whole
depth of atmosphere
Fraction absorbed above 11 km
- Atmospheric Absorption Spectrum
II.1.1. The Atmosphere
SUN
EARTH
13
- Atmospheric Absorption Spectrum
II.1.1. The Atmosphere
Most Absorbant gases
• O3 and O2 in the UV
• H2O, N2O, CO2, CH4 in the IR
Minor constituents
Transparent in the VIS
Opaque in the UV
Less opaque in the IR
 N2??? NO EFFECT !!!
Some basic concepts
 Mass: Amount of matter an object contains. Expressed in grams or kilograms (g or kg)
 Force: Push or pull, any interaction that change the motion of an object
- Move an object from rest
- Change the speed of a moving body
- Change the direction
- Change the shape
- Expressed in N (i.e. kgf)
As long as the amount of matter does not change, its mass remains
constant --- regardless of location.
Example: gravity force -- mg
r
mGM
F E
G 
 2
ME: Mass of the Earth = 5.98*1024 kg
G=gravitational constant=6.67x10⁻¹¹ Nm2kg2
Some basic concepts
 Weight: Weight is the force on an object to the gravitational acceleration
a measure of the force of gravity pulling down on an object
W=m*g ---- (Weight = mass * gravity acceleration)
 Density: is the mass per unit volume. Expressed in kg/m3
V
m


Some basic concepts
 Density: is the mass per unit volume. Expressed in kg/m3
Density DECREASES when:
Mass decreases or volume increases
Density INCREASES when:
Mass increases or volume decreases
a
b
Original box
Add more mass
Decrease the volume
Some basic concepts
 Pressure: Pressure is the force per unit area. It is expressed in Pascal (Pa).
A
F
P 
The typical unit of atmospheric pressure is millibars (mb)
1 Pa = 0.01 mb (SI unit of pressure from above)
Some basic concepts
 Heat capacity: Amount of energy required to change the temperature of a material
c=
𝑑𝑄
𝑚𝑑𝑇
C is expressed as J/kgoC
T: temperature oC
dQ: change in energy J/kg
m: masse (kg)
II.1.1. The Atmosphere
The Atmosphere is shallow
Determined by the
GRAVITY FORCE!
mg
r
mGM
F E
G 
 2
ME: Mass of the Earth = 5.98*1024 kg
G=gravitational constant=6.67x10⁻¹¹ Nm2kg2
- Atmospheric Mass
 Atmospheric pressure is the weight of
air molecules above you
 Pressure decreases with altitude
because there are less air molecules
above you as you rise
 As a result of pressure changes,
Temperature, Density, and Volume
change too as you rise
- Atmospheric Pressure and Layers
I.1.1. The Atmosphere
- Thickness of a Layer?
I.1.1. The Atmosphere
• Start with a column of air
• The base of this column is at the
surface, so lets say its pressure is
about 1000mb
• The top of this column is quite high.
Let’s say that its pressure is 500mb
• This column has some thickness: it is
h (some distance between 1000 mb
and 500 mb)
1000 mb
500 mb
h
• If we heat the column of air, it will
expand, warm air is less dense
• The thickness of the column will
increase
• 500 mb is now farther from the
ground
1000 mb
500 mb
Warmer
I.1.1. The Atmosphere
- Thickness of a Layer?
h’
• If we cool the column of air, it will
shrink, cool air is more dense
• The thickness of the column will
decrease
• 500mb is now closer to the ground
1000 mb
500 mb
Colder
- Thickness of a Layer?
I.1.1. The Atmosphere
• In fact, temperature is the
ONLY factor in the
atmosphere that determines
the thickness of a layer
• It wouldn’t have mattered
which pressure we had
chosen. They are all higher
above the ground when it is
warmer.
I.1.1. The Atmosphere
- Thickness of a Layer?
• At the poles, 700 mb is quite low
to the ground
• These layers are not very “thick”
• In the tropics, 700mb is much
higher above the ground
• See how “thick” these layers are
I.1.1. The Atmosphere
- Thickness of a Layer?
I.1.1. The Atmosphere
- Stratification of the Atmosphere
• Divided up according to
pressure: 500 mb layer is about
halfway up
• Divided up according to
temperature. It does not follow a
simple relationship with height
• Averaging out temperature values
in the atmosphere, four layers are
identified
I.1.1. The Atmosphere
- Atmospheric Layers
 Troposphere: temperature
decreases with height
 Stratosphere: temperature
increases with height
 Mesosphere: temperature
decreases with height
 Thermosphere: temperature
increases with height
I.1.1. The Atmosphere
- Atmospheric Layers
Troposphere:
 From the surface up to about 12km
 Its height varies with latitude and
season: higher in Summer, and in the
tropics
 Temperature decreases with height
because the troposphere is heated by the
surface and not directly by sunlight:
Adiabatic Expansion
I.1.1. The Atmosphere
- Atmospheric Layers
Stratosphere:
 Between about 12km and 50km,
includes the Ozone layer
 Temperature increases with height
because the Ozone layer absorbs
ultraviolet radiation and warms up
 Lack of mixing and turbulence
Very little exchange occurs between
the stratosphere and troposphere (but it is
important where it does)
I.1.1. The Atmosphere
- Atmospheric Layers
Mesosphere:
 Between 50km and 85km. Temperature
decreases with height because of decreased
solar heating and increased CO2 radiative
emission
Thermosphere:
From 80km. Temperature increases with
height because of high energy radiation
being absorbed by gases, Solar winds,
interaction Sun-charged particles
31
I.1.1. The Atmosphere
- Weather events location
All the weather
phenomenon and
events occur in the
Troposphere
I.1.2. The Ocean
- One Ocean: 5 Basins
• 71% of the World
• Pacific is the largest
• More than 60% of people
live along the coast
I.1.2. The Ocean
- Some Characteristics
• Ocean water has a higher
Heat Capacity than Land
• Ocean water heats up and
cools down slower than
Land
• Contrasting heating
between Land and Ocean
for a whole day and
whole year
• Sea and Land breezes,
Monsoons …
I.1.2. The Ocean
Water reservoir: unlimited
water source for evaporation
Heat reservoir: absorbs a lot of
heat increasing less the
temperature of the global
climate system – in comparison
to the Land
Carbon reservoir: a sink for
Atmospheric Carbon Dioxide,
helps to decrease GHG effects
- Some Characteristics
- Water Column
I.1.2. The Ocean
Based Temperature and Salinity Density
Mixed layer
Thermocline
Halocline
Pycnocline
Deep layer (Abyss)
- The Mixed Layer
I.1.2. The Ocean
 Warm, less dense
 Mixed by the wind
 Heat Exchange
 Evaporation and Precipitation
Approx. Upper 50-200 m
 Wind-driven circulation
I.1.2. The Ocean
 Approx. between 100-200m and 1000 m
 Zone of strong gradients
 Barrier to mixing: Temp, Salinity and
Density change very fast
 Variations with latitude and season
- Thermocline, halocline, pycnocline
 Below ~1000m
 Relatively constant temperature,
salinity and density
- Deep Layer
I.1.2. The Ocean
I.1.3. The Land Surface and Biosphere
- The Landcover
Lancover/Landuse Categories:
- Soil: Sand, Clay and Silt …
- Vegetation: Evergreen Forest,
Deciduous Forest, Savanna,
Grassland, Cropland …
- Urban: Megacity, City, Rural …
- Water: River, Lake, Swamp …
- Ice and Snow? See the Cryosphere
-Desert areas in North
-Tropical rainforest along the Equator
I.1.3. The Land Surface and Biosphere
- The Landcover -Desert areas in North
-Tropical rainforest along the Equator
Some Characteristics:
• Lower boundary of 30% of Earth
• Lower heat capacity than Ocean
• Higher spatial, temporal variability
• More variable interactions with
Atmosphere than Ocean surface
• Humans directly change the Land
surface
I.1.3. The Land Surface and Biosphere
- The Landcover -Desert areas in North
-Tropical rainforest along the Equator
• Evapotranspiration, Runoff, Canopy
Interception, Water uptake by roots …
• Reflection/Absorption of Solar,
Emission of IR
• Deforestation, Agriculture, Release
of Carbon Dioxide, Methane, Nitrous
Oxide, Aerosols …
• Mountain ranges: topographically
forced momentum change
Important for Water and Energy budgets
I.1.3. The Land Surface and Biosphere
- The Landcover -Desert areas in North
-Tropical rainforest along the Equator
- Vegetation and Soil
Sinks for Carbon Dioxide
43
I.1.3. The Land Surface and Biosphere
- Surface properties: the Albedo
Ocean less reflective than land
- Soil type
-Vegetation type
Albedo: fraction of incident solar radiation that is reflected.
- Lighter Surface are less absorbent
(higher albedo)
- Darker Surface are more absorbent
(lower albedo)
- Water < 0.1 (dark surface, good absorber)
- Vegetation 0.1 to 0.2
- Bare Land 0.2 to 0.3
- Clouds ~0.5
- Ice & snow 0.5 to 0.9 (shiny surface, od reflector) go
II.1.3. The Land Surface and Biosphere
- Surface properties: the Albedo
 Albedo () = Solar radiation reflectivity
 Planetary average  ≈ 0.3
- mostly due to clouds(2/3)
- and snow/ice (1/3)
45
II.1.3. The Cryosphere
Good Indicator of Global
Warming (Climate Change)
-Continental Ice, Sea Ice, Glaciers, Snow
- Reflect most of the incoming
solar radiation
- Accelerate global climate
change
- Contribute to sea level rise
Large reservoir of Methane
(Artic Tundra Soils)
II.2/ Forcing and Feedbacks
I.2.1. Climate Forcing
Solar Energy
Volcanic Eruptions
Greenhouse Gas
Aerosols
Land-use Changes
 Change imposed on the energy balance that causes a change in global temperature
II.2/ Forcing and Feedbacks
- Radiative Forcing
A perturbation, directly or indirectly, affecting Earth’s energy budget.
Temperature: T1
Impacts: I1
Temperature: T2
Impacts: I2
Fin
Fin + F’
- Solar Energy
II.2/ Forcing and Feedbacks
-Earth absorbs solar radiation over a flat atmospheric
disk of area 2
E
R

-But emits energy from the entire spherical surface
Energy Absorbed:
4
4 2
2
S
R
R
S
E
E



2
4 E
R

Energy Emitted:
2
E
R
S
-Stefan-Boltzmann Law:
Energy emitted by a Black Body: 4
E
T

 = Stefan-Boltzmann constant (= 5.67 . 10-8 Wm-2 K-4)
S = Solar Constant (1370 Wm-2)
II.2/ Forcing and Feedbacks
- Solar Energy
4
4 S
TE 
 C
Deg
K
S
TE .
6
279
67
.
5
4
1370
4
4 8
4
10





 

 The Earth has an Albedo
 30% of solar radiation is reflected back
C
Deg
K
TEeff
.
15
288 

Planetary Albedo 3
.
0


4
)
3
.
0
1
(
4 

S
TE
 C
Deg
K
S
TE .
18
255
67
.
5
4
1370
7
.
0
4
7
.
0
4 8
4
10








 

 Difference = 33 Deg.C !!!
 Part of the Energy radiated by the Earth comes back
Greenhouse Effect !!!
- Greenhouse Effect (GHE) and Greenhouse Gas (GHG)
II.2/ Forcing and Feedback
 The one-layer atmosphere model of the Earth Atmospheric Absorption is taking place
4
)
1
( 


S
F
TOA
S


s
g
S
S
F 


4
)
1
(
T
F E
g
IR
4



 IR
E
TOA
IR T
F 

4
T
F A
A
4


T
F A
A
4


IR
S
- At the top of the Atmosphere: F
F
F A
TOA
IR
TOA
S


- At the Earth’s Surface (ground): F
F
F
g
IR
A
g
S


- Combining both equations: F
F
F
F
TOA
IR
g
S
TOA
S
g
IR




 


 IR
E
S
E T
T
S
S







4
4
4
)
1
(
4
)
1
(
1
.
0
1
8
.
0
1
67
.
5
4
)
3
.
0
1
(
1370
1
1
4
)
1
(
10
8
4












 




IR
S
E
S
T
 S Fraction of Solar NOT absorbed
IR Fraction of IR NOT absorbed
C
Deg
K
TE
.
15
288 

0-D Energy Balance Model or Simple GHE model 4
Global shortwave radiation
cascade
Global longwave radiation
cascade
II.2/ Forcing and Feedbacks
- The Energy Budget: Pathways
 Albedo: fraction of incident solar
radiation that is reflected
• Global average "planetary albedo"
0.31 (=107/342)
• Deep clouds: albedo roughly 0.9,
ocean albedo 0.08
 Some absorption of solar
radiation, e.g., in ozone layer
(UV)
• Aerosols: suspended particles
 Most incoming solar radiation is
absorbed at the Earth’s surface.
Global shortwave radiation cascade
II.2/ Forcing and Feedbacks
 The upward IR from the surface is mostly
trapped in the atmosphere rather than
escaping directly to space
• Tends to heat the atmosphere.
 The GHGs warm the atmosphere to a
temperature where it emits sufficient
radiation to balance the heat budget but it
emits both upward and downward
• Part of the energy is returned back down to the
surface where it is absorbed
• This results in additional warming of the surface,
compared to a case with no atmospheric absorption
of IR.
 Both gases and clouds contribute to
absorption of IR and thus to the greenhouse
effect.
Global longwave radiation cascade
I.2/ Forcing and Feedbacks
Latent and Sensible Heat
 Heat transfer from the surface upward: IR emission
o Sensible heat and Latent heat
Sensible heat: contact between molecules, subsequent
upward transfer by parcels of hotter air (e.g. hot plumes
known as thermals)
Evaporation more effective means of cooling the surface: it
stores energy as latent heat
Latent heat subsequently released when water vapor
condenses into clouds
Over land, evaporation process for vegetation is called
transpiration: loosing water through the leaves
Plants access ground water, actively regulate water loss.
I.2/ Forcing and Feedbacks
Clouds have been classified as the highest priority in climate change by the
IPCC because they are one of the largest sources of uncertainty in predicting
potential future climate change
55
I.2/ Forcing and Feedbacks
- Cloud Radiative Forcing
The effect of clouds on the Earth's radiation balance is measured as the difference between
clear-sky and all-sky radiation results
FX(cloud) = FX(clear) – FX(all-sky)
where X= SW or LW
FNet(cloud) = FSW(cloud) + FLW(cloud)
Negative FNet(cloud) => Clouds have a cooling effect on Climate: Albedo effect
Positive FNet(cloud) => Clouds have a warming effect on Climate: GHG effect
I.2/ Forcing and Feedbacks
- Cloud Radiative Forcing
I.2/ Forcing and Feedbacks
- Cloud Radiative Forcing (CRF)
Earth (No Clouds)
Clear-Sky
Earth (With Clouds)
All-Sky
57 W m-2
342 W m-2
285 W m-2
265 W m-2
107 W m-2
342 W m-2
235 W m-2
235 W m-2
FSW (cloud) =-50 W m-2
FLW (cloud)= 30 W m-2
=> Net Effect of Clouds = -20 W m-2
4/17/2024 58
 Since cloud-base temperature is typically greater than the clear-sky effective
atmospheric radiating temperature, CRFLW is generally positive. GHG effect!
The magnitude of CRFLW is strongly dependent on cloud-base height (i.e., cloud-
base temperature) and emissivity.
Conversely, clouds reflect more insolation than clear sky, therefore, CRFSW is
always negative over long time averages or large spatial domains. Albedo effect!
The magnitude of CRFSW cooling strongly depends on the cloud optical properties
and fraction, and varies with season.
I.2/ Forcing and Feedbacks
- Cloud Radiative Forcing (CRF)
I.2/ Forcing and Feedbacks
Equator more heated than the poles
- The Energy Budget: Zonal Distribution
Area
E
F
A
S
A

Area
E
F
B
S
B

F
F B
A
 T
T B
A

In A: The rays are concentrated over a small area around the Equator
In B: The rays are spread over a larger area around the polar regions
More heated at the equator than the poles
I.2/ Forcing and Feedbacks
- The Energy Budget: Zonal Distribution
 December
I.2/ Forcing and Feedbacks
- The Energy Budget: Zonal Distribution
The Earth
MUST transfer
heat poleward
-Atmospheric circulation: winds
-Ocean circulation: currents
Surplus
Deficit
I.2/ Forcing and Feedbacks
- The Energy Budget: Zonal Distribution
 Annual
HOT
COLD
COLD
The (original) Hadley
Circulation (1735)
 The One-Cell Model
I.2/ Forcing and Feedbacks
-Atmospheric Circulation
Warm air rises and cold air
sinks, creating circulation
 The modified Hadley Cell
- The Three-Cells Model
-Atmospheric Circulation
I.2/ Forcing and Feedbacks
• Hadley: Thermally driven circulation
confined to tropics
• Ferrell: Mid-latitude circulation cell
(subtropics to polar front)
• Polar: Sinking air at the poles
Three-Cells Model
I.2/ Forcing and Feedbacks
-Atmospheric Circulation
• Trade Winds: Surface easterly winds
diverging from subtropical Highs and
converging near the Equator
• Westerlies: Diverge from subtropical
Highs & converge toward polar front
• Polar Easterlies: Converge along the
polar front
Three-Cells Model
I.2/ Forcing and Feedbacks
-Atmospheric Circulation
• Low Pressure (converging air)
• ITCZ (Intertropical convergence zone),
near the equator
• Subpolar Lows: along the polar front,
near 60°
• High Pressure (diverging air)
• Subtropical Highs: near 30° (warm &
dry)
• Polar High: at the pole (cold & dry)
Three-Cells Model
I.2/ Forcing and Feedbacks
-Atmospheric Circulation
• Deserts at subtropical highs (High =
sinking air)
• Rainforests near ITCZ (Low = rising air
& clouds)
• Polar regions are deserts and receive
very little precipitation each year (High
= sinking air)
I.2/ Forcing and Feedbacks
-Atmospheric Circulation
I.2/ Forcing and Feedbacks
-Atmospheric Circulation
The Global Picture
January
precipitation
climatology
July
precipitation
climatology
Rainfall Response
I.2/ Forcing and Feedbacks
Intertropical convergence zones (ITZC):
heavy precipitation features deep in the
tropics, (convergence refers to the low level
winds that converge into these regions).
Monsoons: tropical convection zones move
northward in northern summer, southward in
southern summer, especially over
continents.
•e.g., Indian monsoon, Central-American
monsoon, African monsoon.
•Traditionally monsoon was defined by
local reversals of wind; now generalized.
Rainfall Response
I.2/ Forcing and Feedbacks
 Not perfectly symmetric about the
Equator.
 Variations in longitude: eastern Pacific
has little rain, western Pacific has
intense rainfall.
More convection and associated rising
motion in the western Pacific
 Overturning circulations along the
equatorial band known as the Walker
circulation
Storm tracks around 30-45°N
Rainfall Response
I.2/ Forcing and Feedbacks
- The Walker cell
I.2/ Forcing and Feedbacks
Rainfall Response
e.g. Like the Hadley circulation but in longitude instead of latitude
- The Walker cell
I.2/ Forcing and Feedbacks
Rainfall Response
- The Hadley cell
- Latitudinal and longitudinal dependance of intense
precipitation along the ITCZ
I.2/ Forcing and Feedbacks
I.3/ The Water Cycle
 Major components
of the Water cycle
• Precipitation
• Evaporation &
evapotranspiration
• Atmospheric transport
• Runoff and ground
water flow
• Water reservoir (ocean,
lake, glacier, soil water,
etc.)
 Water can exist in all three phases in our atmosphere
• What atmospheric variable do we use to quantify the
amount of water in any given volume of air at one time?
• Answer: Moisture or Humidity
I.3/ The Water Cycle
 Water phases
• Humidity describes the amount of water vapor in the air.
• Humidity is described quantitatively as vapour pressure,
absolute humidity, mixing ratio and relative humidity.
• Saturation is achieved when the number of water vapor
molecules leaving a water surface is equal to the number
returning from the atmosphere to the water surface.
I.3/ The Water Cycle
 Humidity
• Saturation vapour pressure is the pressure exerted by the water
vapour at saturation.
• Absolute humidity is the mass of water per unit volume . Units
are usually grams per cubic meter.
• Mixing ratio is the mass of water vapor in an unit mass of air.
Usually in grams per kilogram.
• Relative humidity is the actual amount of water vapour in the
air over the amount of water vapour required for saturation.
I.3/ The Water Cycle
 Humidity
I.3/ The Water Cycle
 Clouds
• Clouds are formed when air containing
water vapor is cooled below a critical
temperature called the dew point and the
resulting moisture condenses into
droplets on microscopic dust particles
(condensation nuclei) in the atmosphere.
• Clouds: A visible mass of liquid
water droplets suspended in the
atmosphere above Earth's surface
I.3/ The Water Cycle
 Clouds
• Evaporation:
- Process where a liquid changes into a gas
• Condensation:
- Process where a gas changes into a liquid
• Precipitation:
- Any liquid or solid water that falls from
the atmosphere to the ground. (i.e. RAIN!)
• Condensation
 The process by which water vapor changes to a cloud droplet – Saturation
 Two ways to cause saturation (increases relative humidity of the air)
- Add more water vapor to the air
- Cool the air until its temperature is closer to the dew point temperature
 Water vapor molecules are moving faster in warm air and less likely to stick
together and condense. If air cools to the dew point temperature, there is
saturation
I.3/ The Water Cycle
- the colder the molecules the more likely they are to stick to other molecules
• Condensation
 Water requires a non-gaseous surface to condense (make the transition from
a vapour to a liquid)  Cloud Condensation Nuclei
 Water vapor molecules may stick to CCN and grow (billions) to eventually
form cloud droplet.
 Examples of CCN include:
a. Dust
b. Salt
c. Smoke
d. Aerosols
I.3/ The Water Cycle
CCN
CCN
More aerosols  Competition for water vapor to condense on  Smaller droplets
I.3/ The Water Cycle
• Cloud Condensation Nuclei
 Land  Ocean
I.3/ The Water Cycle
• Cloud Condensation Nuclei
Cloud droplet sizes
are larger over the
Ocean than over the
Land
I.3/ The Water Cycle
• Typical cloud droplets
- Typical CCN
- Typical cloud droplet (TCD)
- Large cloud droplet (LCD)
- Borderline Drop (BD)
- Typical Raindrop (TRD)
How big are the TRD?
I.3/ The Water Cycle
• Typical cloud droplets

 1000 kg/m3
3
3
4
R
V 

- Calculate the mass of each of these
five types of drops?
- How many TCD is needed to have
LCD?
- How many LCD is needed to have
TRD?
I.3/ The Water Cycle
• Condensation growth versus Collision- Coalesence
- If we rely on condensation,
probably we will never reach the
required radius for TRD –
Mechanisms?
- Growth in warm cloud:
Collision – Coalesence
- Growth in cold cloud: Bergeron
Process
I.3/ The Water Cycle
• Collision- Coalesence Growth
- Most clouds formed in the Tropics, and many in the middle
latitudes, are warm clouds
- Those clouds have temperatures greater than 0ºC throughout
- The Collision-coalescence process generates precipitation
- This process depends on the differing fall speeds of different-
sized droplets
- It begins with large collector drops which have high terminal
velocities
I.3/ The Water Cycle
• Collision
-Collector drops collide with smaller drops
- Due to compressed air beneath falling drop, there is an inverse
relationship between collector drop size and collision efficiency
- Collisions typically occur between a collector and fairly large
cloud drops
- Smaller drops are pushed aside
- Collision is more effective for the droplets that are not very much
smaller than the collect droplet
I.3/ The Water Cycle
• Coalescence
-When collisions occur, drops either bounce apart or coalesce
into one larger drop
- Coalescence efficiency is very high indicating that most
collisions result in coalescence
- Collision and coalescence together form the primary
mechanism for precipitation in the tropics, where warm clouds
dominate
I.3/ The Water Cycle
• Bergeron Process
- In high cold clouds – mid-latitudes over continent
- Key: the co-existence of water vapor, liquid water droplets
and ice crystal for temperature below freezing
- Ice crystal grows faster than droplets – Precipitation is
formed in the form of ice crystal. It can be rain before or at the
ground.
- Net movement of water molecules from water droplet to ice
crystal (sublimation)
I.3/ The Water Cycle
• Bergeron Process
- Saturation vapor
pressure higher in water
than in ice
- Cause net movement of
water molecules to the ice
crystal
I.3/ The Water Cycle
• Bergeron Process
- Ice crystals growth through riming and aggregation
- Riming: Liquid water freezing onto ice crystals producing rapid growth
- Aggregation: the joining of multiple ice crystals through the bonding of surface water builds
ice crystals to the point of overcoming updrafts
I.3/ The Water Cycle
• Bergeron Process
- Rising Air
• Consider an air parcel rising
through the atmosphere
• The parcel expands as it rises
• The expansion, or work done
on the parcel causes the
temperature to decrease
• As the parcel rises, humidity
increases and reaches 100%,
leading to the formation of cloud
droplets by condensation
I.3/ The Water Cycle
• Lifting mechanisms of air mass
- Rising Air
• If the cloud is sufficiently deep or long
lived, precipitation develops.
• The upward motions generating clouds
and precipitation can be produced by:
• Convection in unstable air
• Convergence of air near a cloud base
• Lifting of air by fronts
• Lifting over elevated topography
I.3/ The Water Cycle
• Lifting mechanisms of air mass
I.3/ The Water Cycle
• Lifting mechanisms of air mass
- Lifting by Convection
• As the earth is heated by the sun,
thermals (bubbles of hot air) rise
upward from the surface
• The thermal cools as it rises, losing
some of its buoyancy (its ability to rise)
• The vertical extent of the cloud is
largely determined by the stability of the
environment
I.3/ The Water Cycle
• Lifting mechanisms of air mass
- Lifting by Convection
• A deep stable layer restricts
continued vertical growth
• A deep unstable layer will likely
lead to development of rain-
producing clouds
I.3/ The Water Cycle
• Lifting mechanisms of air mass
- Lifting by Convergence
• Convergence exists when there is
a horizontal net inflow into a
region
• When air converges along the
surface, it is forced to rise
I.3/ The Water Cycle
• Lifting mechanisms of air mass
- Lifting by Convergence
• Large scale convergence can lift air hundreds of kilometers across
• Vertical motions associated with convergence are generally much
stronger than ones due to convection
• Generally, clouds developed by convergence are more vertically
developed
I.3/ The Water Cycle
• Lifting mechanisms of air mass
- Lifting due to Topography
• This type of lifting occurs when air is
confronted by a sudden increase in the
vertical topography of the Earth
• When air comes across a mountain,
it is lifted up and over, cooling as it
is rising
• The type of cloud formed is dependent
upon the moisture content and stability
of the air
I.3/ The Water Cycle
• Lifting mechanisms of air mass
I.3/ The Water Cycle
• Lifting mechanisms of air mass
- Lifting due to Topography
I.3/ The Water Cycle
• Lifting mechanisms of air mass
- Lifting due to Fronts
• Front – a boundary between two regions of air that
have different meteorological properties, e.g.
temperature or humidity
• Cold front – a region where cold air is replacing
warmer air
• Warm front – a region where warm air is replacing
colder air
I.3/ The Water Cycle
• Lifting mechanisms of air mass
- Warm Front
I.3/ The Water Cycle
• Lifting mechanisms of air mass
- Cold Front
 1 Petagram (Pg)=1 trillion kg=1
billion metric tons=1gigaton (Gt);
keeping track of the mass of carbon
atoms in both organic and
inorganic (e.g., carbonate,
bicarbonate, CO2) compounds
 Ocean 38,000 PgC; 3 PgC as
marine biota; upper ocean 900 PgC
 Natural Carbon Cycle
I.3/ The Carbon Cycle
Keeping track of the carbon atoms in
both organic and inorganic (e.g.
carbonate, bicarbonate, CO2)
1 Petagram (Pg) =1 trillion kg =1
billion metric tons=1gigaton (Gt)
- Dark arrows = Gross fluxes
- Light arrows = Net fluxes
• Carbon sink: more carbon enter the
reservoir than leave it
• Carbon source: more carbon leaves
the reservoir than enters it
 1 Petagram (Pg)=1 trillion kg=1
billion metric tons=1gigaton (Gt);
keeping track of the mass of carbon
atoms in both organic and
inorganic (e.g., carbonate,
bicarbonate, CO2) compounds
 Ocean 38,000 PgC; 3 PgC as
marine biota; upper ocean 900 PgC
 Natural Carbon Cycle
I.3/ The Carbon Cycle
Reservoirs (Pools):
• Ocean
- Dissolved CO2 in the surface and
deep ocean water
- Marine biota
- Sediment layers on the ocean floor
- Dark arrows = Gross fluxes
- Light arrows = Net fluxes
 1 Petagram (Pg)=1 trillion kg=1
billion metric tons=1gigaton (Gt);
keeping track of the mass of carbon
atoms in both organic and
inorganic (e.g., carbonate,
bicarbonate, CO2) compounds
 Ocean 38,000 PgC; 3 PgC as
marine biota; upper ocean 900 PgC
 Natural Carbon Cycle
I.3/ The Carbon Cycle
Reservoirs (Pools):
• Land and Biosphere
- Living biomass (i.e. vegetation)
- Dead biomass (i.e. detritus)
- Soils
- Fossil fuel (oil, gas and coal)
- Dark arrows = Gross fluxes
- Light arrows = Net fluxes
 1 Petagram (Pg)=1 trillion kg=1
billion metric tons=1gigaton (Gt);
keeping track of the mass of carbon
atoms in both organic and
inorganic (e.g., carbonate,
bicarbonate, CO2) compounds
 Ocean 38,000 PgC; 3 PgC as
marine biota; upper ocean 900 PgC
 Natural Carbon Cycle
I.3/ The Carbon Cycle
Reservoirs (Pools):
• Atmosphere
- Carbon Dioxide (CO2)
- Methane (CH4)
- Dark arrows = Gross fluxes
- Light arrows = Net fluxes
 Natural Carbon Cycle
I.3/ The Carbon Cycle
Carbon Exchange
- Photosynthesis:
6CO2 + 6H2O C6H12O6 + 6O2
- Respiration
C6H12O6 + 6O2 6CO2 + 6H2O + ATP
- Decomposition
Organic Matters CO2 + Minerals
Sunlight
ATP: Adenosine Triphosphate = Energy
 Human Perturbation
I.3/ The Carbon Cycle
Carbon Exchange
- Fossil fuel extraction,
distribution and use
- Cement production
- Land use change
- Agricultural activities
120
 The Ocean is being monitored
I.4/ ENSO
121
 Mean state in the tropical Pacific
Sea Surface Temperature: SST
Pacific Warm Pool
I.4/ ENSO
122
15000 km
~28 C
~24 C
~20 C
15 C or colder
10 km
 Mean state in the tropical Pacific
Atmosphere:
- Trade winds blow across Pacific
- Air converge to the warm pool
- Air rises in convergence zone
I.4/ ENSO
123
15000 km
~28 C
~24 C
~20 C
15 C or colder
10 km
 Mean state in the tropical Pacific
Ocean:
- Thermocline ~100m deeper in west
- Sea Level is 40 cm higher
- Pressure gradient in the Ocean (eastward) balances the wind stress
Dynamical sea level rise
I.4/ ENSO
124
 Mechanisms Pacific under El Nino conditions
- Trade winds weaken
- Warmer SST in East
- Thermocline deeper East
rainfall tends to spread East
Upwelling of less cold water
Wind Stress < PGF
I.4/ ENSO
Climatology
1982-2001 (C)
Sea Surface Temperature
(SST) December 1997
Anomaly (December
1997 SST-Climatology)
I.4/ ENSO
 Characterization of ENSO
December 1997 Anomalies of sea level height
 Characterization of ENSO
I.4/ ENSO
Increase sea
level height
I.4/ ENSO
 Characterization of ENSO
December 1997 Anomalies of precipitation
Precipitation
spreads West
El Nino:
Average of El Nino
winters Dec-Jan-Feb
82/83, 86/87, 91/92,
94/95, 97/98 Minus
Clim. (1982-2001)
La Nina:
Average of La Nina
winters Dec-Jan-Feb
84/85, 88/89, 95/96,
98/99, 99/00 Minus
Cim. (1982-2001)
I.4/ ENSO
 What is ENSO ?
129
 Regions where El Nino occurs
The local impact on precipitation depends where
the warming takes place
I.4/ ENSO
130
 Occurrence of ENSO
Note: ENSO is irregular but with apparent ~4 year cycle built in
I.4/ ENSO
131
Why ENSO is important? Teleconnections
I.4/ ENSO
132
Why ENSO is important? Teleconnections
I.4/ ENSO
-Feedbacks in the Climate System
I.5/ Feedbacks
Cause-effect loops: amplify or dampen initial forcing
Involve multiple components that are coupled
Initial Forcing
+/-
+ increases state variable
- decreases state variable
“feedback loop”
State Variable Process or
coupling
-Feedbacks in the Climate System
I.5/ Feedbacks
-IR Flux-Temperature Feedback:
Initial Forcing
(e.g. GHG)
Temperature
+ Outgoing IR
flux increases
+
-
Negative feedback
I.5/ Feedbacks
- Ice Albedo Feedback
Initial Forcing
(e.g. GHG)
Temperature
Ice melts,
dark soils
exposed
Albedo
Positive feedback
I.5/ Feedbacks
-
+
+
-Implication of Ice-Albedo
feedback: Snowball Earth
-Water Vapor Feedback
Initial Forcing
(e.g. GHG, solar
radiation)
Temperature
+ Water Vapor
Increased
evaporation
Increased
Greenhouse
Effect
Atmosphere holds
more water
I.5/ Feedbacks
Positive feedback
+
- Implication of Water Vapor
feedback: Runaway Humid GHE /
Runaway Climate Change
+
-Vegetation – Precipitation Feedback
Initial Forcing
(e.g. GHG, solar
radiation)
Temperature
+
Increased
Precipitation
Increased
Transpiration
of Water
Vapor
Forests replace
Grasslands
I.5/ Feedbacks
Positive feedback
+
+
-Vegetation-Albedo Feedback
Initial Forcing
(e.g. GHG, solar
radiation)
I.5/ Feedbacks
Negative feedback
Temperature
Decreased Albedo
More Dark Colored
Vegetation
Decreased
Solar
Reflection
Temperature
Increased Albedo
More Light Colored
Vegetation
Increased
Solar
Reflection
+
-
+
-
II.5/ Feedback
- Implication of Vegetation feedback: Daisyworld
- Daisyworld (Watson & Lovelock 1983) is a “parable” to illustrate possible natural biological
feedback processes
- Daisyworld is populated by two species of daisies
- one is dark coloured: these grow best in cold conditions
- the other is light coloured, and these grow best in the warm.
- This can (partially) make the temperature more stable against changes of insolation
- e.g. due to changes of the solar constant for any reason (changes in the Earth’s orbit around
the sun) or other changes of albedo (e.g. increased cloudiness, ice-cover, dustiness....)
- Cloud Feedback
Initial Forcing
(e.g. GHG, solar
radiation)
Temperature
+
Low Clouds
More atmospheric
water vapor
Increased
albedo
Temperature
+
High Clouds
More atmospheric
water vapor
Increased
greenhouse
effect
I.5/ Feedbacks
Highly Uncertain Outcome
+
+
-
+

More Related Content

Similar to Global Climate System power point presentation

The Earth's Atmosphere Notes -2012 (3).ppt
The Earth's Atmosphere Notes -2012 (3).pptThe Earth's Atmosphere Notes -2012 (3).ppt
The Earth's Atmosphere Notes -2012 (3).pptRoshanBrian
 
The Earth's Atmosphere Notes -2012 (1).ppt
The Earth's Atmosphere Notes -2012 (1).pptThe Earth's Atmosphere Notes -2012 (1).ppt
The Earth's Atmosphere Notes -2012 (1).pptRushilAnandSahu
 
Atmosphere & Pollution
Atmosphere & PollutionAtmosphere & Pollution
Atmosphere & PollutionStephen Taylor
 
Weather and climate
Weather and climateWeather and climate
Weather and climatengr1
 
Chapter 1 and 2 for students
Chapter 1 and 2 for studentsChapter 1 and 2 for students
Chapter 1 and 2 for studentsMissST
 
Chapter 4 global atmosphere change
Chapter 4 global atmosphere changeChapter 4 global atmosphere change
Chapter 4 global atmosphere changeShaheen Sardar
 
Bochicchio Atmosphere
Bochicchio AtmosphereBochicchio Atmosphere
Bochicchio Atmospheregbochicc
 
Chapter 2 climate
Chapter 2 climateChapter 2 climate
Chapter 2 climatecritter33
 
Atmosphere Powerpoint
Atmosphere PowerpointAtmosphere Powerpoint
Atmosphere PowerpointMrs. Henley
 
Atmosphere
AtmosphereAtmosphere
Atmospheredjpprkut
 
climate & climate change.ppt
climate & climate change.pptclimate & climate change.ppt
climate & climate change.pptmanjarigupta43
 
Atmosphere: Composition and Strucutre
Atmosphere: Composition and StrucutreAtmosphere: Composition and Strucutre
Atmosphere: Composition and StrucutreAkepati S. Reddy
 
Weather Theory Part I (Group C)
Weather Theory Part I (Group C)Weather Theory Part I (Group C)
Weather Theory Part I (Group C)Logan Nielsen
 
Atmospheric Pressure and Winds
Atmospheric Pressure and WindsAtmospheric Pressure and Winds
Atmospheric Pressure and WindsAkepati S. Reddy
 
Introduction to environment.pptx
Introduction to environment.pptxIntroduction to environment.pptx
Introduction to environment.pptxInoxcentAbdullah
 

Similar to Global Climate System power point presentation (20)

The Earth's Atmosphere Notes -2012 (3).ppt
The Earth's Atmosphere Notes -2012 (3).pptThe Earth's Atmosphere Notes -2012 (3).ppt
The Earth's Atmosphere Notes -2012 (3).ppt
 
The Earth's Atmosphere Notes -2012 (1).ppt
The Earth's Atmosphere Notes -2012 (1).pptThe Earth's Atmosphere Notes -2012 (1).ppt
The Earth's Atmosphere Notes -2012 (1).ppt
 
Atmosphere & Pollution
Atmosphere & PollutionAtmosphere & Pollution
Atmosphere & Pollution
 
AIR POLLUTION CONTROL L 12 and 13
AIR POLLUTION CONTROL L  12 and 13AIR POLLUTION CONTROL L  12 and 13
AIR POLLUTION CONTROL L 12 and 13
 
Weather and climate
Weather and climateWeather and climate
Weather and climate
 
Weather
WeatherWeather
Weather
 
Chapter 1 and 2 for students
Chapter 1 and 2 for studentsChapter 1 and 2 for students
Chapter 1 and 2 for students
 
Chapter 4 global atmosphere change
Chapter 4 global atmosphere changeChapter 4 global atmosphere change
Chapter 4 global atmosphere change
 
Bochicchio Atmosphere
Bochicchio AtmosphereBochicchio Atmosphere
Bochicchio Atmosphere
 
Chapter 2 climate
Chapter 2 climateChapter 2 climate
Chapter 2 climate
 
Atmosphere Powerpoint
Atmosphere PowerpointAtmosphere Powerpoint
Atmosphere Powerpoint
 
Atmosphere
AtmosphereAtmosphere
Atmosphere
 
climate & climate change.ppt
climate & climate change.pptclimate & climate change.ppt
climate & climate change.ppt
 
Weather and Climate
Weather and ClimateWeather and Climate
Weather and Climate
 
Atmosphere: Composition and Strucutre
Atmosphere: Composition and StrucutreAtmosphere: Composition and Strucutre
Atmosphere: Composition and Strucutre
 
Weather Theory Part I (Group C)
Weather Theory Part I (Group C)Weather Theory Part I (Group C)
Weather Theory Part I (Group C)
 
Atmospheric Pressure and Winds
Atmospheric Pressure and WindsAtmospheric Pressure and Winds
Atmospheric Pressure and Winds
 
climatology.pdf
climatology.pdfclimatology.pdf
climatology.pdf
 
The Atmosphere
The AtmosphereThe Atmosphere
The Atmosphere
 
Introduction to environment.pptx
Introduction to environment.pptxIntroduction to environment.pptx
Introduction to environment.pptx
 

More from HabyarimanaProjecte

Physical quantities and Measurements.ppt
Physical quantities and Measurements.pptPhysical quantities and Measurements.ppt
Physical quantities and Measurements.pptHabyarimanaProjecte
 
Electric flux power point presentation..
Electric flux power point presentation..Electric flux power point presentation..
Electric flux power point presentation..HabyarimanaProjecte
 
Climate Projections power point presentation
Climate Projections power point presentationClimate Projections power point presentation
Climate Projections power point presentationHabyarimanaProjecte
 
LECTURE NOTES ON STATICS_2024 power point presentation.
LECTURE NOTES ON STATICS_2024 power point presentation.LECTURE NOTES ON STATICS_2024 power point presentation.
LECTURE NOTES ON STATICS_2024 power point presentation.HabyarimanaProjecte
 
LO 1.1. USE PHYSICAL QUANTITIES.pdf
LO 1.1. USE PHYSICAL QUANTITIES.pdfLO 1.1. USE PHYSICAL QUANTITIES.pdf
LO 1.1. USE PHYSICAL QUANTITIES.pdfHabyarimanaProjecte
 

More from HabyarimanaProjecte (9)

Physical quantities and Measurements.ppt
Physical quantities and Measurements.pptPhysical quantities and Measurements.ppt
Physical quantities and Measurements.ppt
 
Electric flux power point presentation..
Electric flux power point presentation..Electric flux power point presentation..
Electric flux power point presentation..
 
Climate Projections power point presentation
Climate Projections power point presentationClimate Projections power point presentation
Climate Projections power point presentation
 
LECTURE NOTES ON STATICS_2024 power point presentation.
LECTURE NOTES ON STATICS_2024 power point presentation.LECTURE NOTES ON STATICS_2024 power point presentation.
LECTURE NOTES ON STATICS_2024 power point presentation.
 
Excel Tables.pdf
Excel Tables.pdfExcel Tables.pdf
Excel Tables.pdf
 
Workbook Management.pptx
Workbook Management.pptxWorkbook Management.pptx
Workbook Management.pptx
 
Course 1 - Let Get Started.pptx
Course 1 - Let Get Started.pptxCourse 1 - Let Get Started.pptx
Course 1 - Let Get Started.pptx
 
ltspice basic practice.pptx
ltspice basic practice.pptxltspice basic practice.pptx
ltspice basic practice.pptx
 
LO 1.1. USE PHYSICAL QUANTITIES.pdf
LO 1.1. USE PHYSICAL QUANTITIES.pdfLO 1.1. USE PHYSICAL QUANTITIES.pdf
LO 1.1. USE PHYSICAL QUANTITIES.pdf
 

Recently uploaded

Measures of Dispersion and Variability: Range, QD, AD and SD
Measures of Dispersion and Variability: Range, QD, AD and SDMeasures of Dispersion and Variability: Range, QD, AD and SD
Measures of Dispersion and Variability: Range, QD, AD and SDThiyagu K
 
The Most Excellent Way | 1 Corinthians 13
The Most Excellent Way | 1 Corinthians 13The Most Excellent Way | 1 Corinthians 13
The Most Excellent Way | 1 Corinthians 13Steve Thomason
 
BASLIQ CURRENT LOOKBOOK LOOKBOOK(1) (1).pdf
BASLIQ CURRENT LOOKBOOK  LOOKBOOK(1) (1).pdfBASLIQ CURRENT LOOKBOOK  LOOKBOOK(1) (1).pdf
BASLIQ CURRENT LOOKBOOK LOOKBOOK(1) (1).pdfSoniaTolstoy
 
Z Score,T Score, Percential Rank and Box Plot Graph
Z Score,T Score, Percential Rank and Box Plot GraphZ Score,T Score, Percential Rank and Box Plot Graph
Z Score,T Score, Percential Rank and Box Plot GraphThiyagu K
 
The basics of sentences session 2pptx copy.pptx
The basics of sentences session 2pptx copy.pptxThe basics of sentences session 2pptx copy.pptx
The basics of sentences session 2pptx copy.pptxheathfieldcps1
 
Software Engineering Methodologies (overview)
Software Engineering Methodologies (overview)Software Engineering Methodologies (overview)
Software Engineering Methodologies (overview)eniolaolutunde
 
Nutritional Needs Presentation - HLTH 104
Nutritional Needs Presentation - HLTH 104Nutritional Needs Presentation - HLTH 104
Nutritional Needs Presentation - HLTH 104misteraugie
 
Accessible design: Minimum effort, maximum impact
Accessible design: Minimum effort, maximum impactAccessible design: Minimum effort, maximum impact
Accessible design: Minimum effort, maximum impactdawncurless
 
Sanyam Choudhary Chemistry practical.pdf
Sanyam Choudhary Chemistry practical.pdfSanyam Choudhary Chemistry practical.pdf
Sanyam Choudhary Chemistry practical.pdfsanyamsingh5019
 
Key note speaker Neum_Admir Softic_ENG.pdf
Key note speaker Neum_Admir Softic_ENG.pdfKey note speaker Neum_Admir Softic_ENG.pdf
Key note speaker Neum_Admir Softic_ENG.pdfAdmir Softic
 
Advanced Views - Calendar View in Odoo 17
Advanced Views - Calendar View in Odoo 17Advanced Views - Calendar View in Odoo 17
Advanced Views - Calendar View in Odoo 17Celine George
 
9548086042 for call girls in Indira Nagar with room service
9548086042  for call girls in Indira Nagar  with room service9548086042  for call girls in Indira Nagar  with room service
9548086042 for call girls in Indira Nagar with room servicediscovermytutordmt
 
Ecosystem Interactions Class Discussion Presentation in Blue Green Lined Styl...
Ecosystem Interactions Class Discussion Presentation in Blue Green Lined Styl...Ecosystem Interactions Class Discussion Presentation in Blue Green Lined Styl...
Ecosystem Interactions Class Discussion Presentation in Blue Green Lined Styl...fonyou31
 
Arihant handbook biology for class 11 .pdf
Arihant handbook biology for class 11 .pdfArihant handbook biology for class 11 .pdf
Arihant handbook biology for class 11 .pdfchloefrazer622
 
Beyond the EU: DORA and NIS 2 Directive's Global Impact
Beyond the EU: DORA and NIS 2 Directive's Global ImpactBeyond the EU: DORA and NIS 2 Directive's Global Impact
Beyond the EU: DORA and NIS 2 Directive's Global ImpactPECB
 
SOCIAL AND HISTORICAL CONTEXT - LFTVD.pptx
SOCIAL AND HISTORICAL CONTEXT - LFTVD.pptxSOCIAL AND HISTORICAL CONTEXT - LFTVD.pptx
SOCIAL AND HISTORICAL CONTEXT - LFTVD.pptxiammrhaywood
 

Recently uploaded (20)

Measures of Dispersion and Variability: Range, QD, AD and SD
Measures of Dispersion and Variability: Range, QD, AD and SDMeasures of Dispersion and Variability: Range, QD, AD and SD
Measures of Dispersion and Variability: Range, QD, AD and SD
 
Mattingly "AI & Prompt Design: The Basics of Prompt Design"
Mattingly "AI & Prompt Design: The Basics of Prompt Design"Mattingly "AI & Prompt Design: The Basics of Prompt Design"
Mattingly "AI & Prompt Design: The Basics of Prompt Design"
 
The Most Excellent Way | 1 Corinthians 13
The Most Excellent Way | 1 Corinthians 13The Most Excellent Way | 1 Corinthians 13
The Most Excellent Way | 1 Corinthians 13
 
BASLIQ CURRENT LOOKBOOK LOOKBOOK(1) (1).pdf
BASLIQ CURRENT LOOKBOOK  LOOKBOOK(1) (1).pdfBASLIQ CURRENT LOOKBOOK  LOOKBOOK(1) (1).pdf
BASLIQ CURRENT LOOKBOOK LOOKBOOK(1) (1).pdf
 
Código Creativo y Arte de Software | Unidad 1
Código Creativo y Arte de Software | Unidad 1Código Creativo y Arte de Software | Unidad 1
Código Creativo y Arte de Software | Unidad 1
 
INDIA QUIZ 2024 RLAC DELHI UNIVERSITY.pptx
INDIA QUIZ 2024 RLAC DELHI UNIVERSITY.pptxINDIA QUIZ 2024 RLAC DELHI UNIVERSITY.pptx
INDIA QUIZ 2024 RLAC DELHI UNIVERSITY.pptx
 
Z Score,T Score, Percential Rank and Box Plot Graph
Z Score,T Score, Percential Rank and Box Plot GraphZ Score,T Score, Percential Rank and Box Plot Graph
Z Score,T Score, Percential Rank and Box Plot Graph
 
The basics of sentences session 2pptx copy.pptx
The basics of sentences session 2pptx copy.pptxThe basics of sentences session 2pptx copy.pptx
The basics of sentences session 2pptx copy.pptx
 
Software Engineering Methodologies (overview)
Software Engineering Methodologies (overview)Software Engineering Methodologies (overview)
Software Engineering Methodologies (overview)
 
Nutritional Needs Presentation - HLTH 104
Nutritional Needs Presentation - HLTH 104Nutritional Needs Presentation - HLTH 104
Nutritional Needs Presentation - HLTH 104
 
Accessible design: Minimum effort, maximum impact
Accessible design: Minimum effort, maximum impactAccessible design: Minimum effort, maximum impact
Accessible design: Minimum effort, maximum impact
 
Sanyam Choudhary Chemistry practical.pdf
Sanyam Choudhary Chemistry practical.pdfSanyam Choudhary Chemistry practical.pdf
Sanyam Choudhary Chemistry practical.pdf
 
Advance Mobile Application Development class 07
Advance Mobile Application Development class 07Advance Mobile Application Development class 07
Advance Mobile Application Development class 07
 
Key note speaker Neum_Admir Softic_ENG.pdf
Key note speaker Neum_Admir Softic_ENG.pdfKey note speaker Neum_Admir Softic_ENG.pdf
Key note speaker Neum_Admir Softic_ENG.pdf
 
Advanced Views - Calendar View in Odoo 17
Advanced Views - Calendar View in Odoo 17Advanced Views - Calendar View in Odoo 17
Advanced Views - Calendar View in Odoo 17
 
9548086042 for call girls in Indira Nagar with room service
9548086042  for call girls in Indira Nagar  with room service9548086042  for call girls in Indira Nagar  with room service
9548086042 for call girls in Indira Nagar with room service
 
Ecosystem Interactions Class Discussion Presentation in Blue Green Lined Styl...
Ecosystem Interactions Class Discussion Presentation in Blue Green Lined Styl...Ecosystem Interactions Class Discussion Presentation in Blue Green Lined Styl...
Ecosystem Interactions Class Discussion Presentation in Blue Green Lined Styl...
 
Arihant handbook biology for class 11 .pdf
Arihant handbook biology for class 11 .pdfArihant handbook biology for class 11 .pdf
Arihant handbook biology for class 11 .pdf
 
Beyond the EU: DORA and NIS 2 Directive's Global Impact
Beyond the EU: DORA and NIS 2 Directive's Global ImpactBeyond the EU: DORA and NIS 2 Directive's Global Impact
Beyond the EU: DORA and NIS 2 Directive's Global Impact
 
SOCIAL AND HISTORICAL CONTEXT - LFTVD.pptx
SOCIAL AND HISTORICAL CONTEXT - LFTVD.pptxSOCIAL AND HISTORICAL CONTEXT - LFTVD.pptx
SOCIAL AND HISTORICAL CONTEXT - LFTVD.pptx
 

Global Climate System power point presentation

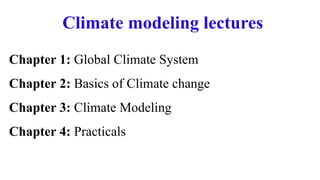
  • 1. Climate modeling lectures Chapter 1: Global Climate System Chapter 2: Basics of Climate change Chapter 3: Climate Modeling Chapter 4: Practicals
  • 2. - Get familiarised with the science of climate - Know how the Climate System works - Understand the problematic of climate change - Acquire some basics on climate change - Able to understand, process and analyze climate models output  Learning outcomes
  • 3. Why study climate? • Studying climate is important? • Because its changes will affect people around the world:  Increasing global temperatures are expected to rise sea levels, increase extreme events and change other local climate conditions.  Regional climate change could alter forests, crop yields, and water supply and demand. It could also affect human health, animals and plants, and many types of ecosystems.
  • 4. Weather Vs. Climate • The difference between weather and climate is a measure of timescale • Weather is the state of the atmosphere, land, and ocean conditions on a day in a particular place • It is measured in terms of temperature, humidity, precipitation, cloudiness, visibility, wind, and atmospheric pressure • Climate is the average weather in a location over a long period of time (30 years or more) • Climate is what you expect, like a very hot summer. Weather is what you get, like a hot day with thunderstorms. • When you travel, Climate decides what to pack and Weather will tell you whether to put on short sleeves tee-shirt or jacket.
  • 5. Chapter 1 The Global Climate System Dr. Mouhamadou Bamba SYLLA AIMS-Canada Research Chair in Climate Change Science AIMS-Rwanda Center, Kigali, Rwanda
  • 7. II.1/ The different components -The Atmosphere -The Ocean -The Land Surface -The Chryosphere -The Biosphere The climate system is a highly non-linear coupled system whose components interact on a wide range of spatial and temporal scales
  • 8. Cross section view II.1/ The different components
  • 9. 9 Some useful definitions - Black Body: any object that is a perfect emitter and a perfect absorber of radiation - Radiation: energy that travels and spreads out as it goes - Wavelength: distance between successive crests of a wave
  • 10. - Spectrum: a bunch of types of radiation Some useful definitions
  • 11. II.1.1. The Atmosphere - Composition (Gas) Gas Name (*variable) Formula Percent Volume Nitrogen N2 78.08% Oxygen O2 20.95% *Water Vapor H2O 0 to 4% Argon Ar 0.93% *Carbon Dioxide CO2 0.0360% Neon Ne 0.0018% Helium He 0.0005% *Methane CH4 0.00017% Hydrogen H2 0.00005% *Nitrous Oxide N2O 0.00003% *Ozone O3 0.000004%
  • 12. Blackbody radiation curves & absorption of radiation at each wavelength Fraction of radiation absorbed at each wavelength as it passes through whole depth of atmosphere Fraction absorbed above 11 km - Atmospheric Absorption Spectrum II.1.1. The Atmosphere SUN EARTH
  • 13. 13 - Atmospheric Absorption Spectrum II.1.1. The Atmosphere Most Absorbant gases • O3 and O2 in the UV • H2O, N2O, CO2, CH4 in the IR Minor constituents Transparent in the VIS Opaque in the UV Less opaque in the IR  N2??? NO EFFECT !!!
  • 14. Some basic concepts  Mass: Amount of matter an object contains. Expressed in grams or kilograms (g or kg)  Force: Push or pull, any interaction that change the motion of an object - Move an object from rest - Change the speed of a moving body - Change the direction - Change the shape - Expressed in N (i.e. kgf) As long as the amount of matter does not change, its mass remains constant --- regardless of location. Example: gravity force -- mg r mGM F E G   2 ME: Mass of the Earth = 5.98*1024 kg G=gravitational constant=6.67x10⁻¹¹ Nm2kg2
  • 15. Some basic concepts  Weight: Weight is the force on an object to the gravitational acceleration a measure of the force of gravity pulling down on an object W=m*g ---- (Weight = mass * gravity acceleration)  Density: is the mass per unit volume. Expressed in kg/m3 V m  
  • 16. Some basic concepts  Density: is the mass per unit volume. Expressed in kg/m3 Density DECREASES when: Mass decreases or volume increases Density INCREASES when: Mass increases or volume decreases a b Original box Add more mass Decrease the volume
  • 17. Some basic concepts  Pressure: Pressure is the force per unit area. It is expressed in Pascal (Pa). A F P  The typical unit of atmospheric pressure is millibars (mb) 1 Pa = 0.01 mb (SI unit of pressure from above)
  • 18. Some basic concepts  Heat capacity: Amount of energy required to change the temperature of a material c= 𝑑𝑄 𝑚𝑑𝑇 C is expressed as J/kgoC T: temperature oC dQ: change in energy J/kg m: masse (kg)
  • 19. II.1.1. The Atmosphere The Atmosphere is shallow Determined by the GRAVITY FORCE! mg r mGM F E G   2 ME: Mass of the Earth = 5.98*1024 kg G=gravitational constant=6.67x10⁻¹¹ Nm2kg2 - Atmospheric Mass
  • 20.  Atmospheric pressure is the weight of air molecules above you  Pressure decreases with altitude because there are less air molecules above you as you rise  As a result of pressure changes, Temperature, Density, and Volume change too as you rise - Atmospheric Pressure and Layers I.1.1. The Atmosphere
  • 21. - Thickness of a Layer? I.1.1. The Atmosphere • Start with a column of air • The base of this column is at the surface, so lets say its pressure is about 1000mb • The top of this column is quite high. Let’s say that its pressure is 500mb • This column has some thickness: it is h (some distance between 1000 mb and 500 mb) 1000 mb 500 mb h
  • 22. • If we heat the column of air, it will expand, warm air is less dense • The thickness of the column will increase • 500 mb is now farther from the ground 1000 mb 500 mb Warmer I.1.1. The Atmosphere - Thickness of a Layer? h’
  • 23. • If we cool the column of air, it will shrink, cool air is more dense • The thickness of the column will decrease • 500mb is now closer to the ground 1000 mb 500 mb Colder - Thickness of a Layer? I.1.1. The Atmosphere
  • 24. • In fact, temperature is the ONLY factor in the atmosphere that determines the thickness of a layer • It wouldn’t have mattered which pressure we had chosen. They are all higher above the ground when it is warmer. I.1.1. The Atmosphere - Thickness of a Layer?
  • 25. • At the poles, 700 mb is quite low to the ground • These layers are not very “thick” • In the tropics, 700mb is much higher above the ground • See how “thick” these layers are I.1.1. The Atmosphere - Thickness of a Layer?
  • 26. I.1.1. The Atmosphere - Stratification of the Atmosphere • Divided up according to pressure: 500 mb layer is about halfway up • Divided up according to temperature. It does not follow a simple relationship with height • Averaging out temperature values in the atmosphere, four layers are identified
  • 27. I.1.1. The Atmosphere - Atmospheric Layers  Troposphere: temperature decreases with height  Stratosphere: temperature increases with height  Mesosphere: temperature decreases with height  Thermosphere: temperature increases with height
  • 28. I.1.1. The Atmosphere - Atmospheric Layers Troposphere:  From the surface up to about 12km  Its height varies with latitude and season: higher in Summer, and in the tropics  Temperature decreases with height because the troposphere is heated by the surface and not directly by sunlight: Adiabatic Expansion
  • 29. I.1.1. The Atmosphere - Atmospheric Layers Stratosphere:  Between about 12km and 50km, includes the Ozone layer  Temperature increases with height because the Ozone layer absorbs ultraviolet radiation and warms up  Lack of mixing and turbulence Very little exchange occurs between the stratosphere and troposphere (but it is important where it does)
  • 30. I.1.1. The Atmosphere - Atmospheric Layers Mesosphere:  Between 50km and 85km. Temperature decreases with height because of decreased solar heating and increased CO2 radiative emission Thermosphere: From 80km. Temperature increases with height because of high energy radiation being absorbed by gases, Solar winds, interaction Sun-charged particles
  • 31. 31 I.1.1. The Atmosphere - Weather events location All the weather phenomenon and events occur in the Troposphere
  • 32. I.1.2. The Ocean - One Ocean: 5 Basins • 71% of the World • Pacific is the largest • More than 60% of people live along the coast
  • 33. I.1.2. The Ocean - Some Characteristics • Ocean water has a higher Heat Capacity than Land • Ocean water heats up and cools down slower than Land • Contrasting heating between Land and Ocean for a whole day and whole year • Sea and Land breezes, Monsoons …
  • 34. I.1.2. The Ocean Water reservoir: unlimited water source for evaporation Heat reservoir: absorbs a lot of heat increasing less the temperature of the global climate system – in comparison to the Land Carbon reservoir: a sink for Atmospheric Carbon Dioxide, helps to decrease GHG effects - Some Characteristics
  • 35. - Water Column I.1.2. The Ocean Based Temperature and Salinity Density Mixed layer Thermocline Halocline Pycnocline Deep layer (Abyss)
  • 36. - The Mixed Layer I.1.2. The Ocean  Warm, less dense  Mixed by the wind  Heat Exchange  Evaporation and Precipitation Approx. Upper 50-200 m  Wind-driven circulation
  • 37. I.1.2. The Ocean  Approx. between 100-200m and 1000 m  Zone of strong gradients  Barrier to mixing: Temp, Salinity and Density change very fast  Variations with latitude and season - Thermocline, halocline, pycnocline
  • 38.  Below ~1000m  Relatively constant temperature, salinity and density - Deep Layer I.1.2. The Ocean
  • 39. I.1.3. The Land Surface and Biosphere - The Landcover Lancover/Landuse Categories: - Soil: Sand, Clay and Silt … - Vegetation: Evergreen Forest, Deciduous Forest, Savanna, Grassland, Cropland … - Urban: Megacity, City, Rural … - Water: River, Lake, Swamp … - Ice and Snow? See the Cryosphere -Desert areas in North -Tropical rainforest along the Equator
  • 40. I.1.3. The Land Surface and Biosphere - The Landcover -Desert areas in North -Tropical rainforest along the Equator Some Characteristics: • Lower boundary of 30% of Earth • Lower heat capacity than Ocean • Higher spatial, temporal variability • More variable interactions with Atmosphere than Ocean surface • Humans directly change the Land surface
  • 41. I.1.3. The Land Surface and Biosphere - The Landcover -Desert areas in North -Tropical rainforest along the Equator • Evapotranspiration, Runoff, Canopy Interception, Water uptake by roots … • Reflection/Absorption of Solar, Emission of IR • Deforestation, Agriculture, Release of Carbon Dioxide, Methane, Nitrous Oxide, Aerosols … • Mountain ranges: topographically forced momentum change Important for Water and Energy budgets
  • 42. I.1.3. The Land Surface and Biosphere - The Landcover -Desert areas in North -Tropical rainforest along the Equator - Vegetation and Soil Sinks for Carbon Dioxide
  • 43. 43 I.1.3. The Land Surface and Biosphere - Surface properties: the Albedo Ocean less reflective than land - Soil type -Vegetation type Albedo: fraction of incident solar radiation that is reflected. - Lighter Surface are less absorbent (higher albedo) - Darker Surface are more absorbent (lower albedo)
  • 44. - Water < 0.1 (dark surface, good absorber) - Vegetation 0.1 to 0.2 - Bare Land 0.2 to 0.3 - Clouds ~0.5 - Ice & snow 0.5 to 0.9 (shiny surface, od reflector) go II.1.3. The Land Surface and Biosphere - Surface properties: the Albedo  Albedo () = Solar radiation reflectivity  Planetary average  ≈ 0.3 - mostly due to clouds(2/3) - and snow/ice (1/3)
  • 45. 45 II.1.3. The Cryosphere Good Indicator of Global Warming (Climate Change) -Continental Ice, Sea Ice, Glaciers, Snow - Reflect most of the incoming solar radiation - Accelerate global climate change - Contribute to sea level rise Large reservoir of Methane (Artic Tundra Soils)
  • 46. II.2/ Forcing and Feedbacks I.2.1. Climate Forcing Solar Energy Volcanic Eruptions Greenhouse Gas Aerosols Land-use Changes  Change imposed on the energy balance that causes a change in global temperature
  • 47. II.2/ Forcing and Feedbacks - Radiative Forcing A perturbation, directly or indirectly, affecting Earth’s energy budget. Temperature: T1 Impacts: I1 Temperature: T2 Impacts: I2 Fin Fin + F’
  • 48. - Solar Energy II.2/ Forcing and Feedbacks -Earth absorbs solar radiation over a flat atmospheric disk of area 2 E R  -But emits energy from the entire spherical surface Energy Absorbed: 4 4 2 2 S R R S E E    2 4 E R  Energy Emitted: 2 E R S -Stefan-Boltzmann Law: Energy emitted by a Black Body: 4 E T   = Stefan-Boltzmann constant (= 5.67 . 10-8 Wm-2 K-4) S = Solar Constant (1370 Wm-2)
  • 49. II.2/ Forcing and Feedbacks - Solar Energy 4 4 S TE   C Deg K S TE . 6 279 67 . 5 4 1370 4 4 8 4 10          The Earth has an Albedo  30% of solar radiation is reflected back C Deg K TEeff . 15 288   Planetary Albedo 3 . 0   4 ) 3 . 0 1 ( 4   S TE  C Deg K S TE . 18 255 67 . 5 4 1370 7 . 0 4 7 . 0 4 8 4 10             Difference = 33 Deg.C !!!  Part of the Energy radiated by the Earth comes back Greenhouse Effect !!!
  • 50. - Greenhouse Effect (GHE) and Greenhouse Gas (GHG) II.2/ Forcing and Feedback  The one-layer atmosphere model of the Earth Atmospheric Absorption is taking place 4 ) 1 (    S F TOA S   s g S S F    4 ) 1 ( T F E g IR 4     IR E TOA IR T F   4 T F A A 4   T F A A 4   IR S - At the top of the Atmosphere: F F F A TOA IR TOA S   - At the Earth’s Surface (ground): F F F g IR A g S   - Combining both equations: F F F F TOA IR g S TOA S g IR          IR E S E T T S S        4 4 4 ) 1 ( 4 ) 1 ( 1 . 0 1 8 . 0 1 67 . 5 4 ) 3 . 0 1 ( 1370 1 1 4 ) 1 ( 10 8 4                   IR S E S T  S Fraction of Solar NOT absorbed IR Fraction of IR NOT absorbed C Deg K TE . 15 288   0-D Energy Balance Model or Simple GHE model 4
  • 51. Global shortwave radiation cascade Global longwave radiation cascade II.2/ Forcing and Feedbacks - The Energy Budget: Pathways
  • 52.  Albedo: fraction of incident solar radiation that is reflected • Global average "planetary albedo" 0.31 (=107/342) • Deep clouds: albedo roughly 0.9, ocean albedo 0.08  Some absorption of solar radiation, e.g., in ozone layer (UV) • Aerosols: suspended particles  Most incoming solar radiation is absorbed at the Earth’s surface. Global shortwave radiation cascade II.2/ Forcing and Feedbacks
  • 53.  The upward IR from the surface is mostly trapped in the atmosphere rather than escaping directly to space • Tends to heat the atmosphere.  The GHGs warm the atmosphere to a temperature where it emits sufficient radiation to balance the heat budget but it emits both upward and downward • Part of the energy is returned back down to the surface where it is absorbed • This results in additional warming of the surface, compared to a case with no atmospheric absorption of IR.  Both gases and clouds contribute to absorption of IR and thus to the greenhouse effect. Global longwave radiation cascade I.2/ Forcing and Feedbacks
  • 54. Latent and Sensible Heat  Heat transfer from the surface upward: IR emission o Sensible heat and Latent heat Sensible heat: contact between molecules, subsequent upward transfer by parcels of hotter air (e.g. hot plumes known as thermals) Evaporation more effective means of cooling the surface: it stores energy as latent heat Latent heat subsequently released when water vapor condenses into clouds Over land, evaporation process for vegetation is called transpiration: loosing water through the leaves Plants access ground water, actively regulate water loss. I.2/ Forcing and Feedbacks
  • 55. Clouds have been classified as the highest priority in climate change by the IPCC because they are one of the largest sources of uncertainty in predicting potential future climate change 55 I.2/ Forcing and Feedbacks - Cloud Radiative Forcing
  • 56. The effect of clouds on the Earth's radiation balance is measured as the difference between clear-sky and all-sky radiation results FX(cloud) = FX(clear) – FX(all-sky) where X= SW or LW FNet(cloud) = FSW(cloud) + FLW(cloud) Negative FNet(cloud) => Clouds have a cooling effect on Climate: Albedo effect Positive FNet(cloud) => Clouds have a warming effect on Climate: GHG effect I.2/ Forcing and Feedbacks - Cloud Radiative Forcing
  • 57. I.2/ Forcing and Feedbacks - Cloud Radiative Forcing (CRF) Earth (No Clouds) Clear-Sky Earth (With Clouds) All-Sky 57 W m-2 342 W m-2 285 W m-2 265 W m-2 107 W m-2 342 W m-2 235 W m-2 235 W m-2 FSW (cloud) =-50 W m-2 FLW (cloud)= 30 W m-2 => Net Effect of Clouds = -20 W m-2
  • 58. 4/17/2024 58  Since cloud-base temperature is typically greater than the clear-sky effective atmospheric radiating temperature, CRFLW is generally positive. GHG effect! The magnitude of CRFLW is strongly dependent on cloud-base height (i.e., cloud- base temperature) and emissivity. Conversely, clouds reflect more insolation than clear sky, therefore, CRFSW is always negative over long time averages or large spatial domains. Albedo effect! The magnitude of CRFSW cooling strongly depends on the cloud optical properties and fraction, and varies with season. I.2/ Forcing and Feedbacks - Cloud Radiative Forcing (CRF)
  • 59.
  • 60.
  • 61.
  • 62.
  • 63.
  • 64. I.2/ Forcing and Feedbacks Equator more heated than the poles - The Energy Budget: Zonal Distribution Area E F A S A  Area E F B S B  F F B A  T T B A  In A: The rays are concentrated over a small area around the Equator In B: The rays are spread over a larger area around the polar regions
  • 65. More heated at the equator than the poles I.2/ Forcing and Feedbacks - The Energy Budget: Zonal Distribution
  • 66.  December I.2/ Forcing and Feedbacks - The Energy Budget: Zonal Distribution
  • 67. The Earth MUST transfer heat poleward -Atmospheric circulation: winds -Ocean circulation: currents Surplus Deficit I.2/ Forcing and Feedbacks - The Energy Budget: Zonal Distribution  Annual
  • 68. HOT COLD COLD The (original) Hadley Circulation (1735)  The One-Cell Model I.2/ Forcing and Feedbacks -Atmospheric Circulation Warm air rises and cold air sinks, creating circulation
  • 69.  The modified Hadley Cell - The Three-Cells Model -Atmospheric Circulation I.2/ Forcing and Feedbacks • Hadley: Thermally driven circulation confined to tropics • Ferrell: Mid-latitude circulation cell (subtropics to polar front) • Polar: Sinking air at the poles
  • 70. Three-Cells Model I.2/ Forcing and Feedbacks -Atmospheric Circulation • Trade Winds: Surface easterly winds diverging from subtropical Highs and converging near the Equator • Westerlies: Diverge from subtropical Highs & converge toward polar front • Polar Easterlies: Converge along the polar front
  • 71. Three-Cells Model I.2/ Forcing and Feedbacks -Atmospheric Circulation • Low Pressure (converging air) • ITCZ (Intertropical convergence zone), near the equator • Subpolar Lows: along the polar front, near 60° • High Pressure (diverging air) • Subtropical Highs: near 30° (warm & dry) • Polar High: at the pole (cold & dry)
  • 72. Three-Cells Model I.2/ Forcing and Feedbacks -Atmospheric Circulation • Deserts at subtropical highs (High = sinking air) • Rainforests near ITCZ (Low = rising air & clouds) • Polar regions are deserts and receive very little precipitation each year (High = sinking air)
  • 73. I.2/ Forcing and Feedbacks -Atmospheric Circulation
  • 74. I.2/ Forcing and Feedbacks -Atmospheric Circulation The Global Picture
  • 76. Intertropical convergence zones (ITZC): heavy precipitation features deep in the tropics, (convergence refers to the low level winds that converge into these regions). Monsoons: tropical convection zones move northward in northern summer, southward in southern summer, especially over continents. •e.g., Indian monsoon, Central-American monsoon, African monsoon. •Traditionally monsoon was defined by local reversals of wind; now generalized. Rainfall Response I.2/ Forcing and Feedbacks
  • 77.  Not perfectly symmetric about the Equator.  Variations in longitude: eastern Pacific has little rain, western Pacific has intense rainfall. More convection and associated rising motion in the western Pacific  Overturning circulations along the equatorial band known as the Walker circulation Storm tracks around 30-45°N Rainfall Response I.2/ Forcing and Feedbacks
  • 78. - The Walker cell I.2/ Forcing and Feedbacks Rainfall Response e.g. Like the Hadley circulation but in longitude instead of latitude
  • 79. - The Walker cell I.2/ Forcing and Feedbacks Rainfall Response - The Hadley cell
  • 80. - Latitudinal and longitudinal dependance of intense precipitation along the ITCZ I.2/ Forcing and Feedbacks
  • 81. I.3/ The Water Cycle  Major components of the Water cycle • Precipitation • Evaporation & evapotranspiration • Atmospheric transport • Runoff and ground water flow • Water reservoir (ocean, lake, glacier, soil water, etc.)
  • 82.  Water can exist in all three phases in our atmosphere • What atmospheric variable do we use to quantify the amount of water in any given volume of air at one time? • Answer: Moisture or Humidity I.3/ The Water Cycle
  • 83. I.3/ The Water Cycle  Water phases
  • 84. • Humidity describes the amount of water vapor in the air. • Humidity is described quantitatively as vapour pressure, absolute humidity, mixing ratio and relative humidity. • Saturation is achieved when the number of water vapor molecules leaving a water surface is equal to the number returning from the atmosphere to the water surface. I.3/ The Water Cycle  Humidity
  • 85. • Saturation vapour pressure is the pressure exerted by the water vapour at saturation. • Absolute humidity is the mass of water per unit volume . Units are usually grams per cubic meter. • Mixing ratio is the mass of water vapor in an unit mass of air. Usually in grams per kilogram. • Relative humidity is the actual amount of water vapour in the air over the amount of water vapour required for saturation. I.3/ The Water Cycle  Humidity
  • 86. I.3/ The Water Cycle  Clouds • Clouds are formed when air containing water vapor is cooled below a critical temperature called the dew point and the resulting moisture condenses into droplets on microscopic dust particles (condensation nuclei) in the atmosphere. • Clouds: A visible mass of liquid water droplets suspended in the atmosphere above Earth's surface
  • 87. I.3/ The Water Cycle  Clouds • Evaporation: - Process where a liquid changes into a gas • Condensation: - Process where a gas changes into a liquid • Precipitation: - Any liquid or solid water that falls from the atmosphere to the ground. (i.e. RAIN!)
  • 88. • Condensation  The process by which water vapor changes to a cloud droplet – Saturation  Two ways to cause saturation (increases relative humidity of the air) - Add more water vapor to the air - Cool the air until its temperature is closer to the dew point temperature  Water vapor molecules are moving faster in warm air and less likely to stick together and condense. If air cools to the dew point temperature, there is saturation I.3/ The Water Cycle - the colder the molecules the more likely they are to stick to other molecules
  • 89. • Condensation  Water requires a non-gaseous surface to condense (make the transition from a vapour to a liquid)  Cloud Condensation Nuclei  Water vapor molecules may stick to CCN and grow (billions) to eventually form cloud droplet.  Examples of CCN include: a. Dust b. Salt c. Smoke d. Aerosols I.3/ The Water Cycle
  • 90. CCN CCN More aerosols  Competition for water vapor to condense on  Smaller droplets I.3/ The Water Cycle • Cloud Condensation Nuclei  Land  Ocean
  • 91. I.3/ The Water Cycle I.3/ The Water Cycle • Cloud Condensation Nuclei Cloud droplet sizes are larger over the Ocean than over the Land
  • 92. I.3/ The Water Cycle • Typical cloud droplets - Typical CCN - Typical cloud droplet (TCD) - Large cloud droplet (LCD) - Borderline Drop (BD) - Typical Raindrop (TRD) How big are the TRD?
  • 93. I.3/ The Water Cycle • Typical cloud droplets   1000 kg/m3 3 3 4 R V   - Calculate the mass of each of these five types of drops? - How many TCD is needed to have LCD? - How many LCD is needed to have TRD?
  • 94. I.3/ The Water Cycle • Condensation growth versus Collision- Coalesence - If we rely on condensation, probably we will never reach the required radius for TRD – Mechanisms? - Growth in warm cloud: Collision – Coalesence - Growth in cold cloud: Bergeron Process
  • 95. I.3/ The Water Cycle • Collision- Coalesence Growth - Most clouds formed in the Tropics, and many in the middle latitudes, are warm clouds - Those clouds have temperatures greater than 0ºC throughout - The Collision-coalescence process generates precipitation - This process depends on the differing fall speeds of different- sized droplets - It begins with large collector drops which have high terminal velocities
  • 96. I.3/ The Water Cycle • Collision -Collector drops collide with smaller drops - Due to compressed air beneath falling drop, there is an inverse relationship between collector drop size and collision efficiency - Collisions typically occur between a collector and fairly large cloud drops - Smaller drops are pushed aside - Collision is more effective for the droplets that are not very much smaller than the collect droplet
  • 97. I.3/ The Water Cycle • Coalescence -When collisions occur, drops either bounce apart or coalesce into one larger drop - Coalescence efficiency is very high indicating that most collisions result in coalescence - Collision and coalescence together form the primary mechanism for precipitation in the tropics, where warm clouds dominate
  • 98. I.3/ The Water Cycle • Bergeron Process - In high cold clouds – mid-latitudes over continent - Key: the co-existence of water vapor, liquid water droplets and ice crystal for temperature below freezing - Ice crystal grows faster than droplets – Precipitation is formed in the form of ice crystal. It can be rain before or at the ground. - Net movement of water molecules from water droplet to ice crystal (sublimation)
  • 99. I.3/ The Water Cycle • Bergeron Process - Saturation vapor pressure higher in water than in ice - Cause net movement of water molecules to the ice crystal
  • 100. I.3/ The Water Cycle • Bergeron Process
  • 101. - Ice crystals growth through riming and aggregation - Riming: Liquid water freezing onto ice crystals producing rapid growth - Aggregation: the joining of multiple ice crystals through the bonding of surface water builds ice crystals to the point of overcoming updrafts I.3/ The Water Cycle • Bergeron Process
  • 102. - Rising Air • Consider an air parcel rising through the atmosphere • The parcel expands as it rises • The expansion, or work done on the parcel causes the temperature to decrease • As the parcel rises, humidity increases and reaches 100%, leading to the formation of cloud droplets by condensation I.3/ The Water Cycle • Lifting mechanisms of air mass
  • 103. - Rising Air • If the cloud is sufficiently deep or long lived, precipitation develops. • The upward motions generating clouds and precipitation can be produced by: • Convection in unstable air • Convergence of air near a cloud base • Lifting of air by fronts • Lifting over elevated topography I.3/ The Water Cycle • Lifting mechanisms of air mass
  • 104. I.3/ The Water Cycle • Lifting mechanisms of air mass
  • 105. - Lifting by Convection • As the earth is heated by the sun, thermals (bubbles of hot air) rise upward from the surface • The thermal cools as it rises, losing some of its buoyancy (its ability to rise) • The vertical extent of the cloud is largely determined by the stability of the environment I.3/ The Water Cycle • Lifting mechanisms of air mass
  • 106. - Lifting by Convection • A deep stable layer restricts continued vertical growth • A deep unstable layer will likely lead to development of rain- producing clouds I.3/ The Water Cycle • Lifting mechanisms of air mass
  • 107. - Lifting by Convergence • Convergence exists when there is a horizontal net inflow into a region • When air converges along the surface, it is forced to rise I.3/ The Water Cycle • Lifting mechanisms of air mass
  • 108. - Lifting by Convergence • Large scale convergence can lift air hundreds of kilometers across • Vertical motions associated with convergence are generally much stronger than ones due to convection • Generally, clouds developed by convergence are more vertically developed I.3/ The Water Cycle • Lifting mechanisms of air mass
  • 109. - Lifting due to Topography • This type of lifting occurs when air is confronted by a sudden increase in the vertical topography of the Earth • When air comes across a mountain, it is lifted up and over, cooling as it is rising • The type of cloud formed is dependent upon the moisture content and stability of the air I.3/ The Water Cycle • Lifting mechanisms of air mass
  • 110. I.3/ The Water Cycle • Lifting mechanisms of air mass - Lifting due to Topography
  • 111. I.3/ The Water Cycle • Lifting mechanisms of air mass - Lifting due to Fronts • Front – a boundary between two regions of air that have different meteorological properties, e.g. temperature or humidity • Cold front – a region where cold air is replacing warmer air • Warm front – a region where warm air is replacing colder air
  • 112. I.3/ The Water Cycle • Lifting mechanisms of air mass - Warm Front
  • 113. I.3/ The Water Cycle • Lifting mechanisms of air mass - Cold Front
  • 114.  1 Petagram (Pg)=1 trillion kg=1 billion metric tons=1gigaton (Gt); keeping track of the mass of carbon atoms in both organic and inorganic (e.g., carbonate, bicarbonate, CO2) compounds  Ocean 38,000 PgC; 3 PgC as marine biota; upper ocean 900 PgC  Natural Carbon Cycle I.3/ The Carbon Cycle Keeping track of the carbon atoms in both organic and inorganic (e.g. carbonate, bicarbonate, CO2) 1 Petagram (Pg) =1 trillion kg =1 billion metric tons=1gigaton (Gt) - Dark arrows = Gross fluxes - Light arrows = Net fluxes • Carbon sink: more carbon enter the reservoir than leave it • Carbon source: more carbon leaves the reservoir than enters it
  • 115.  1 Petagram (Pg)=1 trillion kg=1 billion metric tons=1gigaton (Gt); keeping track of the mass of carbon atoms in both organic and inorganic (e.g., carbonate, bicarbonate, CO2) compounds  Ocean 38,000 PgC; 3 PgC as marine biota; upper ocean 900 PgC  Natural Carbon Cycle I.3/ The Carbon Cycle Reservoirs (Pools): • Ocean - Dissolved CO2 in the surface and deep ocean water - Marine biota - Sediment layers on the ocean floor - Dark arrows = Gross fluxes - Light arrows = Net fluxes
  • 116.  1 Petagram (Pg)=1 trillion kg=1 billion metric tons=1gigaton (Gt); keeping track of the mass of carbon atoms in both organic and inorganic (e.g., carbonate, bicarbonate, CO2) compounds  Ocean 38,000 PgC; 3 PgC as marine biota; upper ocean 900 PgC  Natural Carbon Cycle I.3/ The Carbon Cycle Reservoirs (Pools): • Land and Biosphere - Living biomass (i.e. vegetation) - Dead biomass (i.e. detritus) - Soils - Fossil fuel (oil, gas and coal) - Dark arrows = Gross fluxes - Light arrows = Net fluxes
  • 117.  1 Petagram (Pg)=1 trillion kg=1 billion metric tons=1gigaton (Gt); keeping track of the mass of carbon atoms in both organic and inorganic (e.g., carbonate, bicarbonate, CO2) compounds  Ocean 38,000 PgC; 3 PgC as marine biota; upper ocean 900 PgC  Natural Carbon Cycle I.3/ The Carbon Cycle Reservoirs (Pools): • Atmosphere - Carbon Dioxide (CO2) - Methane (CH4) - Dark arrows = Gross fluxes - Light arrows = Net fluxes
  • 118.  Natural Carbon Cycle I.3/ The Carbon Cycle Carbon Exchange - Photosynthesis: 6CO2 + 6H2O C6H12O6 + 6O2 - Respiration C6H12O6 + 6O2 6CO2 + 6H2O + ATP - Decomposition Organic Matters CO2 + Minerals Sunlight ATP: Adenosine Triphosphate = Energy
  • 119.  Human Perturbation I.3/ The Carbon Cycle Carbon Exchange - Fossil fuel extraction, distribution and use - Cement production - Land use change - Agricultural activities
  • 120. 120  The Ocean is being monitored I.4/ ENSO
  • 121. 121  Mean state in the tropical Pacific Sea Surface Temperature: SST Pacific Warm Pool I.4/ ENSO
  • 122. 122 15000 km ~28 C ~24 C ~20 C 15 C or colder 10 km  Mean state in the tropical Pacific Atmosphere: - Trade winds blow across Pacific - Air converge to the warm pool - Air rises in convergence zone I.4/ ENSO
  • 123. 123 15000 km ~28 C ~24 C ~20 C 15 C or colder 10 km  Mean state in the tropical Pacific Ocean: - Thermocline ~100m deeper in west - Sea Level is 40 cm higher - Pressure gradient in the Ocean (eastward) balances the wind stress Dynamical sea level rise I.4/ ENSO
  • 124. 124  Mechanisms Pacific under El Nino conditions - Trade winds weaken - Warmer SST in East - Thermocline deeper East rainfall tends to spread East Upwelling of less cold water Wind Stress < PGF I.4/ ENSO
  • 125. Climatology 1982-2001 (C) Sea Surface Temperature (SST) December 1997 Anomaly (December 1997 SST-Climatology) I.4/ ENSO  Characterization of ENSO
  • 126. December 1997 Anomalies of sea level height  Characterization of ENSO I.4/ ENSO Increase sea level height
  • 127. I.4/ ENSO  Characterization of ENSO December 1997 Anomalies of precipitation Precipitation spreads West
  • 128. El Nino: Average of El Nino winters Dec-Jan-Feb 82/83, 86/87, 91/92, 94/95, 97/98 Minus Clim. (1982-2001) La Nina: Average of La Nina winters Dec-Jan-Feb 84/85, 88/89, 95/96, 98/99, 99/00 Minus Cim. (1982-2001) I.4/ ENSO  What is ENSO ?
  • 129. 129  Regions where El Nino occurs The local impact on precipitation depends where the warming takes place I.4/ ENSO
  • 130. 130  Occurrence of ENSO Note: ENSO is irregular but with apparent ~4 year cycle built in I.4/ ENSO
  • 131. 131 Why ENSO is important? Teleconnections I.4/ ENSO
  • 132. 132 Why ENSO is important? Teleconnections I.4/ ENSO
  • 133. -Feedbacks in the Climate System I.5/ Feedbacks Cause-effect loops: amplify or dampen initial forcing Involve multiple components that are coupled
  • 134. Initial Forcing +/- + increases state variable - decreases state variable “feedback loop” State Variable Process or coupling -Feedbacks in the Climate System I.5/ Feedbacks
  • 135. -IR Flux-Temperature Feedback: Initial Forcing (e.g. GHG) Temperature + Outgoing IR flux increases + - Negative feedback I.5/ Feedbacks
  • 136. - Ice Albedo Feedback Initial Forcing (e.g. GHG) Temperature Ice melts, dark soils exposed Albedo Positive feedback I.5/ Feedbacks - + + -Implication of Ice-Albedo feedback: Snowball Earth
  • 137. -Water Vapor Feedback Initial Forcing (e.g. GHG, solar radiation) Temperature + Water Vapor Increased evaporation Increased Greenhouse Effect Atmosphere holds more water I.5/ Feedbacks Positive feedback + - Implication of Water Vapor feedback: Runaway Humid GHE / Runaway Climate Change +
  • 138. -Vegetation – Precipitation Feedback Initial Forcing (e.g. GHG, solar radiation) Temperature + Increased Precipitation Increased Transpiration of Water Vapor Forests replace Grasslands I.5/ Feedbacks Positive feedback + +
  • 139. -Vegetation-Albedo Feedback Initial Forcing (e.g. GHG, solar radiation) I.5/ Feedbacks Negative feedback Temperature Decreased Albedo More Dark Colored Vegetation Decreased Solar Reflection Temperature Increased Albedo More Light Colored Vegetation Increased Solar Reflection + - + -
  • 140. II.5/ Feedback - Implication of Vegetation feedback: Daisyworld - Daisyworld (Watson & Lovelock 1983) is a “parable” to illustrate possible natural biological feedback processes - Daisyworld is populated by two species of daisies - one is dark coloured: these grow best in cold conditions - the other is light coloured, and these grow best in the warm. - This can (partially) make the temperature more stable against changes of insolation - e.g. due to changes of the solar constant for any reason (changes in the Earth’s orbit around the sun) or other changes of albedo (e.g. increased cloudiness, ice-cover, dustiness....)
  • 141. - Cloud Feedback Initial Forcing (e.g. GHG, solar radiation) Temperature + Low Clouds More atmospheric water vapor Increased albedo Temperature + High Clouds More atmospheric water vapor Increased greenhouse effect I.5/ Feedbacks Highly Uncertain Outcome + + - +