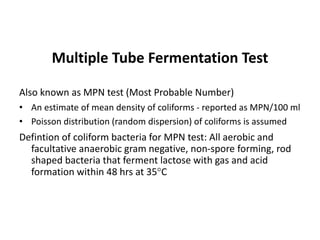
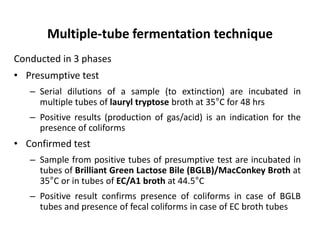
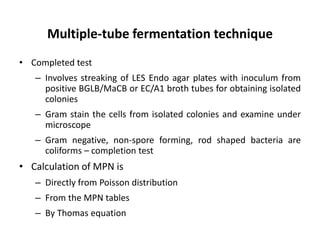
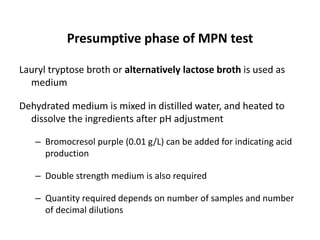
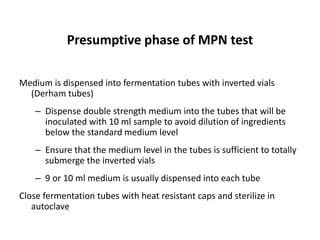
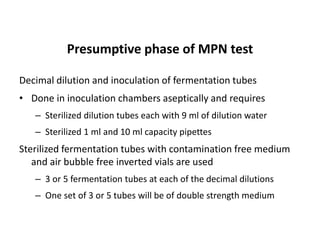
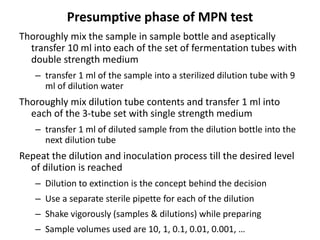
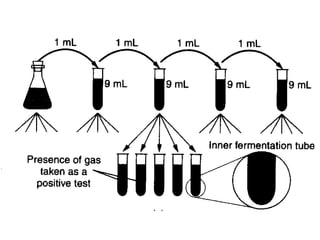
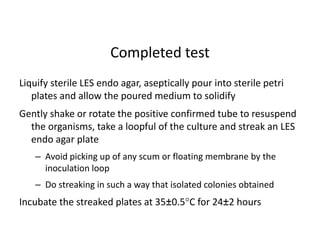
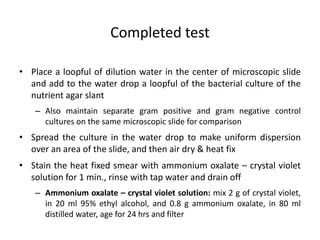
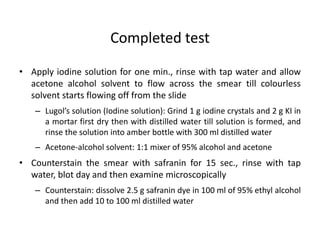
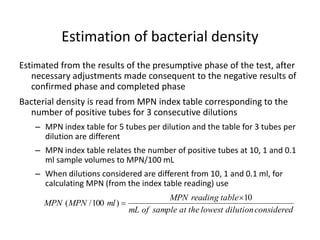
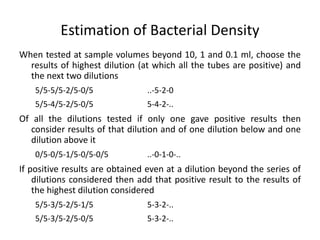
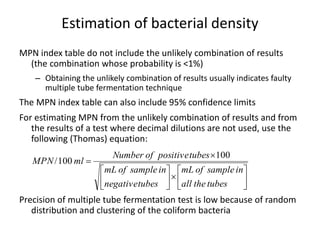
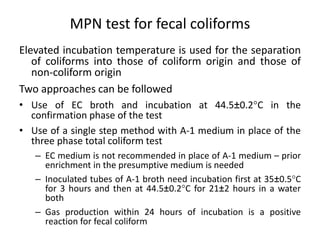
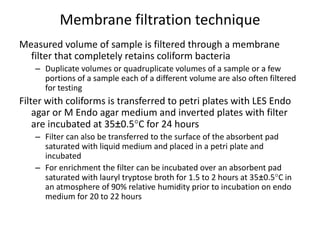
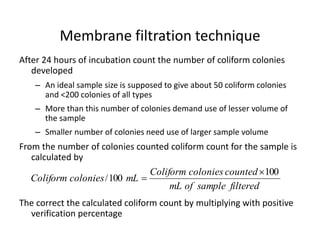
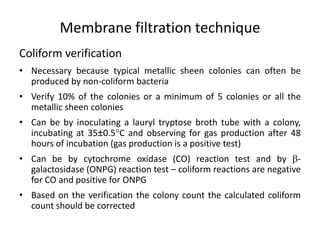
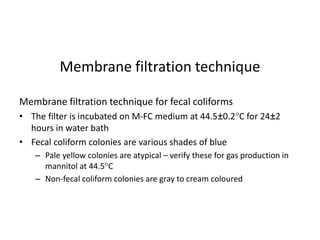
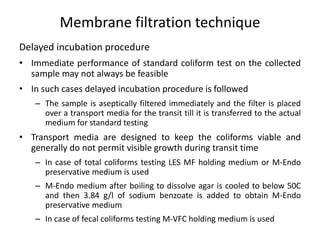
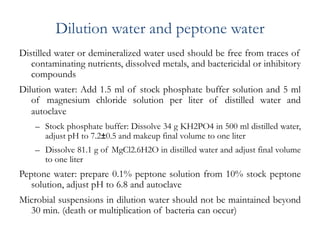
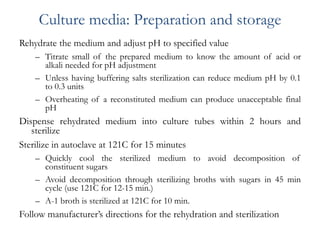
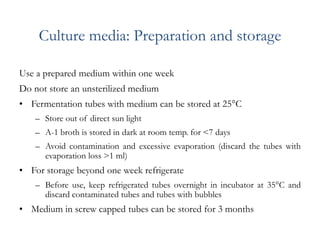
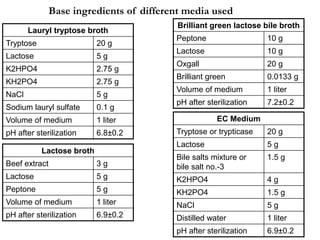
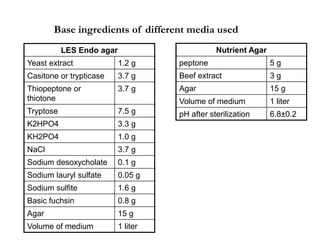
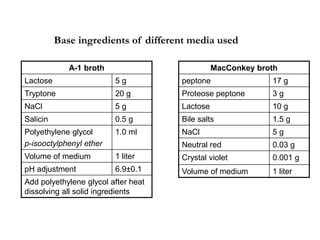
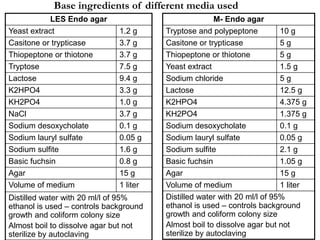
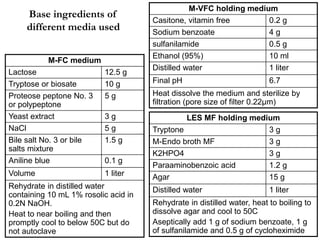
This document describes the MPN (Most Probable Number) test for testing biological water quality and detecting the presence of fecal contamination and pathogens. It involves testing for the indicator organism E. coli using a multiple tube fermentation technique with three phases - presumptive, confirmed, and completed tests. Samples are collected and stored properly then inoculated into lactose broth tubes at serial dilutions and incubated to detect coliform growth. Positive tubes are then tested with BGLB/MacConkey broth and EC/A1 broth to confirm total and fecal coliforms, respectively. Definitive identification involves plating and gram staining from positive confirmed tubes.
Enumeration is counting of microorganisms present in a sample.
This is done to know the intense of presence of the spoilers in the spoiled food.
To detect which type of organism is responsible for the spoilage.
Mostly this is done two important methods.
Viable count
Total count
VIABLE COUNT:
A viable cell count allows one to identify the number of actively growing or dividing cells in a sample.
The plate count method or spread plate method relies on bacteria growing a colony on a nutrient medium.
Number of colonies can be counted.
Plate count agar is used for general count
MacConkey agar is used for Gram negative organisms.
TOTAL COUNT:
The initial analysis is done by mixing serial dilution of sample in liquid nutrient agar which is then poured into bottles.
The bottles are then sealed and laid on their sides to produce a slopping agar surface.
The colonies are then counted by eye.The total number of colonies are said as Total Viable Count. The initial analysis is done by mixing serial dilution of sample in liquid nutrient agar which is then poured into bottles.
The bottles are then sealed and laid on their sides to produce a slopping agar surface.
The colonies are then counted by eye.The total number of colonies are said as Total Viable Count.
Pour plate method:
The same procedure is done for this till serial dilution.
The serially diluted sample is then mixed with the molten nutrient agar.
Then poured onto the sterile petridish.
Incubated under appropriate temperature amd the colonies where counted.
ConclusionThe enumeration of these spoiled food samples are important to encounter the type of microbe is causing the spoilage.
And hence this is used to prevent the same type of spoilage.
This can be avoided by making the environmental changes which inhibits the organism which is responsible for the spoilage.
Bacteriological analysis of drinking waterMariya Raju
This document discusses waterborne pathogens and methods for detecting their presence. It describes several bacteria, viruses, protozoa and helminthes that can cause diseases when transmitted through water. Coliform bacteria such as E. coli are used as indicator organisms to detect potential pathogens since testing all pathogens directly is impractical. The Most Probable Number (MPN) method and Membrane Filtration technique are described for enumerating coliforms and determining water quality. MPN involves inoculating multiple dilutions of a water sample into lactose broth while Membrane Filtration filters a sample volume and counts colonies on a membrane.
This document summarizes bioremediation methods for oil spills. It discusses how bioremediation uses microorganisms to break down oil contaminants into less toxic substances. There are several techniques to enhance bioremediation, including adding nutrients, oxygen, or microbes. While bioremediation is less expensive and natural than alternative methods, it takes time to see results and depends on environmental conditions. The document concludes that bioremediation should be considered a useful oil spill treatment, especially for shoreline cleanups.
This document discusses aquatic microbiology, including the study of microorganisms found in marine and freshwater ecosystems. It describes different types of microorganisms commonly found in water such as bacteria, viruses, protozoa, algae, and fungi. Many of these microbes can cause diseases in humans, like gastrointestinal illnesses from eating contaminated food or water. The document also outlines various treatment methods used to remove pathogens and contaminants from drinking water to make it safe for human consumption.
This document discusses dissolved oxygen (DO) levels in drinking water and their importance for aquatic life. It provides a table comparing drinking water quality standards in different countries that includes testing for microbiological, chemical, physical, and radiological parameters. The document discusses the sources and importance of DO, how aquatic organisms rely on it, and consequences of unusual DO levels. It also outlines several common methods for analyzing DO levels, including optical, electrochemical, colorimetric, and titrimetric methods.
This document discusses chemical oxygen demand (COD) testing. COD testing measures the amount of organic matter in water by determining the oxygen required to chemically oxidize the matter. Potassium dichromate is commonly used as the strong oxidizing agent. The COD test procedure involves refluxing a water sample with dichromate and sulfuric acid, then titrating the remaining dichromate with ferrous ammonium sulfate to determine the COD level in mg/L. COD testing provides faster results than biochemical oxygen demand (BOD) testing and oxidizes a wider range of compounds, though the results do not directly correlate to 5-day BOD levels.
Bacteriological analysis of drinking water by MPN method.prakashtu
This document describes the MPN (Most Probable Number) method for analyzing drinking water bacteriologically. The MPN method involves inoculating water samples in multiple dilutions into lactose broths to detect coliform bacteria presence. Positive samples are then cultured on EMB agar to isolate and identify E. coli. Confirmed E. coli colonies produce acid and gas when cultured in lactose broth at 44.5°C. The number of positive samples at each dilution level is used with statistical tables to estimate the MPN of coliform bacteria per 100ml of water. This provides a statistical analysis of bacteria levels in drinking water samples.
The document discusses the Most Probable Number (MPN) technique, which is used to estimate the concentration of viable microorganisms in water samples. It works by inoculating water samples into broth at different dilutions and observing growth, based on the principle of extinction dilution. A positive/negative result is obtained from lactose fermentation tests in broth. These results are interpreted using an MPN table to estimate the number of bacteria per 100ml of water. The document outlines the materials, presumptive test procedure involving broth incubation, confirmatory test using EMB agar plates, and complete test of Gram staining suspicious colonies to identify bacteria like E. coli.
1. Water is essential for life and supports all living organisms, but it can become polluted from various human and natural sources.
2. Microorganisms play important roles in water, including as primary producers, decomposers, and indicators of water quality. Phytoplankton, zooplankton, periphyton, benthos, and saprotrophic bacteria and fungi are some of the main types of microorganisms found in water.
3. Water pollution occurs when waste disposal or other human activities change the physical or chemical properties of water, making it unsuitable for uses like drinking, agriculture, or recreation. Sources of water pollution include industrial, domestic, agricultural, and mining activities.
(1) The document discusses different types of pollution including soil, marine, noise and thermal pollution.
(2) It describes the causes, sources and effects of each type of pollution in detail.
(3) Control measures for different pollutions are also outlined such as use of bioremediation for soil pollution and dispersants for oil pollution.
This document describes an experiment to determine the alkalinity of a water sample through titration with sulfuric acid. Alkalinity is measured by titrating a water sample with acid until the pH reaches 4.5, neutralizing hydroxyl, carbonate, and bicarbonate ions. The titration is performed twice - first with phenolphthalein to measure phenolphthalein alkalinity from hydroxyl ions, then with a mixed indicator to measure total alkalinity from additional carbonate and bicarbonate ions. The alkalinity of the tested sample was found to be 83 mg/L, within acceptable limits for drinking water.
Distribution of microbes in aquatic environmentRinaldo John
The document discusses the distribution of microbes in aquatic environments. It describes that plankton, which includes phytoplankton like algae and zooplankton like protozoa, are primary producers and consumers found in marine and fresh waters. It provides examples of phytoplankton like diatoms and dinoflagellates and zooplankton like krill and copepods. The document also mentions that benthic microorganisms live on the bottom substrates of bodies of water and that mixing of waters through upwelling accomplishes redistribution of microbial populations.
The document discusses biochemical oxygen demand (BOD), which measures the amount of oxygen used by microorganisms to break down organic waste in water. When organic waste is present, bacteria consume dissolved oxygen to decompose the waste. BOD tests how much oxygen is absorbed over 5 days at 20°C. A high BOD level indicates more organic waste requiring decomposition, lowering available oxygen for aquatic life. BOD is used to measure water pollution and assess treatment plant performance by comparing raw sewage and treated effluent BOD levels. Proper BOD testing follows steps including sample collection, dilution, seeding with bacteria, initial and final oxygen readings, and calculations to determine BOD in mg/L.
This document provides information on water microbiology and water sampling techniques. It defines various types of water, explains waterborne diseases and their causes. It describes the water cycle and importance of testing water microbiologically. Key indicators tested for include total coliform, E. coli, and enterococci. Sampling procedures like membrane filtration and most probable number tests are discussed. The document also outlines best practices for sampling, transportation, and submitting water samples for laboratory testing.
Biofouling is the accumulation of unwanted organisms on surfaces in an aquatic environment, detrimental to function. It is caused by the settlement of sessile marine organisms and includes plant, animal, inorganic, and organic fouling. Fouling occurs in stages and has widespread global distribution. It has significant economic impacts such as increased fuel costs and effects ocean instrumentation. Both physical and chemical antifouling methods are used but chemicals can be toxic to organisms.
Microbes In The Environment-Microorganisms for Bioremediation,Bacteria Generate Electricity from Pollution ,Geobacter Consume Radioactive Contamination,Plastic-Eating Bacteria Breaks Down Bags
ABSTRACT
INTRODUCTION
METHODOLOGY
BIOREMEDIATION OF OIL SPILLS
CASE STUDY
CONCLUSION
Subtopics
Bio remediation in hot and cold environments
Use of Nitrogen fixing Bacteria
Bio remediation using fungi from soil samples
Bio remediation using bacteria and case studies
The document discusses biochemical oxygen demand (BOD) and its importance as a measure of water quality. BOD is defined as the amount of dissolved oxygen needed by aerobic biological organisms to break down organic material in a water sample over a 5 day incubation period at 20°C. A higher BOD indicates a higher level of organic pollution. BOD is used to assess the effectiveness of wastewater treatment plants and provides an indication of overall water quality. The standard BOD test involves measuring the dissolved oxygen in a sample before and after 5 days, with the difference representing the oxygen consumed during decomposition of organic compounds.
Ensuring potable water for public consumption is a major Public Health Concern. This presentation sums up all the necessary and prioritized parameters conducted for water analysis.
The document discusses sources of microorganisms in air. It states that the main sources are soil, water, plant and animal surfaces, and human beings. Microbes from these sources enter the air through environmental factors like wind and water, or human activities like digging and talking. Once airborne, microbes can exist as droplets, droplet nuclei, or infectious dust, with droplet nuclei able to remain suspended the longest. The largest source is human beings through sneezing, coughing, and other activities that expel microbes from our respiratory tracts in bioaerosols.
This document discusses key concepts related to waste water treatment including biochemical oxygen demand (BOD), chemical oxygen demand (COD), and dissolved oxygen (DO). BOD measures the amount of oxygen required by microorganisms to break down organic matter in water. COD determines the oxygen required to oxidize organic compounds. DO refers to oxygen dissolved in water that aquatic life requires. The document outlines typical values and measurement methods for BOD, COD and DO in waste and natural waters. It also describes the nature of waste water pollutants and an overview of waste water treatment processes.
Aquatic microbiology is the study of microscopic organisms like bacteria, viruses, and fungi that live in freshwater and saltwater environments. These microorganisms are found throughout aquatic systems, from rivers and lakes to oceans and even hot springs. They play important roles like breaking down organic matter, recycling nutrients, and providing food for other aquatic life. Aquatic microorganisms also impact humans through activities like water purification in sewage treatment.
Bioremediation uses microorganisms to break down pollutants in the environment. It can be used to clean up oil spills, wastewater, and contaminated soil. Various techniques exist including biostimulation, which adds nutrients to stimulate microbes, and bioaugmentation, which introduces new microbes. Nanoparticles are also being used for nano bioremediation due to their large surface area and ability to penetrate contaminated areas. The document discusses using bacteria, fungi, and genetically engineered organisms to degrade pollutants and discusses turning waste into bioplastics or other materials through bioremediation techniques.
This document discusses bioremediation of oil spills. It defines bioremediation as using microbes to clean up contaminated soil and water. There are two main types of bioremediation for oil spills - bioaugmentation, which adds microbes, and biostimulation, which adds nutrients to stimulate existing microbes. While bioremediation is less expensive and more natural than other cleanup methods, it also takes more time to see results. The document examines bioremediation approaches to the infamous Exxon Valdez oil spill.
The document discusses biological oxygen demand (BOD) and chemical oxygen demand (COD) which are measurements of water quality. BOD refers to the amount of dissolved oxygen needed by microorganisms to break down organic matter in water over a set period of time. Higher BOD levels mean less dissolved oxygen is available to aquatic life. BOD is impacted by temperature, sewage, nutrients, turbidity, and natural processes. COD measures the total amount of oxygen required to oxidize all organic compounds in water, and COD values are always greater than BOD. The document provides details on measuring and calculating BOD and COD levels.
Water Quality Assessment Powerpoint Presentation SlidesSlideTeam
Introducing Water Quality Assessment Powerpoint Presentation Slides. Our readily available water monitoring system PowerPoint slide designs provide an overview of market size, growth rate, and capital expenditure. Demonstrate the division of the wastewater treatment market by editing our content-ready water quality check PPT slide deck. You can easily present the key statistics that play a vital role in analyzing the water industry by using this water treatment PPT slideshow. It is easy to present the key trends that will influence the water industry in the future such as increasing regulation, failing infrastructure, greater conservation, and efficiency, etc. Showcase the leading factors that will affect the performance of the water technology market by using content-ready water quality assurance PowerPoint visuals. You can edit water quality testing PPT themes to present the sources of water pollution. Highlight the natural processes and human processes that affect water quality. Provide an overview of the optimization of deterioration in water quality. You also can present the chemicals and biological pollutants that deteriorate the water quality. Showcase the water quality monitoring types and their objectives by downloading our visually attention-grabbing water quality monitoring PPT slides. https://bit.ly/3lzljrF
Biofouling describes the accumulation of microorganisms, plants, algae, and animals on submerged structures like ship hulls. It is a major problem for shipping and industrial processes. Biofouling occurs in four stages - formation of a conditioning film, accumulation of microorganisms, growth of bacteria and diatoms, and overgrowth by algae and invertebrates. It increases drag on ships and maintenance costs. Traditional antifouling methods using chemicals like TBT have been banned due to environmental effects. Newer non-toxic methods use natural substances from marine organisms or physical removal, but these are less effective or more costly. Corrosion is also a major issue for ships and needs ongoing prevention
This document discusses water quality assessment and microbial analysis for determining water contamination. It provides information on various water quality parameters, indicators of contamination like E. coli, and methods for microbial analysis. The membrane filtration and multiple tube methods are described for quantifying indicator bacteria in water samples. Standards and regulations on water purity for different uses are also mentioned.
The document discusses the Most Probable Number (MPN) method, which is used to estimate the concentration of microorganisms in a sample through replicate liquid broth growth in serial dilutions. The MPN method involves diluting a water sample and inoculating it into lactose broth tubes to detect the presence of fecal coliforms through acid and gas production. The number of positive tubes is used to determine the MPN by comparing to tables. It is a multi-step process involving presumptive, confirmatory, and completed tests to accurately detect coliforms. While it provides an estimate of microbes in a sample, it takes longer than plate counting and has a risk of false positives.
Most probable number or multiple tube fermentation techniqueSamsuDeen12
multiple tube fermentation or most probable number is a microbiological technique used to check the portability of water. microbial analysis of water is determined, and distinguished between faecal and non faecal contaminated water.
The membrane filtration method and multiple tube method are described for testing water samples for indicator organisms like coliforms and E. coli. The membrane filtration method uses a vacuum to pull the water sample through a membrane filter which retains bacteria. The filter is then placed on a culture medium and incubated. Colonies are counted and reported as CFU/100ml. The multiple tube method involves inoculating different volumes of the water sample into lactose broth tubes, incubating, and observing for acid/gas production to determine the most probable number of coliforms present in the original sample using statistical tables.
The document discusses bacteriology of water and air. It provides details on:
1. Indicator organisms used to detect fecal contamination in water, including E. coli, enterococci, and Clostridium perfringens.
2. Methods for analyzing water samples, including multiple tube fermentation and membrane filtration.
3. Parameters for evaluating air quality in operating theaters, including particle counts, air changes per hour, and temperature/humidity.
4. Surface surveillance involves sampling high-touch sites to identify potential pathogens and inform outbreak investigations.
Methods of collectons of water samples and microbiological (1)Kamal Singh Khadka
This document discusses methods for analyzing drinking water quality by testing for indicator bacteria. It describes the Most Probable Number (MPN) method and Membrane Filtration (MF) method. The MPN method involves diluting water samples and incubating them in growth media to detect coliforms over multiple tubes and steps. The MF method filters water through a membrane to retain bacteria, which are then cultured and counted. Both methods provide quantitative microbiological testing to detect indicator bacteria and assess drinking water safety.
MPN AND INDIRECT METHODS OF MEASUREMENT OF MICROBIAL GROWTH microbiology Notes
This document discusses methods for measuring microbial growth, including the most probable number (MPN) method and indirect turbidity measurements. The MPN method involves inoculating water samples into multiple tubes containing growth media and observing results to statistically estimate microbial concentrations. It involves presumptive, confirmed, and completed tests to identify coliforms and E. coli. Turbidity measurements use a spectrophotometer to measure light passage through cultures, where increased microbial growth causes higher turbidity and lower light transmission. Both methods provide ways to quantify microbes in samples without direct microscopic counting.
This document describes the microbial limit test, which includes tests to quantify and qualify microorganisms in samples. It involves estimating total viable counts of bacteria and fungi, and detecting specific pathogens. The test is based on culturing samples on various media to support or inhibit growth of target microbes. Methods like membrane filtration, spread plating, and serial dilution are used to quantify microbes, while selective media help identify pathogens like E. coli, S. aureus, P. aeruginosa, and Salmonella. Detailed procedures are provided for quantification, enrichment, and identification of microorganisms in samples.
This document discusses various techniques for enumerating microorganisms, including direct and indirect methods. Direct methods involve directly counting microbes under a microscope, such as using a counting chamber (e.g. Petri-Hausser chamber) for direct microscopic count. Indirect methods estimate the number of microbes using other indicators, like standard plate count which counts colonies grown from diluted samples, membrane filtration which filters microbes for colony counting, most probable number which estimates concentrations through liquid broth growth at serial dilutions, turbidity testing using spectrophotometers, and measuring metabolic activity or dry weight.
This document discusses water, milk, and air quality from a microbiological perspective.
It defines wholesome water and its biological, chemical, and physical properties. It describes factors that determine bacterial levels in water such as salinity, acidity, temperature, light, organic matter, and water type. It also discusses water-borne pathogens and their modes of transmission.
The document then covers the microbiology of milk, common milk-borne diseases, and methods used to disinfect/sterilize milk. It describes methods for bacteriological examination of milk including colony counts, chemical tests, and detection of specific pathogens.
Finally, it lists common airborne organisms and purposes of air sampling. It provides details
The document describes the Most Probable Number (MPN) method for counting coliform bacteria in water samples. The MPN method involves a 3-step process: 1) a presumptive test using lactose broth to detect gas production, 2) a confirmatory test using brilliant green lactose bile broth to inhibit non-coliform bacteria, and 3) a completed test where samples are plated and colonies are identified. The number of coliform bacteria in the original water sample can then be estimated using an MPN index table based on the number of positive and negative test tubes.
This document provides instructions for using an ELISA kit to detect the mycotoxin zearalenone in cereal crops and animal feeds. It begins with an introduction to zearalenone and its health effects. It then describes the intended use, principle, reagents, materials, precautions, extraction procedure, and assay procedure for the zearalenone ELISA kit. The kit is designed to quantitatively detect zearalenone in samples through a competitive enzyme immunoassay.
Parenterals are sterile dosage forms intended for administration through routes other than oral. They exert action by directly entering systemic circulation. Quality control tests for parenterals include uniformity of content, volume, weight, pyrogen, sterility, clarity, particulate matter, bacterial endotoxins and leakage. These tests ensure safety, efficacy and consistency of parenteral products before administration.
The serial dilution technique is used to count microbial colonies in environmental samples. It involves mixing a sample with diluent at ratios of 1:2 or 1:10 to reduce the microbial concentration to a countable level. The sample is serially diluted up to 10-8 and plated using the pour plate method. The plates are incubated and colonies are counted. The number of colonies per gram of sample is then calculated using the dilution factor. This technique allows microbiologists to study the number and types of microorganisms present in various environmental sources.
This document describes a quantitative ELISA assay for detecting fumonisin levels in urine samples. Fumonisins are mycotoxins produced by fungi that have been linked to various cancers and diseases. The assay uses antibody-coated microwells to competitively bind fumonisin from urine samples and an HRP-conjugated detection antibody. A colorimetric readout is used to quantify fumonisin levels, which are interpolated from a standard curve. The procedure involves purifying fumonisin from urine samples using a cleanup column before performing the ELISA assay to achieve quantitative results.
This document describes techniques for isolating pure cultures of microorganisms, including serial dilution, spread plating, streak plating, and pour plating. Serial dilution involves sequentially diluting a sample to reduce the concentration of microbes and allow discrete colonies to form. Spread plating involves spreading diluted samples evenly across agar plates, streak plating uses inoculation loops to streak samples in patterns to further dilute and separate microbes, and pour plating involves mixing diluted samples into molten agar before pouring into plates. These techniques are important for isolating pure cultures needed to accurately identify and study microbes.
This document defines and describes various types of suspended solids and organic matter that are measured in wastewater treatment. It discusses total suspended solids (TSS), volatile suspended solids (VSS), biodegradable VSS, settleable solids, fixed suspended solids, and colloidal solids. It also covers measurements of organic matter including total organic carbon (TOC), theoretical oxygen demand (ThOD), chemical oxygen demand (COD), biochemical oxygen demand (BOD), and BOD kinetics. The document provides details on procedures for measuring these parameters, including the use of filters, ignition, centrifugation, Imhoff cones, and demand tests.
Total suspended solids (TSS), volatile suspended solids (VSS), and biochemical oxygen demand (BOD) are key parameters used to analyze wastewater and biosolids. TSS is determined by filtering a sample and weighing the solid residue, while VSS is the weight loss when ignited at 550°C. The sludge volume index (SVI) measures sludge settling characteristics important for activated sludge process design and operation. Colloidal solids cause turbidity which is removed through bioflocculation in biological treatment.
The document discusses characterization and measurement of sewage flow. It describes parameters used to characterize sewage such as flow rate, solids, organic matter, nutrients, biological quality, pH and more. Methods of measuring flow rate discussed include differential pressure meters, velocity meters, positive displacement meters, and open channel meters. Specific flow meter types are then defined and explained such as venturi meters, orifice plates, electromagnetic and ultrasonic flow meters, weirs and more. Equations for calculating flow using various meter types are also provided.
This document discusses various types of flow meters used to measure flow in pipes and open channels. It begins by explaining why flow measurement is important, such as to quantify water and wastewater flows, facilitate proportionate sampling, and determine treatment plant and chemical dosage sizes. The document then covers basic requirements of flow meters and various technologies, including differential pressure, velocity, positive displacement, and mass flow meters. It also discusses open channel flow measurement using weirs and flumes.
This document discusses various forms of nitrogen and phosphorus found in water samples and their analysis methods. It describes:
1) The different forms of nitrogen including total Kjeldahl nitrogen (TKN), which is the sum of organic nitrogen and ammonia nitrogen.
2) Methods for analyzing ammonia nitrogen including distillation, Nesslerization, and titration. Organic nitrogen is measured after converting it to ammonia through digestion.
3) The Kjeldahl method for determining TKN which involves sample digestion using sulfuric acid and a catalyst to convert organic nitrogen to ammonia, followed by distillation and ammonia measurement.
The document discusses preliminary treatment units for sewage treatment plants, focusing on bar screens and grit separators. It provides details on the components, design considerations, and operating principles of bar screens including bar rack specifications, head loss calculations, and screen classifications. It also covers grit chamber types, Stoke's law for particle settling velocities, discrete particle settling calculations, and design of horizontal flow grit channels. Key aspects addressed are screen approach channel design, screen raking mechanisms, and grit removal to protect equipment from abrasion.
This document summarizes secondary treatment, which involves the biological removal of biodegradable organic matter from wastewater. It focuses on the activated sludge process (ASP), the most commonly used secondary treatment technique. The ASP uses microbes to convert soluble organic matter into biological flocs that are then removed. Key components of the ASP include an aeration basin for treatment and a secondary clarifier for solids separation. The document also discusses the mechanisms, kinetics, design considerations, and equations for calculating parameters like effluent quality and sludge production rates in the ASP.
The document discusses characterization and measurement of sewage flow. It describes parameters used to characterize sewage such as flow rate, solids, organic matter, nutrients, biological quality, pH and more. Methods of measuring flow rate discussed include differential pressure meters, velocity meters, positive displacement meters, and open channel measurement using weirs and flumes. Key flow meter types are also summarized such as orifice plates, venturi meters, turbine meters, electromagnetic meters and ultrasonic meters.
The document summarizes the activated sludge process for aerobic biological wastewater treatment. It describes the basic concepts, components, and operating principles of the activated sludge system. The key components include the aeration tank, secondary sedimentation tank, recycling system, and surplus sludge treatment. The document also discusses the characteristics of activated sludge, including its physical properties, composition, microorganisms, and performance indicators like MLSS, MLVSS, sludge volume index. It provides operational parameters for evaluating the organic loading rate and sludge loading rate of the aeration tank.
This document provides information about the activated sludge process for wastewater treatment. The activated sludge process uses microorganisms and oxygen to biologically treat wastewater. Microorganisms consume organic matter in the wastewater to grow, reproducing and removing pollutants through metabolic processes. Key components of an activated sludge system include the aeration tank where microorganisms and wastewater are mixed with air, and the secondary clarifier where microorganisms are separated from treated water. The food to microorganism ratio (F:M ratio) is important to balance to maintain effective treatment. Calculations are provided to determine pounds of biochemical oxygen demand (BOD), mixed liquor suspended solids (MLSS),
Regulatory Requirements of Solid Waste Management, Indian ContextAkepati S. Reddy
The document discusses the regulatory requirements for solid waste management in India. It outlines the various rules and laws governing plastic waste, e-waste, biomedical waste, construction waste, and other hazardous wastes. It also describes the duties and responsibilities of various stakeholders in the waste management process like local authorities, pollution control boards, waste generators, and transport and processing facilities. Finally, it provides details on proper waste handling, segregation, storage, collection, transportation, processing, and disposal in accordance with the Solid Waste Management Rules of 2016.
Solid waste bio-methanation plants use anaerobic digestion to stabilize the biodegradable waste fraction and produce biogas. There are two types of digesters: wet digesters which use a liquid slurry system, and dry digesters which process higher consistency waste without water addition. The digestion process involves four stages - hydrolysis, acidogenesis, acetogenesis, and methanogenesis - with acid-forming and methane-forming bacteria and archaea working together to break down organic matter into biogas and digestate. Nutrients and optimal temperature and pH levels must be maintained for the microbes to function effectively in the anaerobic treatment process.
deals with temperature, density, pressure, winds and humidity parameters of the atmosphere; Prssure gradient force, coriolis force, gravity force and friction force and winds and currents, ; pressure lows and highs, atmospheric circulation, winds.
This document discusses various aspects of the water cycle and atmospheric water. It describes how snow, ice, rain, clouds, and water vapor influence weather and the atmosphere. It provides details on evaporation, transpiration, condensation, cloud formation, precipitation, humidity variables, and atmospheric stability. The key points are:
- Atmospheric water amounts to 3100 cubic miles and the earth's average annual rainfall is about 100 cm.
- Water turnover time in the atmosphere is approximately 10 days.
- Clouds form when rising air parcels reach their dew point due to cooling and condensation occurs.
- Atmospheric stability determines whether air parcels can rise to form clouds or remain stable.
1) Radiation transfers heat through electromagnetic waves without a medium and travels at the speed of light. The amount radiated and wavelengths depend on an object's temperature according to Stefan-Boltzmann and Planck's laws.
2) Solar radiation reaches Earth's surface through reflection, scattering, absorption and transmission in the atmosphere. Gases like ozone and oxygen absorb most harmful UV rays while scattering by air molecules causes blue skies.
3) On Earth's surface, radiation is mostly absorbed and re-emitted, with some reflected depending on surface albedo. The atmosphere emits terrestrial radiation both upwards, lost to space, and downwards to the surface.
Deals with the biological removal of nitrogen and phosphorus, Nitrification-denitrification removal of nitrogen, and Phosphate accumulating organisms and poly-hydroxibutirate in the phosphorus removal.
This document provides information on aerobic attached growth systems, specifically trickling filters. Key points include:
- Trickling filters are fixed film bioreactors that use media like rock or plastic to develop biofilms, treating wastewater as it trickles through the media.
- Wastewater flows over the biofilms, exposing them alternately to wastewater and air to facilitate treatment.
- Design considerations include media type, wastewater distribution, ventilation, and secondary clarification after treatment.
- Empirical equations are provided to help design trickling filters based on parameters like organic loading, temperature, media characteristics, and wastewater flow.
Optimizing Post Remediation Groundwater Performance with Enhanced Microbiolog...Joshua Orris
Results of geophysics and pneumatic injection pilot tests during 2003 – 2007 yielded significant positive results for injection delivery design and contaminant mass treatment, resulting in permanent shut-down of an existing groundwater Pump & Treat system.
Accessible source areas were subsequently removed (2011) by soil excavation and treated with the placement of Emulsified Vegetable Oil EVO and zero-valent iron ZVI to accelerate treatment of impacted groundwater in overburden and weathered fractured bedrock. Post pilot test and post remediation groundwater monitoring has included analyses of CVOCs, organic fatty acids, dissolved gases and QuantArray® -Chlor to quantify key microorganisms (e.g., Dehalococcoides, Dehalobacter, etc.) and functional genes (e.g., vinyl chloride reductase, methane monooxygenase, etc.) to assess potential for reductive dechlorination and aerobic cometabolism of CVOCs.
In 2022, the first commercial application of MetaArray™ was performed at the site. MetaArray™ utilizes statistical analysis, such as principal component analysis and multivariate analysis to provide evidence that reductive dechlorination is active or even that it is slowing. This creates actionable data allowing users to save money by making important site management decisions earlier.
The results of the MetaArray™ analysis’ support vector machine (SVM) identified groundwater monitoring wells with a 80% confidence that were characterized as either Limited for Reductive Decholorination or had a High Reductive Reduction Dechlorination potential. The results of MetaArray™ will be used to further optimize the site’s post remediation monitoring program for monitored natural attenuation.
Climate Change All over the World .pptxsairaanwer024
Climate change refers to significant and lasting changes in the average weather patterns over periods ranging from decades to millions of years. It encompasses both global warming driven by human emissions of greenhouse gases and the resulting large-scale shifts in weather patterns. While climate change is a natural phenomenon, human activities, particularly since the Industrial Revolution, have accelerated its pace and intensity
ENVIRONMENT~ Renewable Energy Sources and their future prospects.tiwarimanvi3129
This presentation is for us to know that how our Environment need Attention for protection of our natural resources which are depleted day by day that's why we need to take time and shift our attention to renewable energy sources instead of non-renewable sources which are better and Eco-friendly for our environment. these renewable energy sources are so helpful for our planet and for every living organism which depends on environment.
Recycling and Disposal on SWM Raymond Einyu pptxRayLetai1
Increasing urbanization, rural–urban migration, rising standards of living, and rapid development associated with population growth have resulted in increased solid waste generation by industrial, domestic and other activities in Nairobi City. It has been noted in other contexts too that increasing population, changing consumption patterns, economic development, changing income, urbanization and industrialization all contribute to the increased generation of waste.
With the increasing urban population in Kenya, which is estimated to be growing at a rate higher than that of the country’s general population, waste generation and management is already a major challenge. The industrialization and urbanization process in the country, dominated by one major city – Nairobi, which has around four times the population of the next largest urban centre (Mombasa) – has witnessed an exponential increase in the generation of solid waste. It is projected that by 2030, about 50 per cent of the Kenyan population will be urban.
Aim:
A healthy, safe, secure and sustainable solid waste management system fit for a world – class city.
Improve and protect the public health of Nairobi residents and visitors.
Ecological health, diversity and productivity and maximize resource recovery through the participatory approach.
Goals:
Build awareness and capacity for source separation as essential components of sustainable waste management.
Build new environmentally sound infrastructure and systems for safe disposal of residual waste and replacing current dumpsites which should be commissioned.
Current solid waste management situation:
The status.
Solid waste generation rate is at 2240 tones / day
collection efficiently is at about 50%.
Actors i.e. city authorities, CBO’s , private firms and self-disposal
Current SWM Situation in Nairobi City:
Solid waste generation – collection – dumping
Good Practices:
• Separation – recycling – marketing.
• Open dumpsite dandora dump site through public education on source separation of waste, of which the situation can be reversed.
• Nairobi is one of the C40 cities in this respect , various actors in the solid waste management space have adopted a variety of technologies to reduce short lived climate pollutants including source separation , recycling , marketing of the recycled products.
• Through the network, it should expect to benefit from expertise of the different actors in the network in terms of applicable technologies and practices in reducing the short-lived climate pollutants.
Good practices:
Despite the dismal collection of solid waste in Nairobi city, there are practices and activities of informal actors (CBOs, CBO-SACCOs and yard shop operators) and other formal industrial actors on solid waste collection, recycling and waste reduction.
Practices and activities of these actor groups are viewed as innovations with the potential to change the way solid waste is handled.
CHALLENGES:
• Resource Allocation.
Improving the viability of probiotics by encapsulation methods for developmen...Open Access Research Paper
The popularity of functional foods among scientists and common people has been increasing day by day. Awareness and modernization make the consumer think better regarding food and nutrition. Now a day’s individual knows very well about the relation between food consumption and disease prevalence. Humans have a diversity of microbes in the gut that together form the gut microflora. Probiotics are the health-promoting live microbial cells improve host health through gut and brain connection and fighting against harmful bacteria. Bifidobacterium and Lactobacillus are the two bacterial genera which are considered to be probiotic. These good bacteria are facing challenges of viability. There are so many factors such as sensitivity to heat, pH, acidity, osmotic effect, mechanical shear, chemical components, freezing and storage time as well which affects the viability of probiotics in the dairy food matrix as well as in the gut. Multiple efforts have been done in the past and ongoing in present for these beneficial microbial population stability until their destination in the gut. One of a useful technique known as microencapsulation makes the probiotic effective in the diversified conditions and maintain these microbe’s community to the optimum level for achieving targeted benefits. Dairy products are found to be an ideal vehicle for probiotic incorporation. It has been seen that the encapsulated microbial cells show higher viability than the free cells in different processing and storage conditions as well as against bile salts in the gut. They make the food functional when incorporated, without affecting the product sensory characteristics.
Epcon is One of the World's leading Manufacturing Companies.EpconLP
Epcon is One of the World's leading Manufacturing Companies. With over 4000 installations worldwide, EPCON has been pioneering new techniques since 1977 that have become industry standards now. Founded in 1977, Epcon has grown from a one-man operation to a global leader in developing and manufacturing innovative air pollution control technology and industrial heating equipment.
Presented by The Global Peatlands Assessment: Mapping, Policy, and Action at GLF Peatlands 2024 - The Global Peatlands Assessment: Mapping, Policy, and Action
Microbial characterisation and identification, and potability of River Kuywa ...Open Access Research Paper
Water contamination is one of the major causes of water borne diseases worldwide. In Kenya, approximately 43% of people lack access to potable water due to human contamination. River Kuywa water is currently experiencing contamination due to human activities. Its water is widely used for domestic, agricultural, industrial and recreational purposes. This study aimed at characterizing bacteria and fungi in river Kuywa water. Water samples were randomly collected from four sites of the river: site A (Matisi), site B (Ngwelo), site C (Nzoia water pump) and site D (Chalicha), during the dry season (January-March 2018) and wet season (April-July 2018) and were transported to Maseno University Microbiology and plant pathology laboratory for analysis. The characterization and identification of bacteria and fungi were carried out using standard microbiological techniques. Nine bacterial genera and three fungi were identified from Kuywa river water. Clostridium spp., Staphylococcus spp., Enterobacter spp., Streptococcus spp., E. coli, Klebsiella spp., Shigella spp., Proteus spp. and Salmonella spp. Fungi were Fusarium oxysporum, Aspergillus flavus complex and Penicillium species. Wet season recorded highest bacterial and fungal counts (6.61-7.66 and 3.83-6.75cfu/ml) respectively. The results indicated that the river Kuywa water is polluted and therefore unsafe for human consumption before treatment. It is therefore recommended that the communities to ensure that they boil water especially for drinking.
Kinetic studies on malachite green dye adsorption from aqueous solutions by A...Open Access Research Paper
Water polluted by dyestuffs compounds is a global threat to health and the environment; accordingly, we prepared a green novel sorbent chemical and Physical system from an algae, chitosan and chitosan nanoparticle and impregnated with algae with chitosan nanocomposite for the sorption of Malachite green dye from water. The algae with chitosan nanocomposite by a simple method and used as a recyclable and effective adsorbent for the removal of malachite green dye from aqueous solutions. Algae, chitosan, chitosan nanoparticle and algae with chitosan nanocomposite were characterized using different physicochemical methods. The functional groups and chemical compounds found in algae, chitosan, chitosan algae, chitosan nanoparticle, and chitosan nanoparticle with algae were identified using FTIR, SEM, and TGADTA/DTG techniques. The optimal adsorption conditions, different dosages, pH and Temperature the amount of algae with chitosan nanocomposite were determined. At optimized conditions and the batch equilibrium studies more than 99% of the dye was removed. The adsorption process data matched well kinetics showed that the reaction order for dye varied with pseudo-first order and pseudo-second order. Furthermore, the maximum adsorption capacity of the algae with chitosan nanocomposite toward malachite green dye reached as high as 15.5mg/g, respectively. Finally, multiple times reusing of algae with chitosan nanocomposite and removing dye from a real wastewater has made it a promising and attractive option for further practical applications.
Evolving Lifecycles with High Resolution Site Characterization (HRSC) and 3-D...Joshua Orris
The incorporation of a 3DCSM and completion of HRSC provided a tool for enhanced, data-driven, decisions to support a change in remediation closure strategies. Currently, an approved pilot study has been obtained to shut-down the remediation systems (ISCO, P&T) and conduct a hydraulic study under non-pumping conditions. A separate micro-biological bench scale treatability study was competed that yielded positive results for an emerging innovative technology. As a result, a field pilot study has commenced with results expected in nine-twelve months. With the results of the hydraulic study, field pilot studies and an updated risk assessment leading site monitoring optimization cost lifecycle savings upwards of $15MM towards an alternatively evolved best available technology remediation closure strategy.
2. Biological water quality testing
Interest is to know about presence of waterborne pathogens
– Too many varieties to test and not feasible for direct methods
Presence and density of indicator organisms is established
Fecal contamination of water is established through testing for the
presence and density of an indicator organism
– Fecal matter of the infected is source for pathogens
– Fecal contamination indicates higher probability of pathogen presence
Coliform bacteria (Escherichia coli), specifically fecal coliform is the
indicator organism
– It is present in water, whenever fecal contamination is there, in larger
numbers than any of the water borne pathogens
– Testing for its presence and density is cheaper, easier and faster
– Working with it does not produce serious health threats to laboratory
workers
3. • Actually tested for Total Coliform Count
– Since coliform can also be contributed by sources other
than fecal contamination, waters may also be tested for
Fecal Coliform Count
– Incubation temperatures are different (35C for total
coliform and 44.5C for fecal coliform)
• Two techniques are used to test waters for coliform
count
– Multiple tube fermentation technique
– Membrane filtration technique
Biological water quality testing
4. Sample collection,
preservation and storage
Cleaned, rinsed (final rinse with distilled water) and sterilized
(either by dry or wet heat) sampling bottles are used
For collecting samples with residual chlorine, to prevent
continued bactericidal action, sodium thiosulfate is added to
sample bottles prior to sample collection
– 100 mg/l in case of wastewater samples
– 18 mg/l in case of drinking water
For collecting samples with high copper or zinc or high heavy
metals add chetaling agent EDTA to the bottle prior to
sterilization to give 372 mg/l in the sample
5. Sample collection,
preservation and storage
Sample collection
– Use aseptic conditions
– Do not contaminate inner surface of stopper and bottle’s neck
and keep bottle closed untill to be filled with sample
– Fill without rinsing and replace stopper immediately
– Leave ample space (2.5 cm) to facilitate mixing by shaking
Sample collection from a tap
– Run the tap full for 2 to 3 min. to clear the pipeline, reduce
water flow to permit sample collection without splashing
– Avoid sampling from leaking taps
– Remove tap attachments (screen/splash guard!)
– If you desire clean tap tip with hypochlorite (100 mg/l), and run
it fully opened for 5-6 min prior to sample collection
6. Sample collection,
preservation and storage
Sample collection from other sources
• In case of hand pump, run it for 5 min. prior to sampling
• In case of a well sterilized bottle can be fitted with weight at
the base and used
– Avoid contact with bed
• Avoid taking sample too near to banks or far from water draw
off point in case of river/lake/spring/shallow well
– If collecting from boat collect from upstream side
– Hold bottle near base, plunge it below water surface with neck
downward, turn it until its neck points slightly upwards and
mouth directed towards water current and collect sample (if no
current push bottle forward to create)
– Special apparatus can be used to mechanically remove stopper
under the water surface
7. Start testing promptly
– If not to be started within 1 hr. ice cool the sample
Transport sample within 6 hr while holding temperature <10C
– Use ice cooler for sample storage during transport
If testing not started within 2 hrs of receipt refrigerate
– Time elapsed between collection and testing should be <24 hrs
Record time elapsed and temperature of storage for each of the
samples analysed
Sample collection,
preservation and storage
8. Multiple Tube Fermentation Test
Also known as MPN test (Most Probable Number)
• An estimate of mean density of coliforms - reported as MPN/100 ml
• Poisson distribution (random dispersion) of coliforms is assumed
Defintion of coliform bacteria for MPN test: All aerobic and
facultative anaerobic gram negative, non-spore forming, rod
shaped bacteria that ferment lactose with gas and acid
formation within 48 hrs at 35C
9. Multiple-tube fermentation technique
Conducted in 3 phases
• Presumptive test
– Serial dilutions of a sample (to extinction) are incubated in
multiple tubes of lauryl tryptose broth at 35°C for 48 hrs
– Positive results (production of gas/acid) is an indication for the
presence of coliforms
• Confirmed test
– Sample from positive tubes of presumptive test are incubated in
tubes of Brilliant Green Lactose Bile (BGLB)/MacConkey Broth at
35°C or in tubes of EC/A1 broth at 44.5°C
– Positive result confirms presence of coliforms in case of BGLB
tubes and presence of fecal coliforms in case of EC broth tubes
10. Multiple-tube fermentation technique
• Completed test
– Involves streaking of LES Endo agar plates with inoculum from
positive BGLB/MaCB or EC/A1 broth tubes for obtaining isolated
colonies
– Gram stain the cells from isolated colonies and examine under
microscope
– Gram negative, non-spore forming, rod shaped bacteria are
coliforms – completion test
• Calculation of MPN is
– Directly from Poisson distribution
– From the MPN tables
– By Thomas equation
11. Presumptive phase of MPN test
Lauryl tryptose broth or alternatively lactose broth is used as
medium
Dehydrated medium is mixed in distilled water, and heated to
dissolve the ingredients after pH adjustment
– Bromocresol purple (0.01 g/L) can be added for indicating acid
production
– Double strength medium is also required
– Quantity required depends on number of samples and number
of decimal dilutions
12. Presumptive phase of MPN test
Medium is dispensed into fermentation tubes with inverted vials
(Derham tubes)
– Dispense double strength medium into the tubes that will be
inoculated with 10 ml sample to avoid dilution of ingredients
below the standard medium level
– Ensure that the medium level in the tubes is sufficient to totally
submerge the inverted vials
– 9 or 10 ml medium is usually dispensed into each tube
Close fermentation tubes with heat resistant caps and sterilize in
autoclave
13.
14. Presumptive phase of MPN test
Decimal dilution and inoculation of fermentation tubes
• Done in inoculation chambers aseptically and requires
– Sterilized dilution tubes each with 9 ml of dilution water
– Sterilized 1 ml and 10 ml capacity pipettes
Sterilized fermentation tubes with contamination free medium
and air bubble free inverted vials are used
– 3 or 5 fermentation tubes at each of the decimal dilutions
– One set of 3 or 5 tubes will be of double strength medium
15. Presumptive phase of MPN test
Thoroughly mix the sample in sample bottle and aseptically
transfer 10 ml into each of the set of fermentation tubes with
double strength medium
– transfer 1 ml of the sample into a sterilized dilution tube with 9
ml of dilution water
Thoroughly mix dilution tube contents and transfer 1 ml into
each of the 3-tube set with single strength medium
– transfer 1 ml of diluted sample from the dilution bottle into the
next dilution tube
Repeat the dilution and inoculation process till the desired level
of dilution is reached
– Dilution to extinction is the concept behind the decision
– Use a separate sterile pipette for each of the dilution
– Shake vigorously (samples & dilutions) while preparing
– Sample volumes used are 10, 1, 0.1, 0.01, 0.001, …
16.
17. Presumptive phase of MPN test
Mix fermentation tube contents after inoculation (through gentle
agitation) and incubate at 35±0.5C
After 24±2 hours of incubation shake each of the tubes gently and
examine for gas in the inverted vials or acidic growth
– If no gas or no acidic growth, reincubate and reexamine at the
end of 48±3 hours for gas or acidic growth
Record results (number of positive tubes for each dilution) and submit
positive tubes for confirmation phase of the test
– From recorded results read MPN value from MPN table
– If a positive tube of presumptive test gives negative result in the
confirmation phase accordingly adjust the results
18. Confirmed phase of the test
Conducted on only the positive presumptive tubes
– If all tubes are positive at 2 or more dilutions, then conduct the
test on all the tubes of the highest dilution of positive reaction
and on all positive tubes of subsequent dilutions
Can be conducted simultaneously for both total coliforms and fecal
coliforms
– Fermentation tubes with Brilliant Green Lactose Bile Broth
(BGLB)/MaCB for total coliforms
– Fermentation tubes with EC/A1 medium for fecal coliforms
Inoculate one BGLB/MaCB tube (and/or one EC/A1 broth tube) from
each of the positive presumptive tubes
– Gently shake or rotate the positive tube of presumptive test to
resuspend microorganisms
– Transfer a loop full of the culture into the BGLB/MaCB and/or
EC/A1 tube with a 3 mm diameter sterile metal loop
19. Confirmed phase of the test
Incubate inoculated BGLB/MaCB tubes at 35±0.5°C
– Gas production within 48±3 hours of incubation is taken as
positive confirmed total coliform reaction
Incubate EC/A1 broth tubes within 30 minutes of inoculation in water
bath at 44.5±0.2°C
– Immersed in the bath till medium level in the tubes is below the
water level in the water bath
– Gas production within 24±2 hours of incubation is taken as a
positive confirmed fecal coliform reaction
Adjust recorded results of the presumptive test if any of the positive
presumptive tubes gave negative reaction
– The results adjusted on the basis of negative results with
BGLB/MaCB tubes give total coliform count
– Results adjusted on the basis of negative results with EC/A1
medium tubes give fecal coliform count
20. Completed test
Meant to definitively establish presence of coliform bacteria in the
positive confirmed tubes
Positive confirmed tubes of EC/A1 broth at elevated temperature do
not require completed test
– Positive confirmed tubes are taken as positive completed test
responses
Completed test involves
• Streaking one LES endo agar petriplate from each of the positive
BGLB/MaCB confirmed tube to obtain discrete colonies
21.
22. Completed test
• Picking up a typical colony (or atypical colony) that is most likely
consist of coliform bacteria and transfering to
– A lauryl tryptose broth fermentation tube to check for gas
production on incubation at 35±0.5C for 24±2 hours
– A nutrient agar slant for incubating for 24 hours and obtaining
bacterial culture for Gram staining and microscopic examination
• Microscopic examination of bacterial culture of the nutrient agar
slant after gram staining
Production of gas in the lauryl tryptose broth and demonstration of
gram negative, non-spore forming rod shaped bacteria are taken as
positive results
If the result is negative accordingly adjust the results recorded during
presumptive test
23. Liquify sterile LES endo agar, aseptically pour into sterile petri
plates and allow the poured medium to solidify
Gently shake or rotate the positive confirmed tube to resuspend
the organisms, take a loopful of the culture and streak an LES
endo agar plate
– Avoid picking up of any scum or floating membrane by the
inoculation loop
– Do streaking in such a way that isolated colonies obtained
Incubate the streaked plates at 35±0.5C for 24±2 hours
Completed test
24. Bacterial colonies developed on the plate are divisible into
• Typical colonies: pink to dark red colonies with a green metallic
surface sheen (covering the entire colony, or appearing only in a
central area or on the periphery)
• Atypical colonies: pink, red, white or colourless colonies without
green metallic surface sheen
• Other colonies: non-coliform colonies
Pick up one or more typical colonies for inoculating the
secondary lauryl tryptose broth tubes and the nutrient agar
slants
– in the absence of typical colonies pick up the colonies that are likely to
contain coliforms
Completed test
25. • Place a loopful of dilution water in the center of microscopic slide
and add to the water drop a loopful of the bacterial culture of the
nutrient agar slant
– Also maintain separate gram positive and gram negative control
cultures on the same microscopic slide for comparison
• Spread the culture in the water drop to make uniform dispersion
over an area of the slide, and then air dry & heat fix
• Stain the heat fixed smear with ammonium oxalate – crystal violet
solution for 1 min., rinse with tap water and drain off
– Ammonium oxalate – crystal violet solution: mix 2 g of crystal violet,
in 20 ml 95% ethyl alcohol, and 0.8 g ammonium oxalate, in 80 ml
distilled water, age for 24 hrs and filter
Completed test
26. • Apply iodine solution for one min., rinse with tap water and allow
acetone alcohol solvent to flow across the smear till colourless
solvent starts flowing off from the slide
– Lugol’s solution (Iodine solution): Grind 1 g iodine crystals and 2 g KI in
a mortar first dry then with distilled water till solution is formed, and
rinse the solution into amber bottle with 300 ml distilled water
– Acetone-alcohol solvent: 1:1 mixer of 95% alcohol and acetone
• Counterstain the smear with safranin for 15 sec., rinse with tap
water, blot day and then examine microscopically
– Counterstain: dissolve 2.5 g safranin dye in 100 ml of 95% ethyl alcohol
and then add 10 to 100 ml distilled water
Completed test
27. Estimation of bacterial density
Estimated from the results of the presumptive phase of the test, after
necessary adjustments made consequent to the negative results of
confirmed phase and completed phase
Bacterial density is read from MPN index table corresponding to the
number of positive tubes for 3 consecutive dilutions
– MPN index table for 5 tubes per dilution and the table for 3 tubes per
dilution are different
– MPN index table relates the number of positive tubes at 10, 1 and 0.1
ml sample volumes to MPN/100 mL
– When dilutions considered are different from 10, 1 and 0.1 ml, for
calculating MPN (from the index table reading) use
considereddilutionlowesttheatsampleofmL
tablereadingMPN
mlMPNMPN
10
)100/(
28. Estimation of Bacterial Density
When tested at sample volumes beyond 10, 1 and 0.1 ml, choose the
results of highest dilution (at which all the tubes are positive) and
the next two dilutions
5/5-5/5-2/5-0/5 ..-5-2-0
5/5-4/5-2/5-0/5 5-4-2-..
Of all the dilutions tested if only one gave positive results then
consider results of that dilution and of one dilution below and one
dilution above it
0/5-0/5-1/5-0/5-0/5 ..-0-1-0-..
If positive results are obtained even at a dilution beyond the series of
dilutions considered then add that positive result to the results of
the highest dilution considered
5/5-3/5-2/5-1/5 5-3-2-..
5/5-3/5-2/5-0/5 5-3-2-..
29. Estimation of bacterial density
MPN index table do not include the unlikely combination of results
(the combination whose probability is <1%)
– Obtaining the unlikely combination of results usually indicates faulty
multiple tube fermentation technique
The MPN index table can also include 95% confidence limits
For estimating MPN from the unlikely combination of results and from
the results of a test where decimal dilutions are not used, use the
following (Thomas) equation:
Precision of multiple tube fermentation test is low because of random
distribution and clustering of the coliform bacteria
tubestheall
insampleofmL
tubesnegative
insampleofmL
tubespositiveofNumber
mlMPN
100
100/
30. MPN test for fecal coliforms
Elevated incubation temperature is used for the separation
of coliforms into those of coliform origin and those of
non-coliform origin
Two approaches can be followed
• Use of EC broth and incubation at 44.5±0.2C in the
confirmation phase of the test
• Use of a single step method with A-1 medium in place of the
three phase total coliform test
– EC medium is not recommended in place of A-1 medium – prior
enrichment in the presumptive medium is needed
– Inoculated tubes of A-1 broth need incubation first at 35±0.5C
for 3 hours and then at 44.5±0.2C for 21±2 hours in a water
both
– Gas production within 24 hours of incubation is a positive
reaction for fecal coliform
31. Membrane filtration technique
Alternative to multiple tube fermentation technique
More precise, relatively more rapid and highly reproducible technique
Relatively large volumes of sample can be tested and even saline
waters can be tested
Not good for waters with high turbidity and high in non-coliform
bacteria, and presence of toxic substances result in low estimates
Results from membrane filtration are lower than from multiple tube
fermentation test due built in positive statistical bias
32. Membrane filtration technique
Definition of coliform bacteria for membrane filtration technique
– Aerobic and facultative anaerobic, gram negative, non-spore-
forming, rod shaped bacteria
– Bacteria that develop red colonies with metallic sheen within 24
hrs of incubation at 35C on Endo-type medium with lactose
– Pure cultures produce negative cytochrome oxidase reaction
and positive -galactosidase reaction
All red, pink, blue, white or colourless colonies (atypical colonies)
lacking metallic sheen are considered as non-coliforms
33. Membrane filtration technique
Measured volume of sample is filtered through a membrane
filter that completely retains coliform bacteria
– Duplicate volumes or quadruplicate volumes of a sample or a few
portions of a sample each of a different volume are also often filtered
for testing
Filter with coliforms is transferred to petri plates with LES Endo
agar or M Endo agar medium and inverted plates with filter
are incubated at 35±0.5C for 24 hours
– Filter can also be transferred to the surface of the absorbent pad
saturated with liquid medium and placed in a petri plate and
incubated
– For enrichment the filter can be incubated over an absorbent pad
saturated with lauryl tryptose broth for 1.5 to 2 hours at 35±0.5C in
an atmosphere of 90% relative humidity prior to incubation on endo
medium for 20 to 22 hours
34.
35. Membrane filtration technique
After 24 hours of incubation count the number of coliform colonies
developed
– An ideal sample size is supposed to give about 50 coliform colonies
and <200 colonies of all types
– More than this number of colonies demand use of lesser volume of
the sample
– Smaller number of colonies need use of larger sample volume
From the number of colonies counted coliform count for the sample is
calculated by
The correct the calculated coliform count by multiplying with positive
verification percentage
filteredsampleofmL
countedcoloniesColiform
mLcoloniesColiform
100
100/
36. Membrane filtration technique
Coliform verification
• Necessary because typical metallic sheen colonies can often be
produced by non-coliform bacteria
• Verify 10% of the colonies or a minimum of 5 colonies or all the
metallic sheen colonies
• Can be by inoculating a lauryl tryptose broth tube with a colony,
incubating at 35±0.5C and observing for gas production after 48
hours of incubation (gas production is a positive test)
• Can be by cytochrome oxidase (CO) reaction test and by -
galactosidase (ONPG) reaction test – coliform reactions are negative
for CO and positive for ONPG
• Based on the verification the colony count the calculated coliform
count should be corrected
37. Membrane filtration technique for fecal coliforms
• The filter is incubated on M-FC medium at 44.5±0.2C for 24±2
hours in water bath
• Fecal coliform colonies are various shades of blue
– Pale yellow colonies are atypical – verify these for gas production in
mannitol at 44.5C
– Non-fecal coliform colonies are gray to cream coloured
Membrane filtration technique
38. Delayed incubation procedure
• Immediate performance of standard coliform test on the collected
sample may not always be feasible
• In such cases delayed incubation procedure is followed
– The sample is aseptically filtered immediately and the filter is placed
over a transport media for the transit till it is transferred to the actual
medium for standard testing
• Transport media are designed to keep the coliforms viable and
generally do not permit visible growth during transit time
– In case of total coliforms testing LES MF holding medium or M-Endo
preservative medium is used
– M-Endo medium after boiling to dissolve agar is cooled to below 50C
and then 3.84 g/l of sodium benzoate is added to obtain M-Endo
preservative medium
– In case of fecal coliforms testing M-VFC holding medium is used
Membrane filtration technique
39. Dilution water and peptone water
Distilled water or demineralized water used should be free from traces of
contaminating nutrients, dissolved metals, and bactericidal or inhibitory
compounds
Dilution water: Add 1.5 ml of stock phosphate buffer solution and 5 ml
of magnesium chloride solution per liter of distilled water and
autoclave
– Stock phosphate buffer: Dissolve 34 g KH2PO4 in 500 ml distilled water,
adjust pH to 7.2±0.5 and makeup final volume to one liter
– Dissolve 81.1 g of MgCl2.6H2O in distilled water and adjust final volume
to one liter
Peptone water: prepare 0.1% peptone solution from 10% stock peptone
solution, adjust pH to 6.8 and autoclave
Microbial suspensions in dilution water should not be maintained beyond
30 min. (death or multiplication of bacteria can occur)
40. Culture media: Preparation and storage
Dehydrated media in the form of free flowing powders are available
– Medium can also be prepared from its specified base ingredients
– Associated with the non-uniformity of composition
Dehydrated media stored in tightly closed bottles in dark low humidity
atmosphere at <30C is used
– Avoid using discoloured, caked and not-freely flowing media
– Use procured media (those containing sodium azide, bile salts or
derivatives, antibiotics, amino acids with sulfur) within 1 year
– After opening the bottle consume the medium within 6 months
41. Culture media: Preparation and storage
Rehydrate the medium and adjust pH to specified value
– Titrate small of the prepared medium to know the amount of acid or
alkali needed for pH adjustment
– Unless having buffering salts sterilization can reduce medium pH by 0.1
to 0.3 units
– Overheating of a reconstituted medium can produce unacceptable final
pH
Dispense rehydrated medium into culture tubes within 2 hours and
sterilize
Sterilize in autoclave at 121C for 15 minutes
– Quickly cool the sterilized medium to avoid decomposition of
constituent sugars
– Avoid decomposition through sterilizing broths with sugars in 45 min
cycle (use 121C for 12-15 min.)
– A-1 broth is sterilized at 121C for 10 min.
Follow manufacturer’s directions for the rehydration and sterilization
42. Culture media: Preparation and storage
Use a prepared medium within one week
Do not store an unsterilized medium
• Fermentation tubes with medium can be stored at 25C
– Store out of direct sun light
– A-1 broth is stored in dark at room temp. for <7 days
– Avoid contamination and excessive evaporation (discard the tubes with
evaporation loss >1 ml)
• For storage beyond one week refrigerate
– Before use, keep refrigerated tubes overnight in incubator at 35C and
discard contaminated tubes and tubes with bubbles
• Medium in screw capped tubes can be stored for 3 months
43. Lauryl tryptose broth
Tryptose 20 g
Lactose 5 g
K2HPO4 2.75 g
KH2PO4 2.75 g
NaCl 5 g
Sodium lauryl sulfate 0.1 g
Volume of medium 1 liter
pH after sterilization 6.8±0.2
Brilliant green lactose bile broth
Peptone 10 g
Lactose 10 g
Oxgall 20 g
Brilliant green 0.0133 g
Volume of medium 1 liter
pH after sterilization 7.2±0.2
Base ingredients of different media used
Lactose broth
Beef extract 3 g
Lactose 5 g
Peptone 5 g
Volume of medium 1 liter
pH after sterilization 6.9±0.2
EC Medium
Tryptose or trypticase 20 g
Lactose 5 g
Bile salts mixture or
bile salt no.-3
1.5 g
K2HPO4 4 g
KH2PO4 1.5 g
NaCl 5 g
Distilled water 1 liter
pH after sterilization 6.9±0.2
44. Nutrient Agar
peptone 5 g
Beef extract 3 g
Agar 15 g
Volume of medium 1 liter
pH after sterilization 6.8±0.2
LES Endo agar
Yeast extract 1.2 g
Casitone or trypticase 3.7 g
Thiopeptone or
thiotone
3.7 g
Tryptose 7.5 g
K2HPO4 3.3 g
KH2PO4 1.0 g
NaCl 3.7 g
Sodium desoxycholate 0.1 g
Sodium lauryl sulfate 0.05 g
Sodium sulfite 1.6 g
Basic fuchsin 0.8 g
Agar 15 g
Volume of medium 1 liter
Base ingredients of different media used
45. MacConkey broth
peptone 17 g
Proteose peptone 3 g
Lactose 10 g
Bile salts 1.5 g
NaCl 5 g
Neutral red 0.03 g
Crystal violet 0.001 g
Volume of medium 1 liter
A-1 broth
Lactose 5 g
Tryptone 20 g
NaCl 5 g
Salicin 0.5 g
Polyethylene glycol
p-isooctylphenyl ether
1.0 ml
Volume of medium 1 liter
pH adjustment 6.9±0.1
Add polyethylene glycol after heat
dissolving all solid ingredients
Base ingredients of different media used
46. LES Endo agar
Yeast extract 1.2 g
Casitone or trypticase 3.7 g
Thiopeptone or thiotone 3.7 g
Tryptose 7.5 g
Lactose 9.4 g
K2HPO4 3.3 g
KH2PO4 1.0 g
NaCl 3.7 g
Sodium desoxycholate 0.1 g
Sodium lauryl sulfate 0.05 g
Sodium sulfite 1.6 g
Basic fuchsin 0.8 g
Agar 15 g
Volume of medium 1 liter
Distilled water with 20 ml/l of 95%
ethanol is used – controls background
growth and coliform colony size
Almost boil to dissolve agar but not
sterilize by autoclaving
Base ingredients of different media used
M- Endo agar
Tryptose and polypeptone 10 g
Casitone or trypticase 5 g
Thiopeptone or thiotone 5 g
Yeast extract 1.5 g
Sodium chloride 5 g
Lactose 12.5 g
K2HPO4 4.375 g
KH2PO4 1.375 g
Sodium desoxycholate 0.1 g
Sodium lauryl sulfate 0.05 g
Sodium sulfite 2.1 g
Basic fuchsin 1.05 g
Agar 15 g
Volume of medium 1 liter
Distilled water with 20 ml/l of 95%
ethanol is used – controls background
growth and coliform colony size
Almost boil to dissolve agar but not
sterilize by autoclaving
47. M-FC medium
Lactose 12.5 g
Tryptose or biosate 10 g
Proteose peptone No. 3
or polypeptone
5 g
Yeast extract 3 g
NaCl 5 g
Bile salt No. 3 or bile
salts mixture
1.5 g
Aniline blue 0.1 g
Volume 1 liter
Rehydrate in distilled water
containing 10 mL 1% rosolic acid in
0.2N NaOH.
Heat to near boiling and then
promptly cool to below 50C but do
not autoclave
M-VFC holding medium
Casitone, vitamin free 0.2 g
Sodium benzoate 4 g
sulfanilamide 0.5 g
Ethanol (95%) 10 ml
Distilled water 1 liter
Final pH 6.7
Heat dissolve the medium and sterilize by
filtration (pore size of filter 0.22µm)
LES MF holding medium
Tryptone 3 g
M-Endo broth MF 3 g
K2HPO4 3 g
Paraaminobenzoic acid 1.2 g
Agar 15 g
Distilled water 1 liter
Rehydrate in distilled water, heat to boiling to
dissolve agar and cool to 50C
Aseptically add 1 g of sodium benzoate, 1 g
of sulfanilamide and 0.5 g of cycloheximide
Base ingredients of
different media used