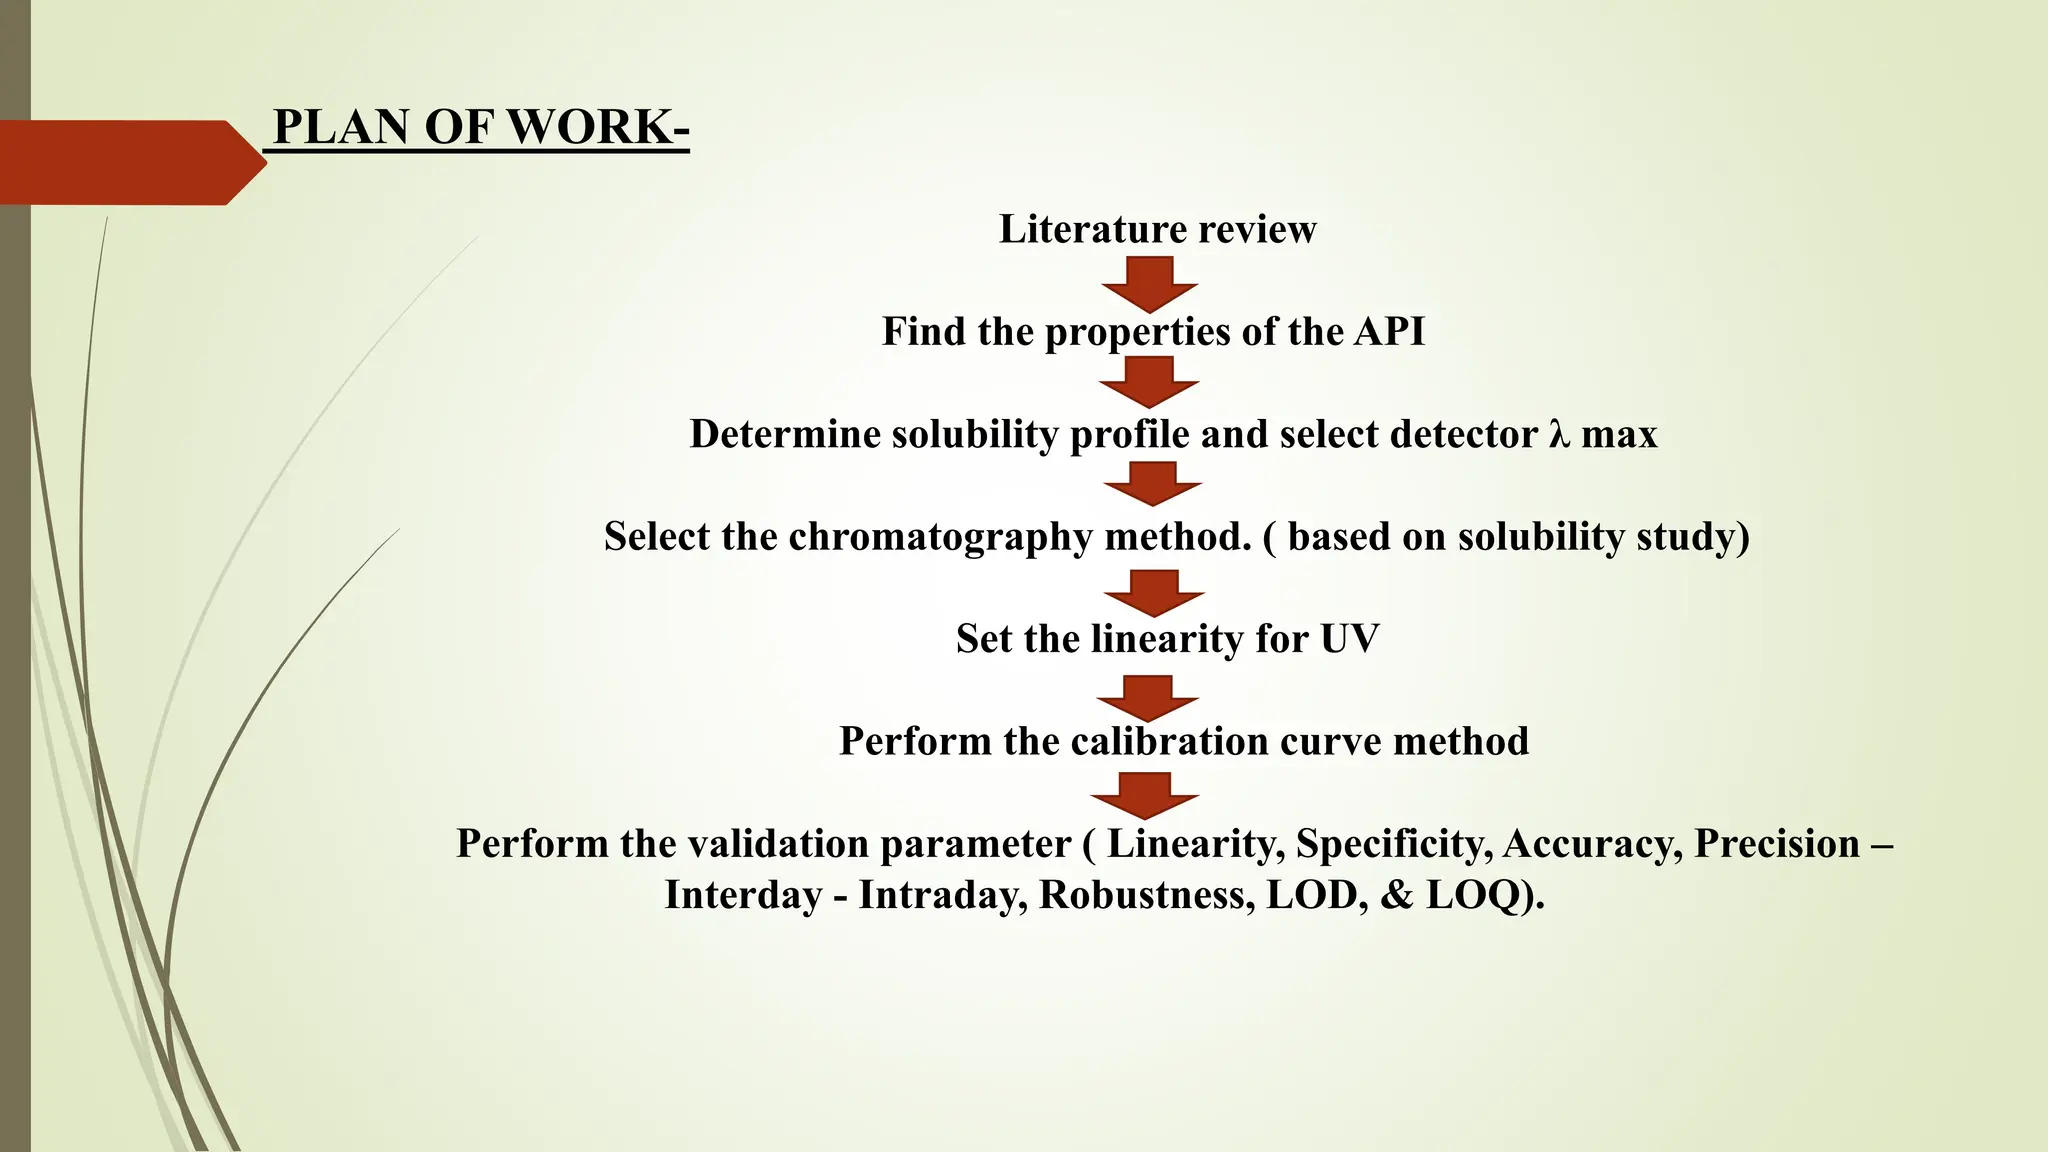
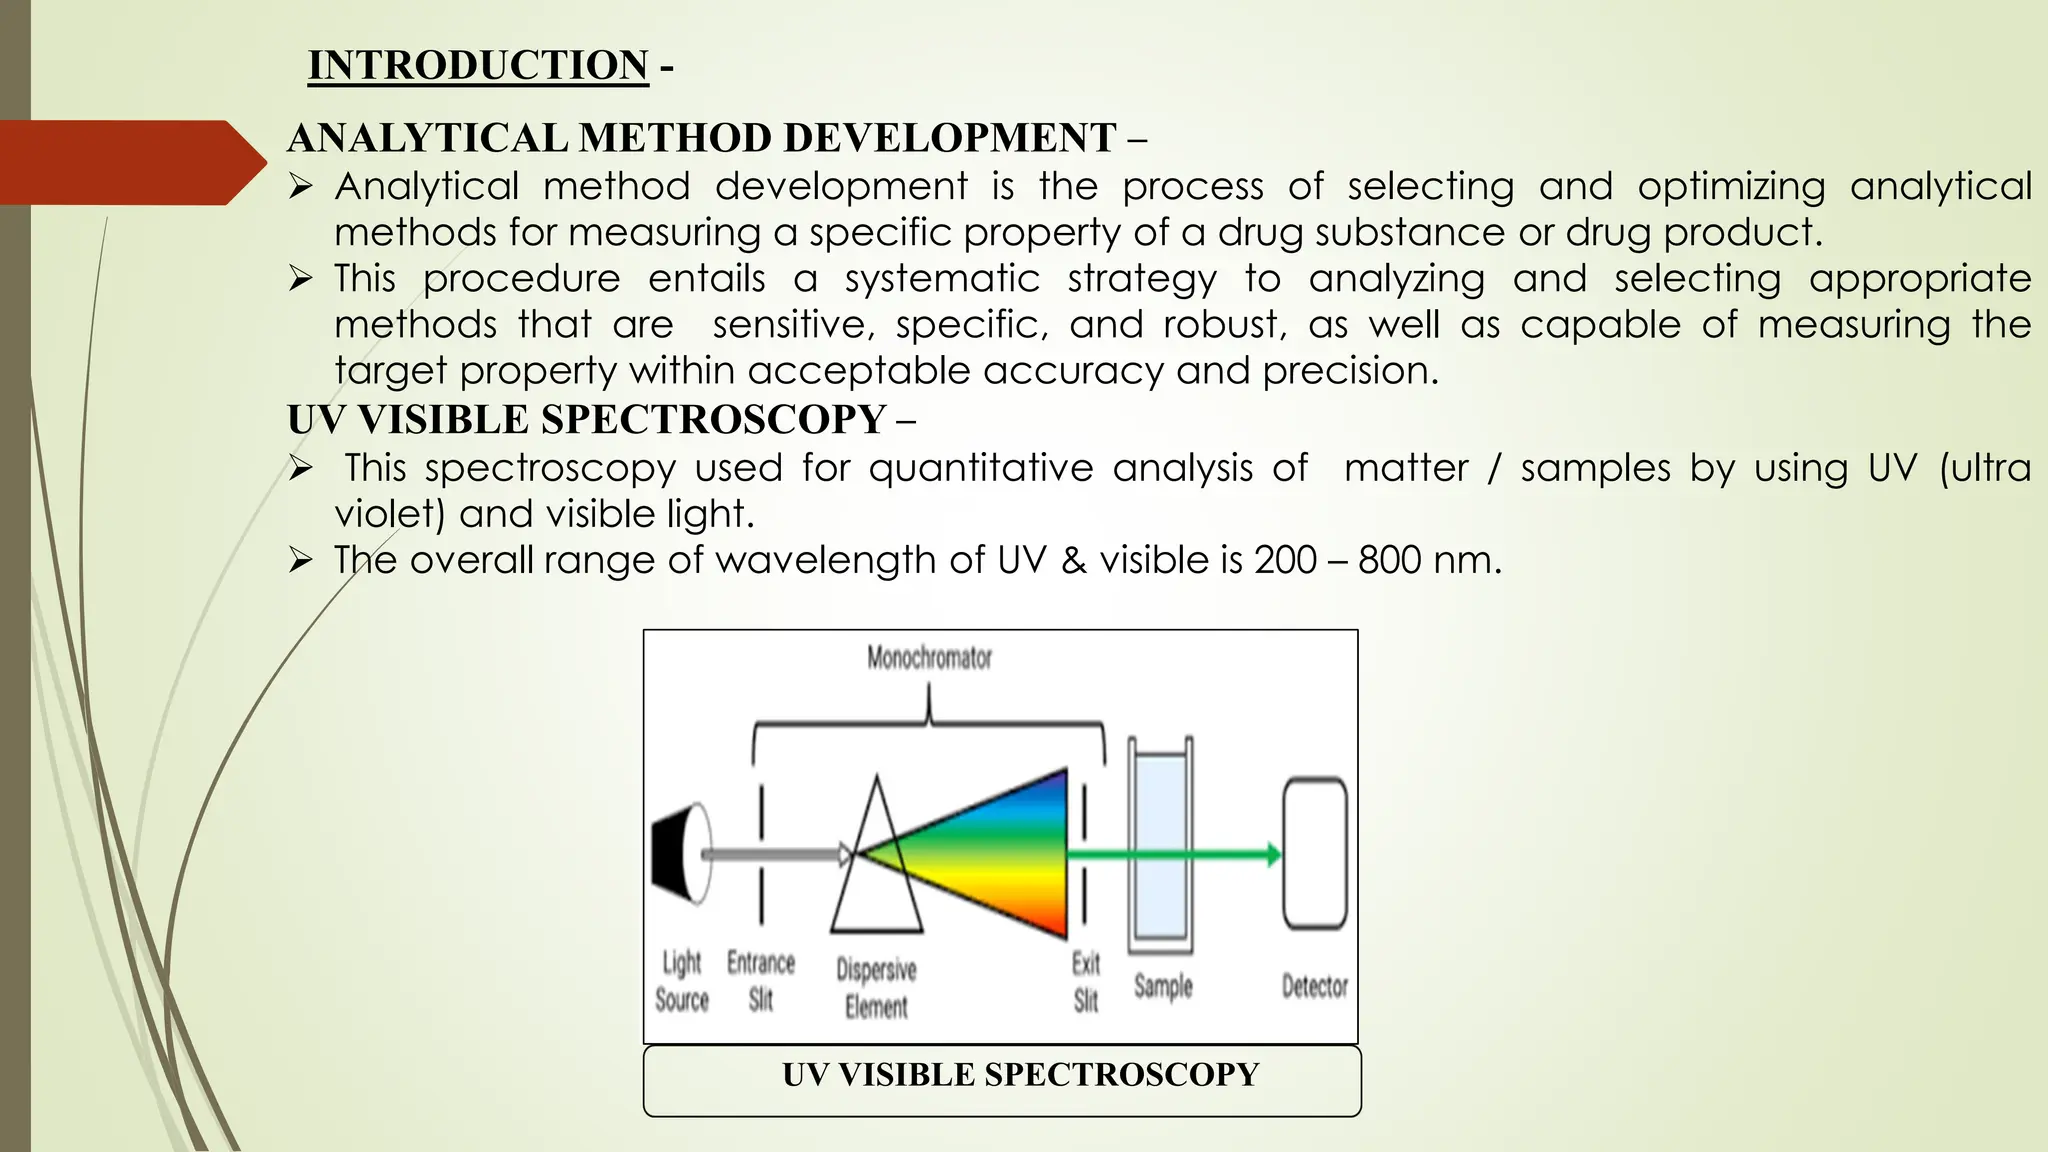
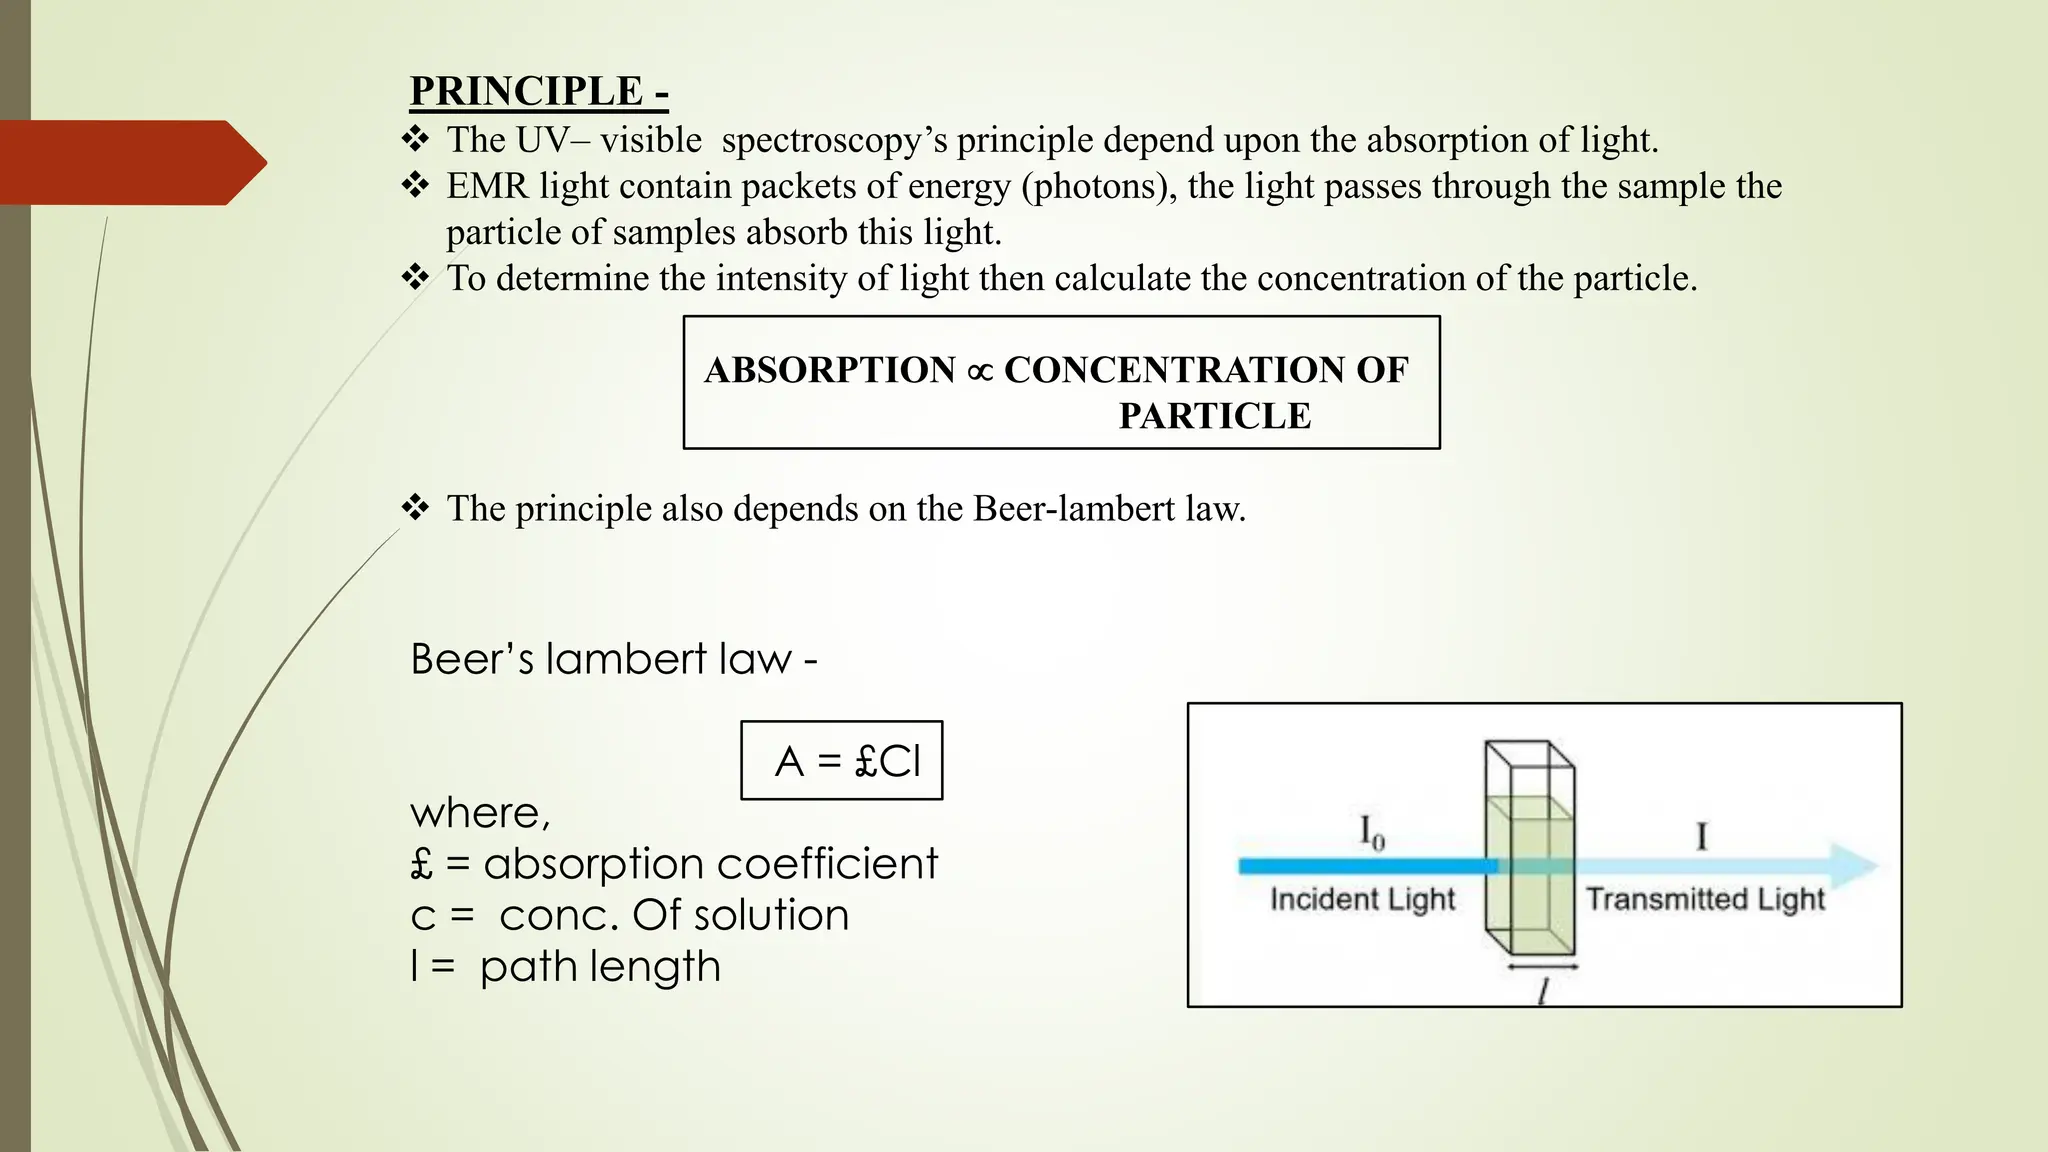
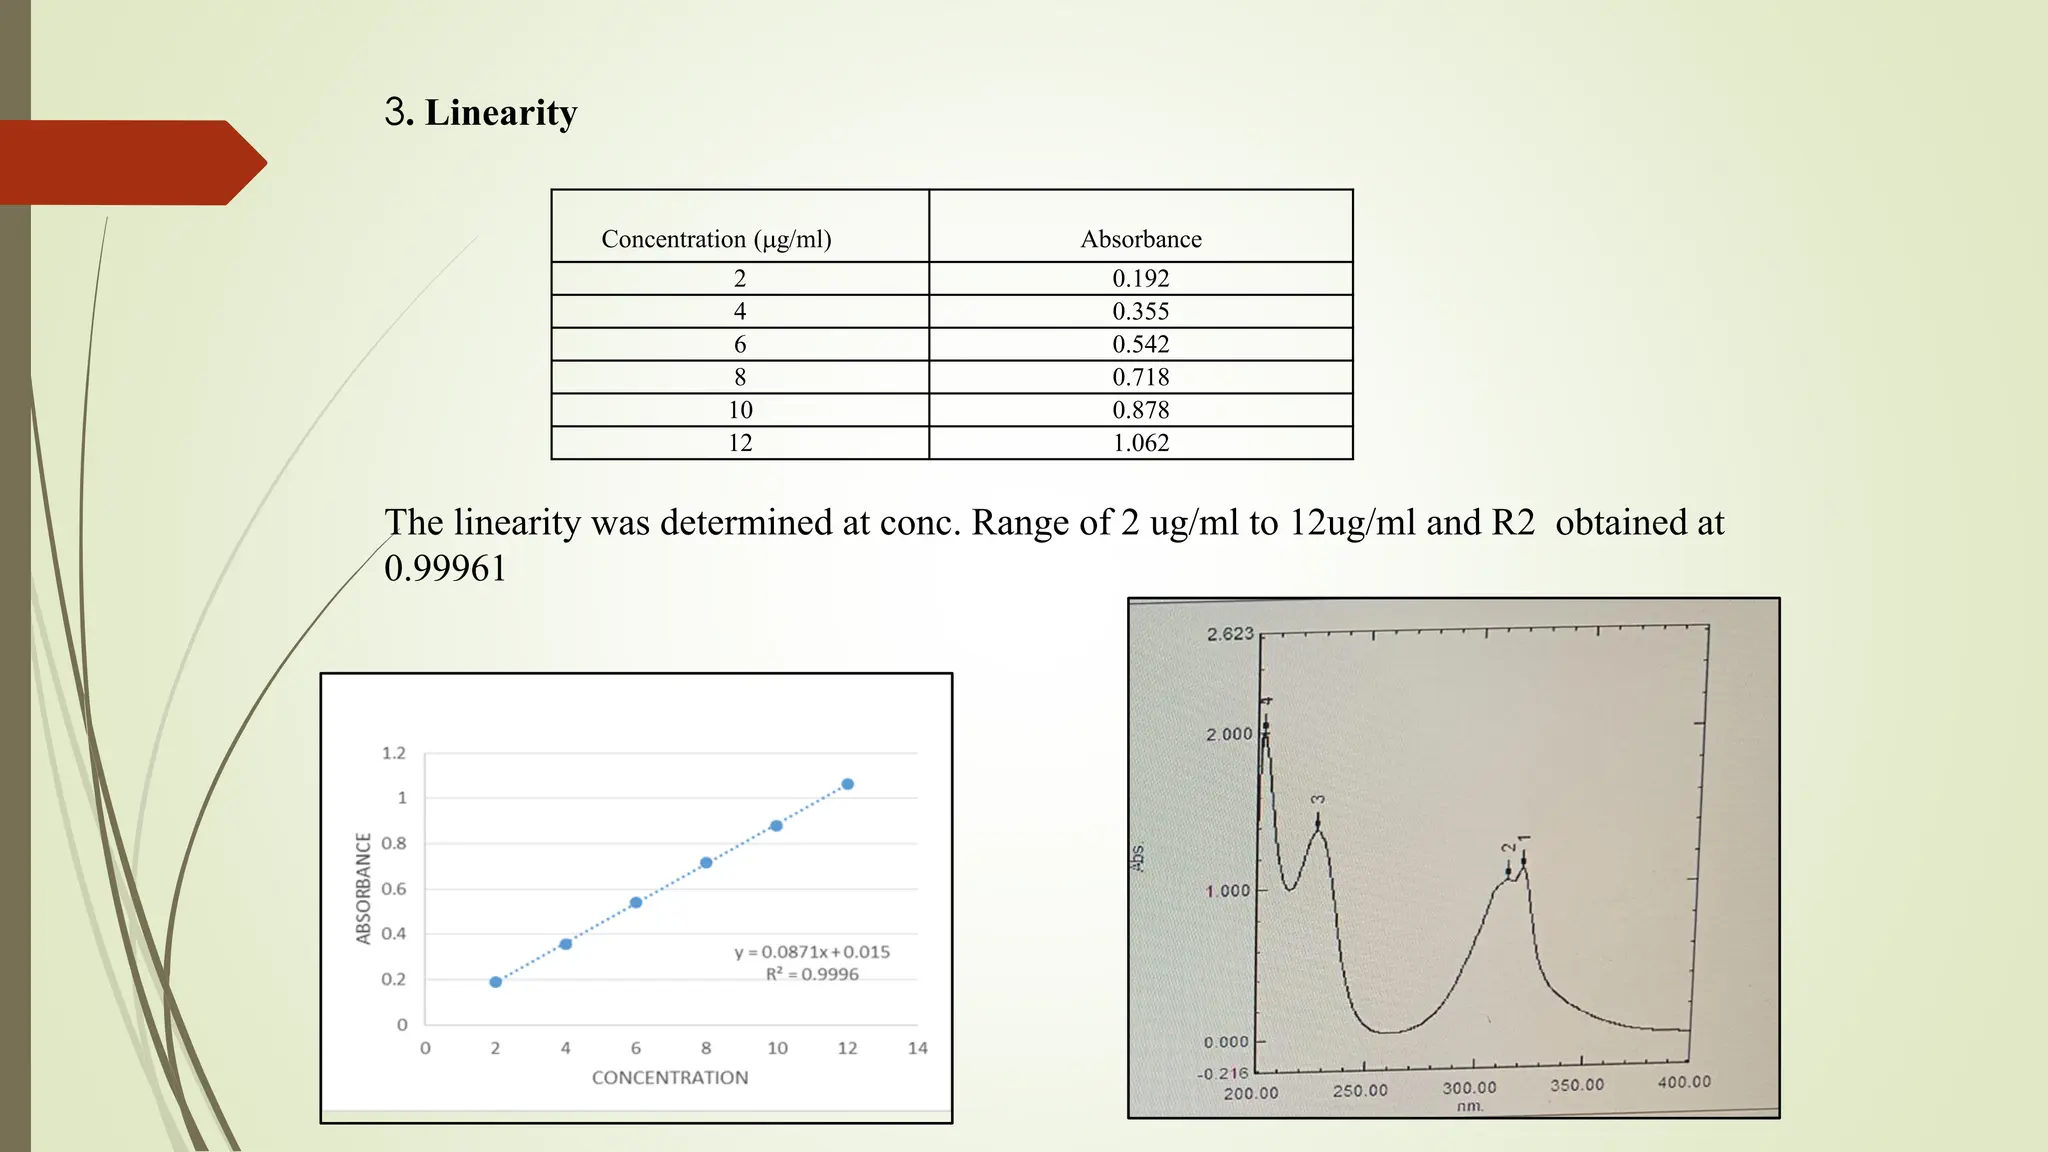
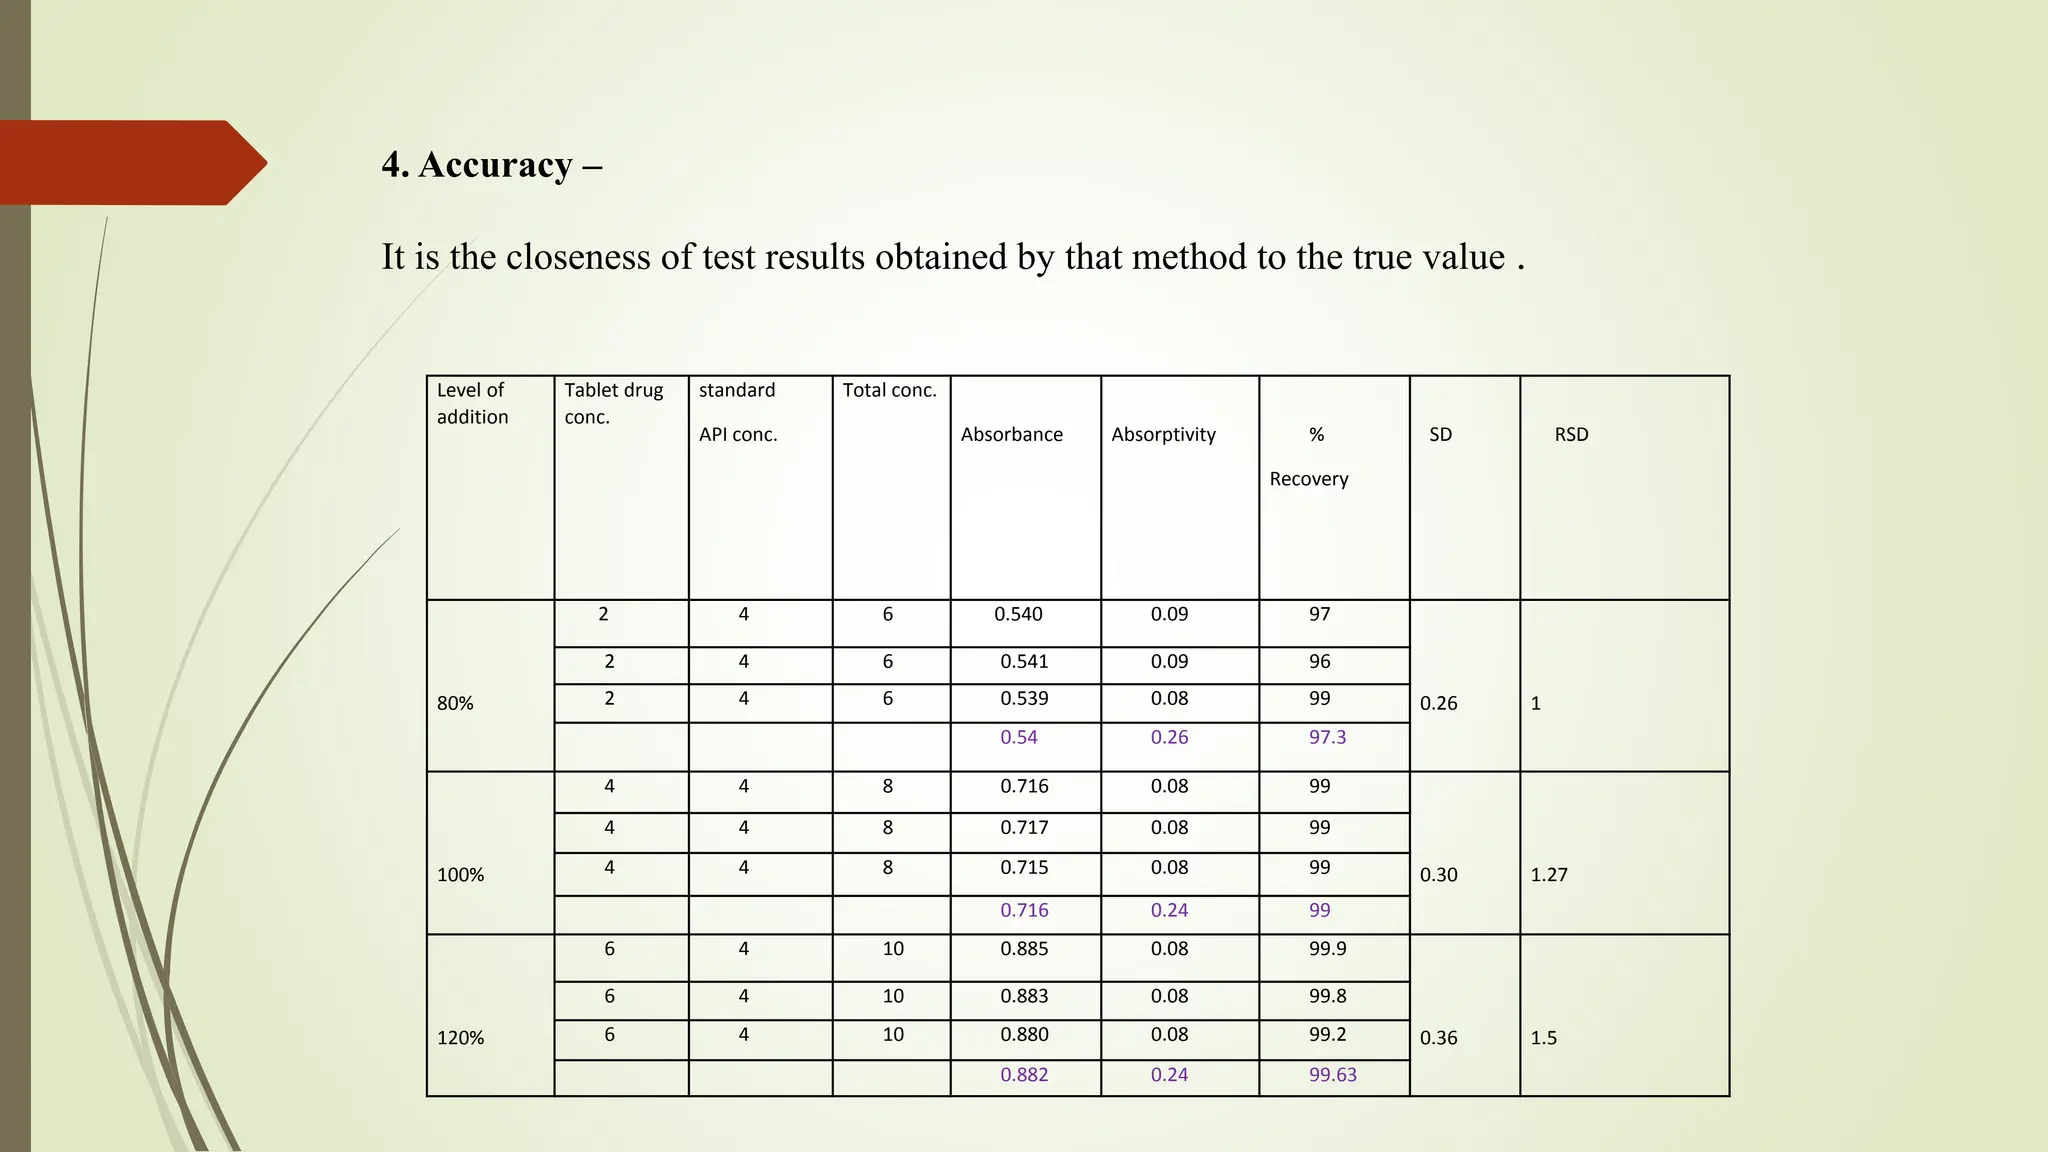
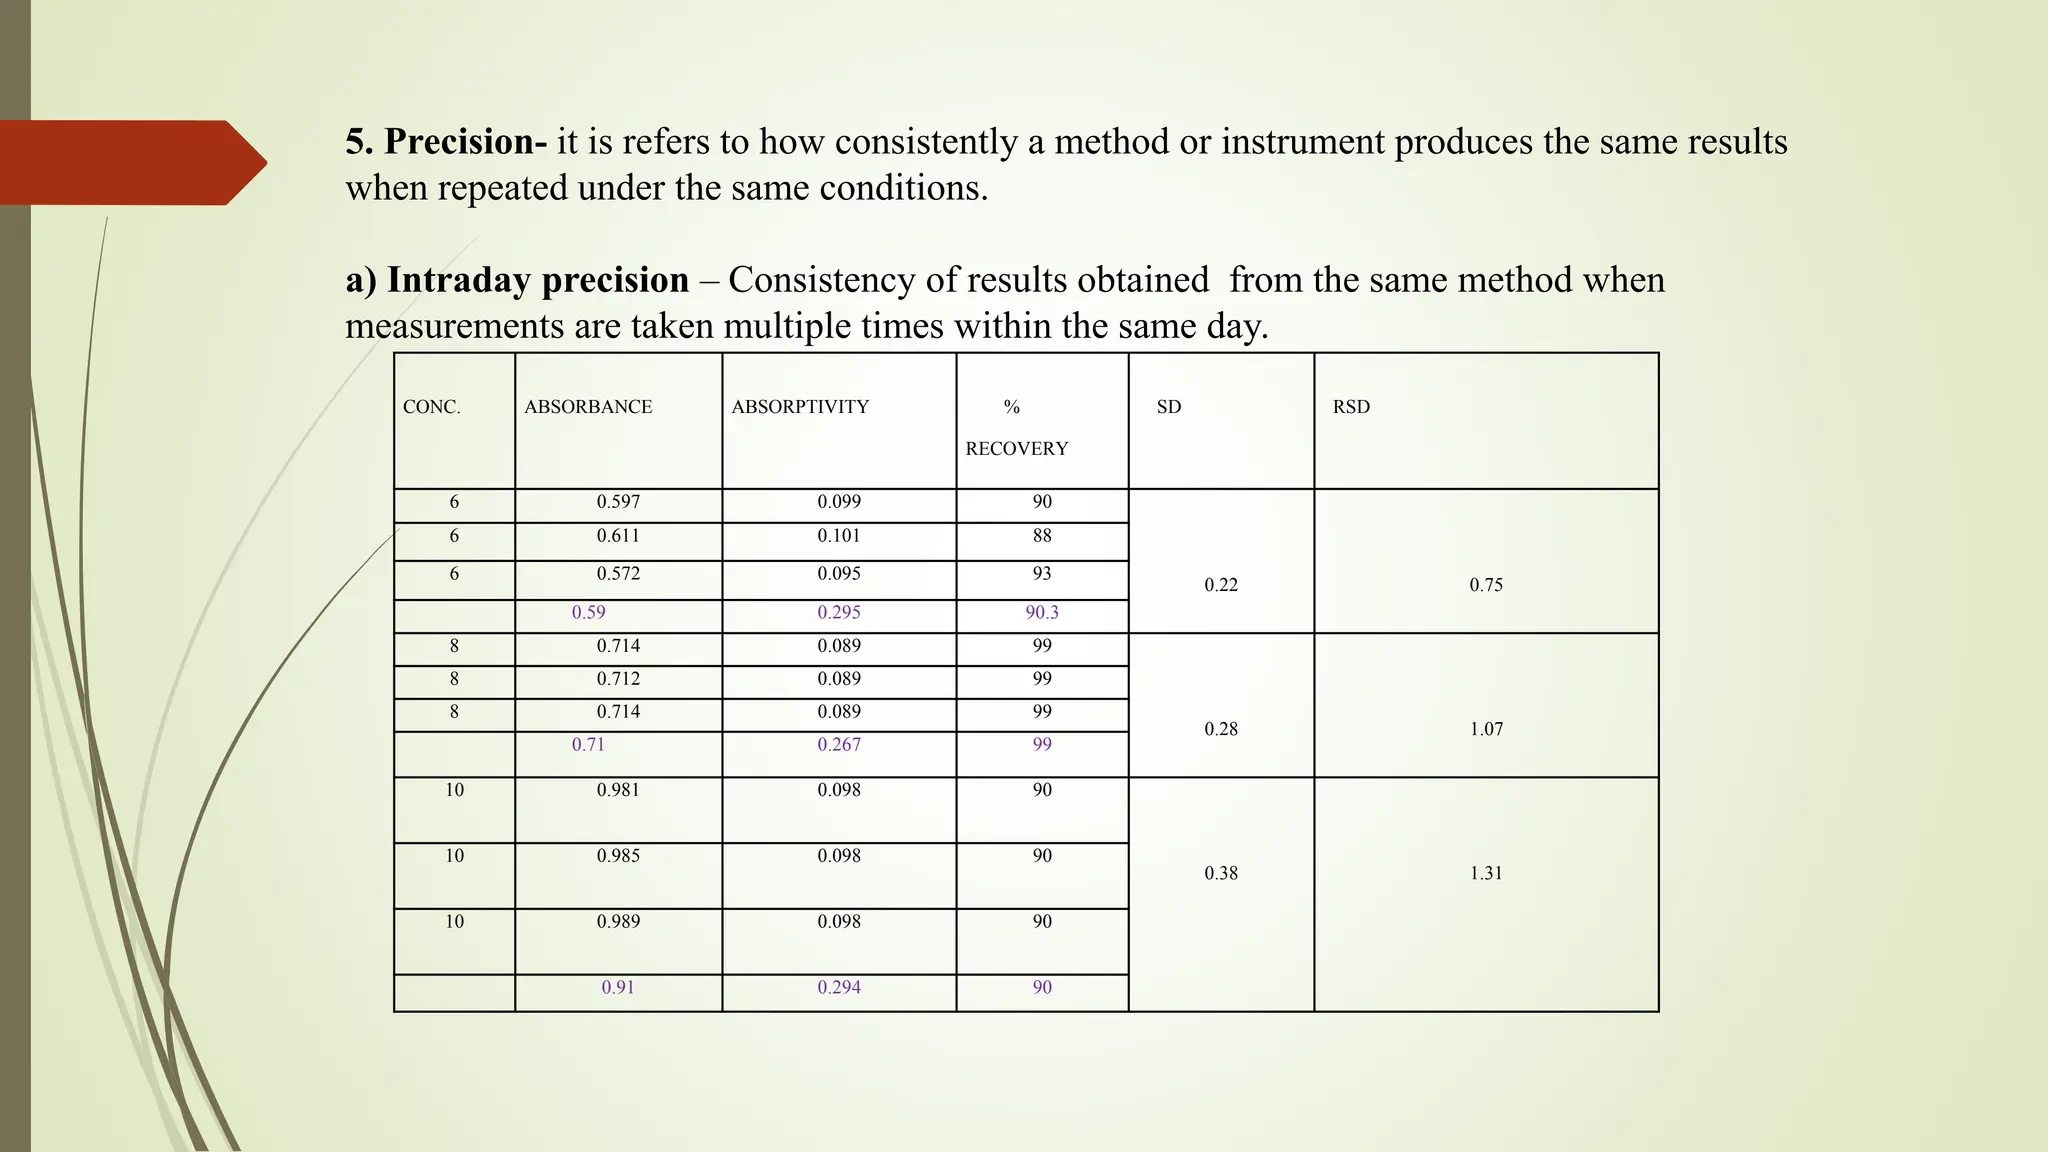
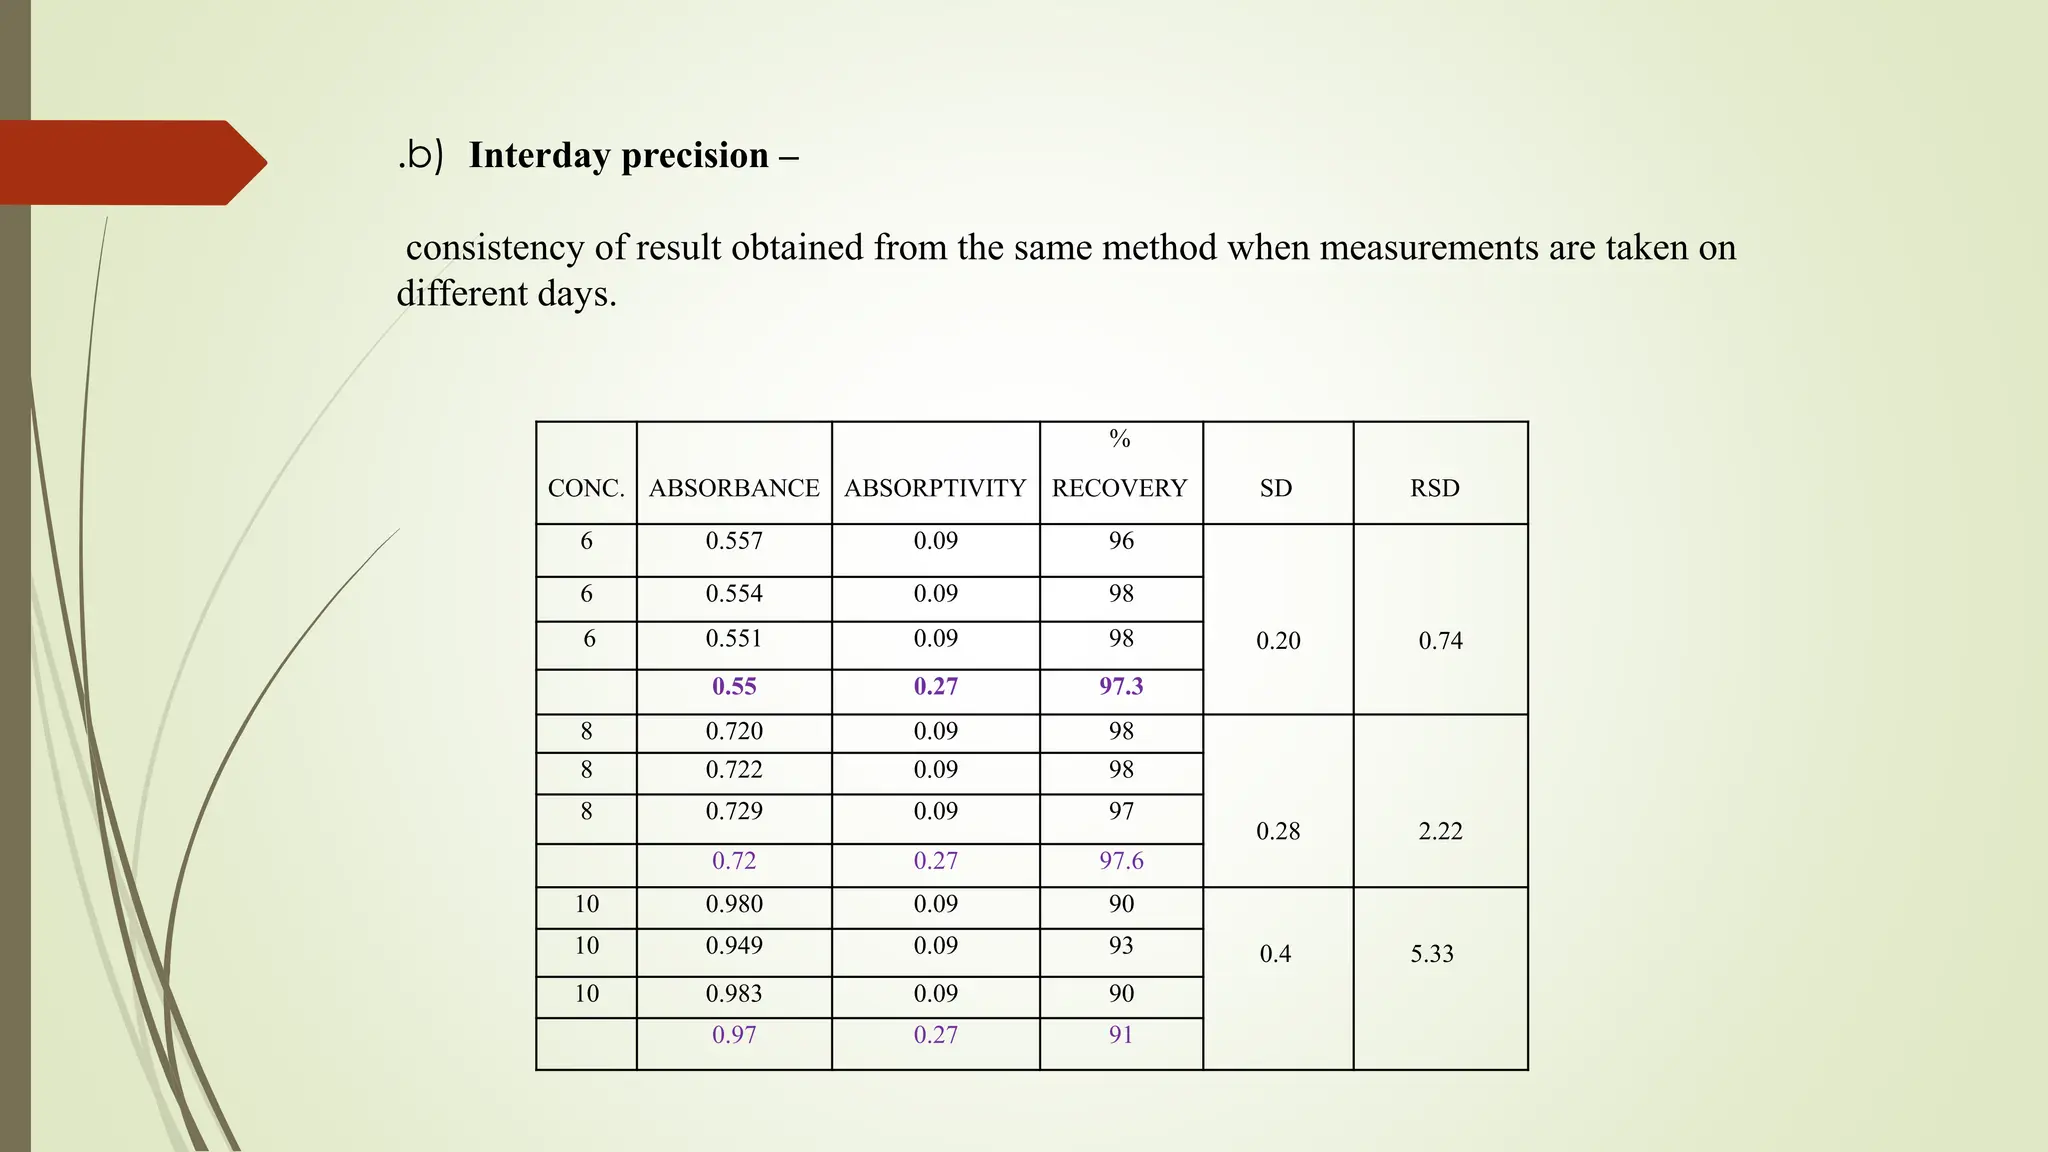
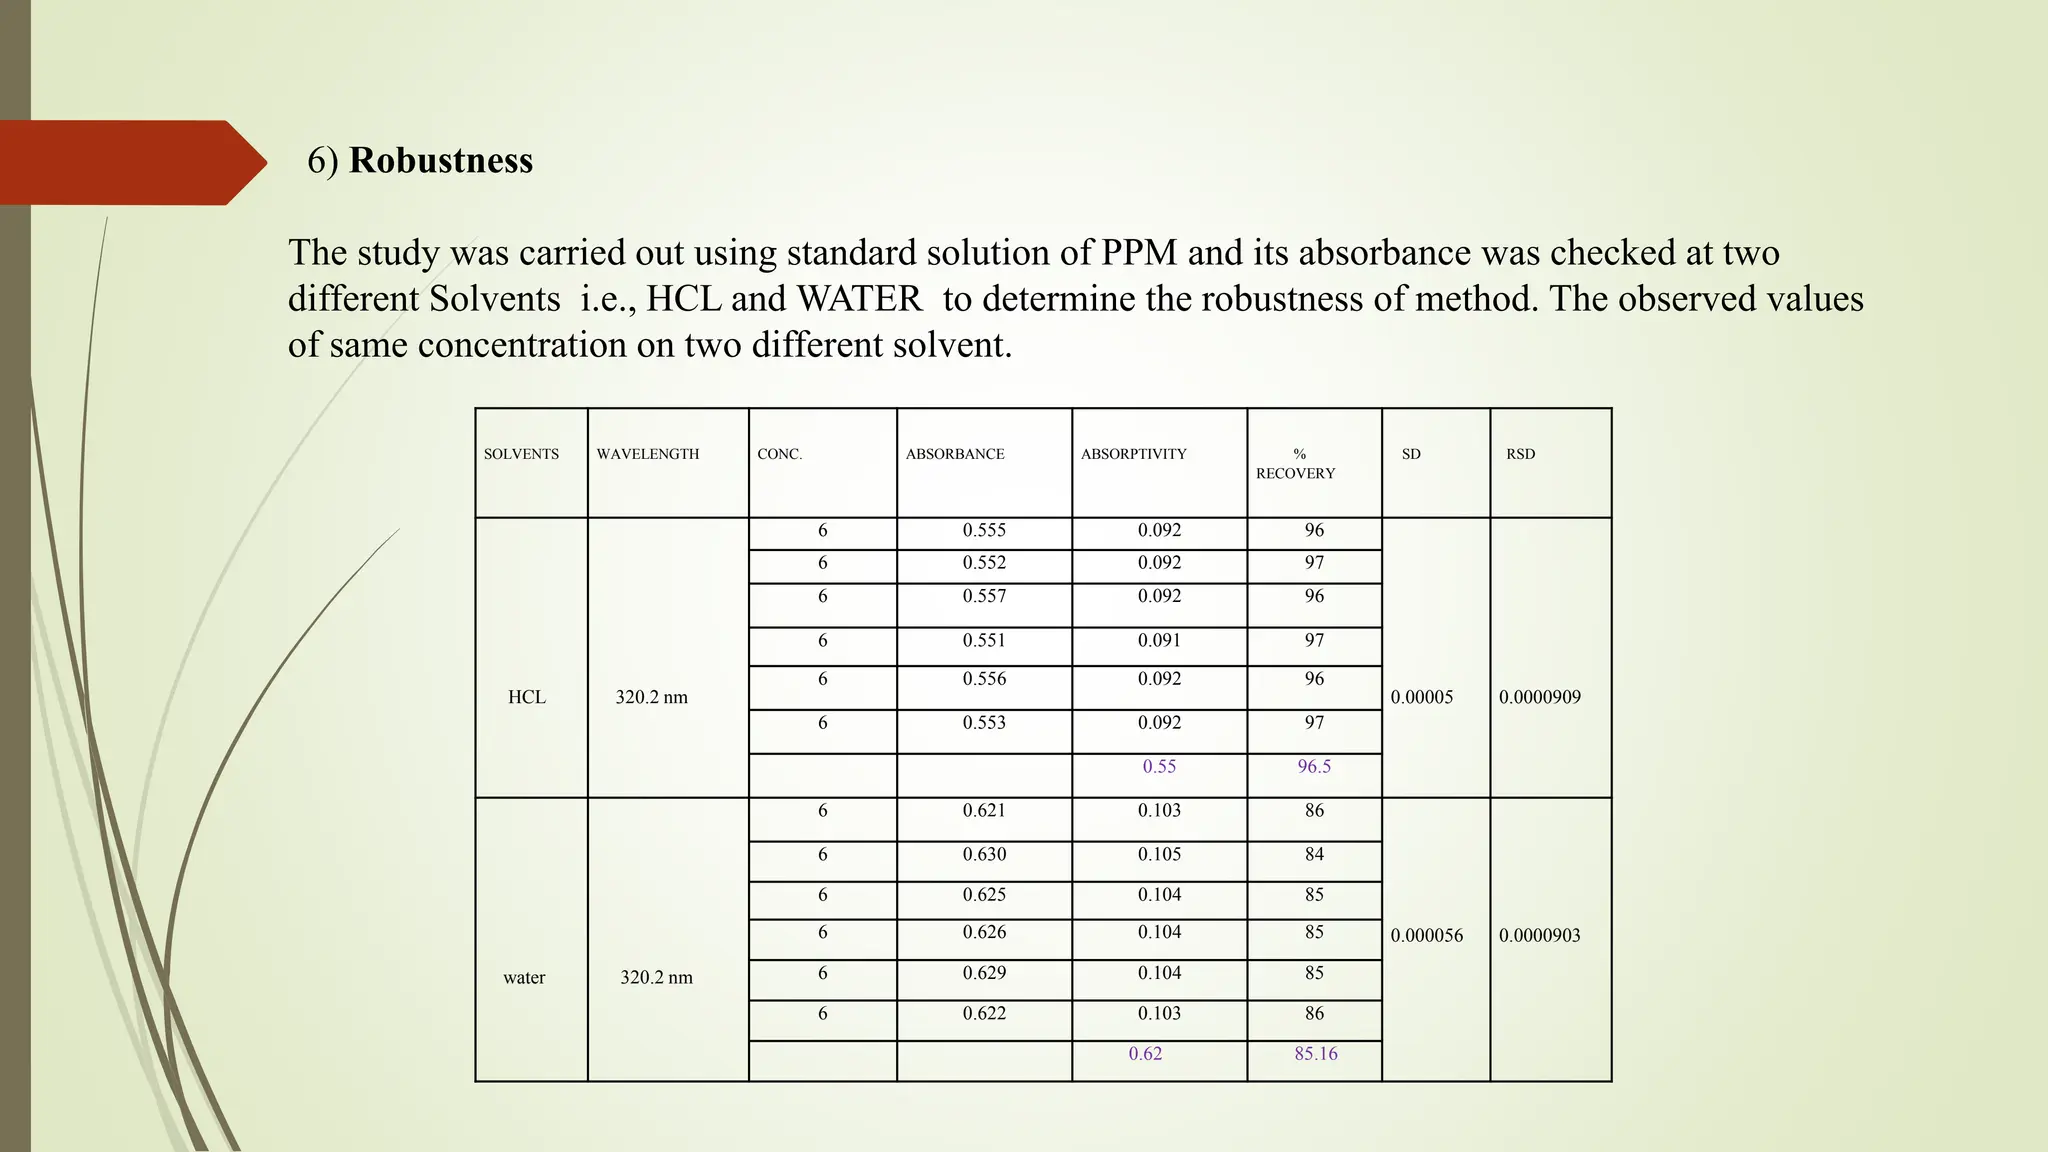
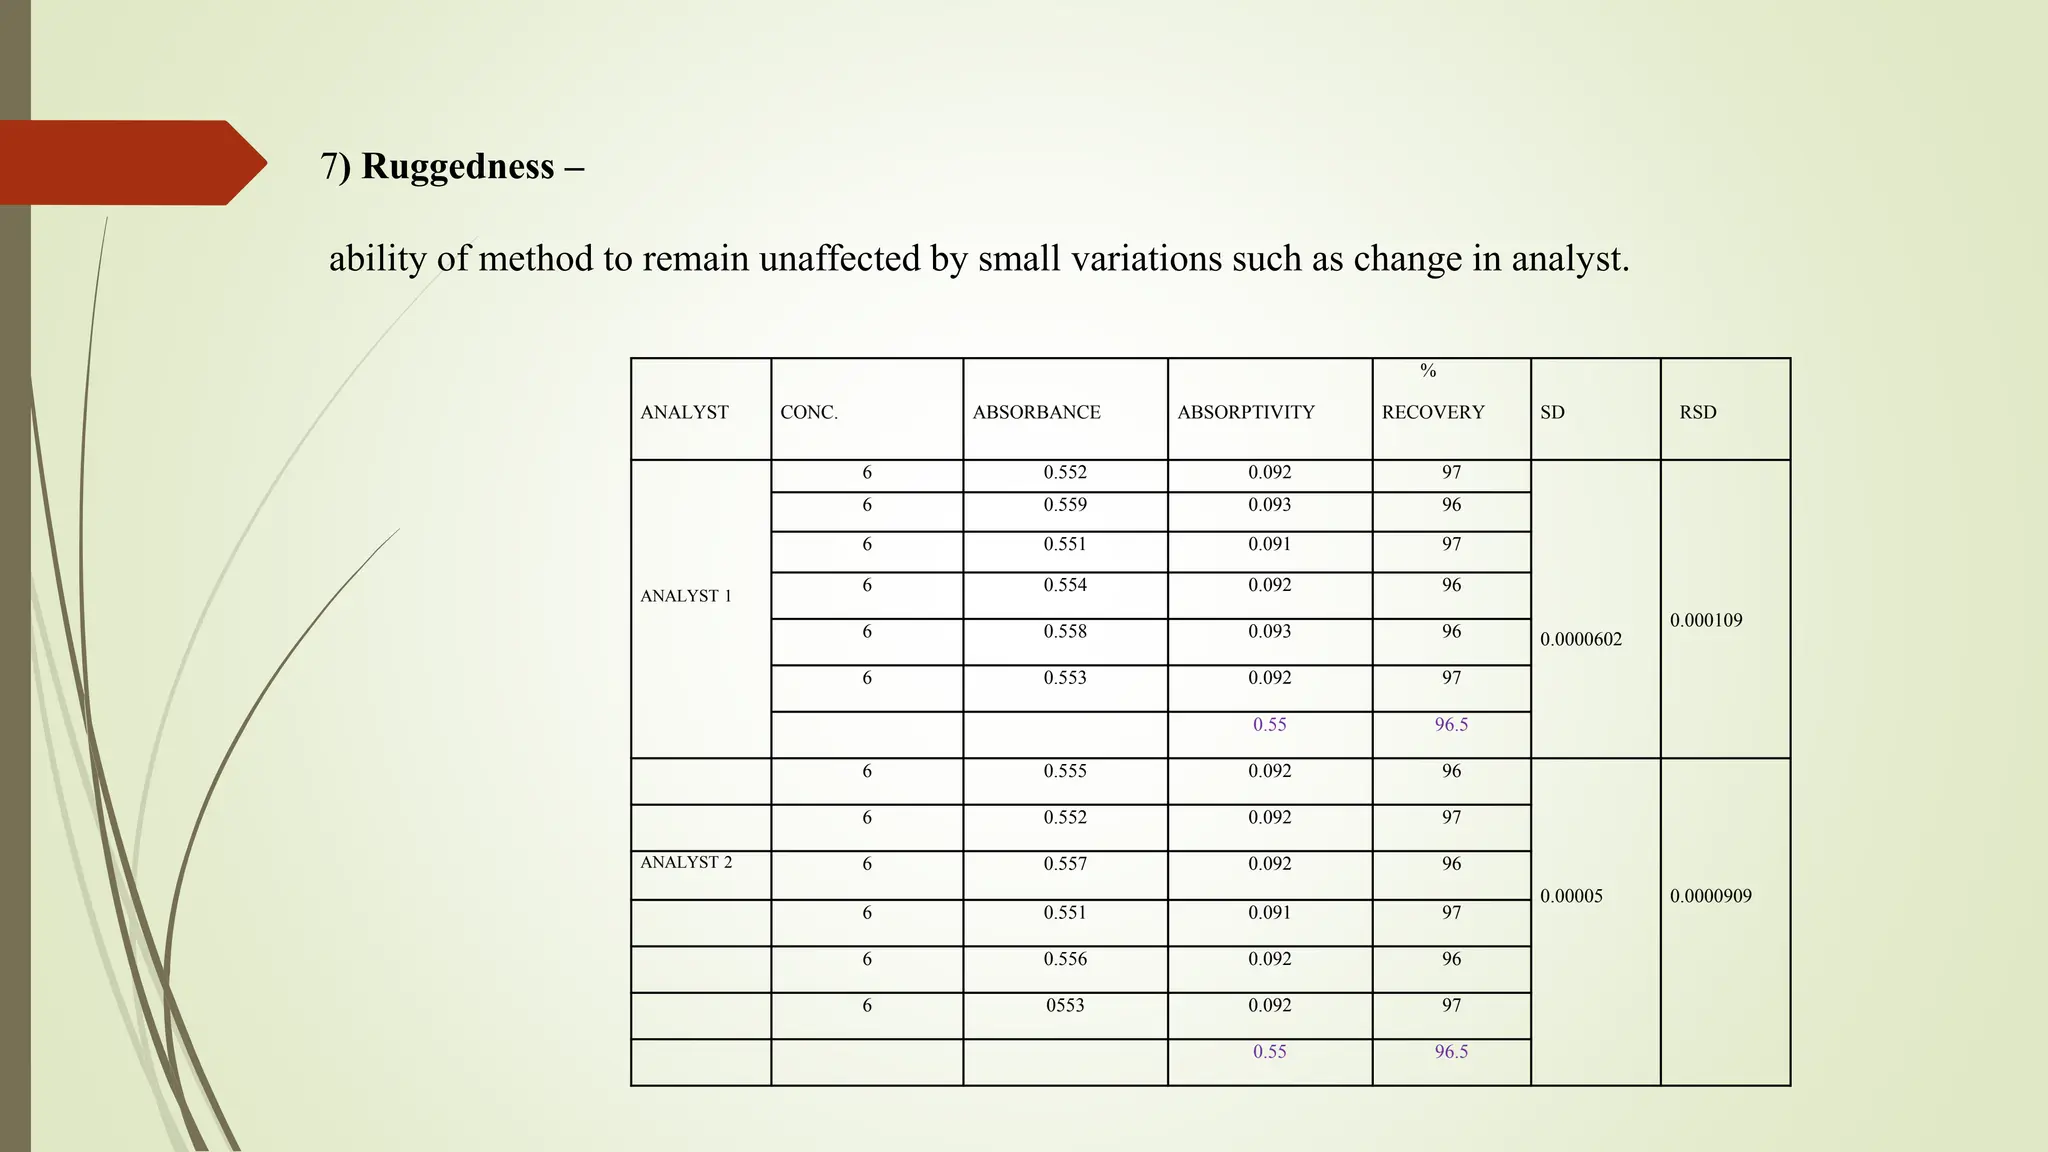
ANALYTICAL METHOD DEVELOPMENT & VALIDATION
OF TIZANIDINE HYDROCHLORIDE BY UV
SPECTROSCOPY
Name – Shruti Pandit & Vaishnavi pagar
class – final year B pharmacy (sem–VIII)
under the guidance of
Ms. PRAJAKTA THETE (M PHARMACY)
COLLEGE NAME – K C Ts R G SAPKAL COLLEGE OF PHARMACY .
CONTENTS
 AIM and objective
 Literature review
 Plan of work
 Introduction
 PRINCIPLE
 INSTRUMENTATION
 TYPES
 Conclusion
 Future scope
 Reference
AIM –
 To determine the analytical method development and validation of tizanidine
hydrochloride by uv spectroscopy.
OBJECTIVE –
 Method Development – This involves selecting appropriate analytical
techniques and parameter to detect and quantify tizanidine hydrochloride
effectively.
 Method optimization – fine tuning the choosen method to enhance its
performance characteristics, such as accuracy ad robustness.
 Validation studies – conducting through validation experiments to ensure that
the developed method meets the required criteria for precision, accuracy,
linearity, specificity, and robustness.
LITERATURE REVIEW-
a. P. Kumar Nallasivan, et. al.,(2010)
He developed two simple Spectrophotometric methods for the simultaneous
estimation method involves the measurement of absorbance at two wavelengths 264
nm (λmax of Ibuprofen) and 319 nm (λmax of Tizanidine). Absorbance correction
method in which absorbance is measured at two wavelengths 264 nm at which
Tizanidine has no absorbance and 319 nm at which both the drugs have
considerable absorbance. The methods were found linear between the range of 150-
750 g/ml for Ibuprofen and 3-15 g/ml for Tizanidine for both the methods.
b. Rekha Rani, et . al.,(2023)
The quantitative analysis of tizanidine hydrochloride in both pharmaceutical dosage
form and bulk medication has been developed and validated using an easy,
affordable, quick, and unique isocratic HPLC approach. Tizanidine hydrochloride was
separated isocratically using Waters symmetry C18 ODS as the stationary phase
(250×4.6 mm, 5μm particle size), a flow rate of 1.0 ml/min, and a UV detector to track
the eluate at 230 nm. The drug and its degradation products could be separated
using the mobile phase,
d. Shyam Dibari Sharma, et .al.,(2009)
The simple, selective, rapid and precise UV spectrophotometric method has been
developed for the simultaneous estimation of valdecoxib and tizanidine in pharmaceutical
dosage form. The proposed method is based on the Vierodt's simultaneous equations.
Tizanidine has absorption maxima at 318.1 nm and valdecoxib absorption maxima at 239.0
nm in methanol. The linearity was observed In the concentration range of l-18 J.Lg/ml for
tizanldine and valdecoxib. Both the drugs obey Beer's law. The method is validated
statistically. The recovery studies confirmed the accuracy of the proposed method.
e. Lalit Lata Jha , et .al.,(2016)
In the present work one simple and sensitive UV spectrophotometric method have been
developed for the quantitative estimation of mefenamic acid and tizanidine hydrochloride
in combination. For this dual wavelength method, 222 nm and 237 nm were selected as λ1
and λ2 for the determination of mefenamic acid and 240 nm and 272 nm were selected as
λ3 and λ4 for the determination of tizanidine hydrochloride. The method was validated with
respect to linearity, precision, accuracy, LOD and LOQ with analytical method validation
guideline.
PLAN OF WORK-
Literature review
Find the properties of the API
Determine solubility profile and select detector λ max
Select the chromatography method. ( based on solubility study)
Set the linearity for UV
Perform the calibration curve method
Perform the validation parameter ( Linearity, Specificity, Accuracy, Precision –
Interday - Intraday, Robustness, LOD, & LOQ).
ANALYTICAL METHOD DEVELOPMENT –
 Analytical method development is the process of selecting and optimizing analytical
methods for measuring a specific property of a drug substance or drug product.
 This procedure entails a systematic strategy to analyzing and selecting appropriate
methods that are sensitive, specific, and robust, as well as capable of measuring the
target property within acceptable accuracy and precision.
UV VISIBLE SPECTROSCOPY –
 This spectroscopy used for quantitative analysis of matter / samples by using UV (ultra
violet) and visible light.
 The overall range of wavelength of UV & visible is 200 – 800 nm.
INTRODUCTION -
UV VISIBLE SPECTROSCOPY
PRINCIPLE -
 The UV– visible spectroscopy’s principle depend upon the absorption of light.
 EMR light contain packets of energy (photons), the light passes through the sample the
particle of samples absorb this light.
 To determine the intensity of light then calculate the concentration of the particle.
ABSORPTION  CONCENTRATION OF
PARTICLE
 The principle also depends on the Beer-lambert law.
Beer’s lambert law -
A = £Cl
where,
£ = absorption coefficient
c = conc. Of solution
l = path length
there are two types –
1. single component analysis
a) standard absorptivity value method
b) calibration graph/curve method
c) single and double point standardization method
2 . multicomponent analysis
a) simultaneous equation method
b) absorption ratio or Q analysis method
c) area under curve method
d) derivative spectroscopy
e) Absorbance correction method
f) Different spectroscopy
g) geometric correction method
h) Orthogonal polynomial method
1. single component –
 It is a technique used to isolate and study the absorbance of specific compound in a sample.
 it helps us focus on one particular substance and measure how much light it absorbs at
specific wavelength.
a) standard absorptivity value method –
In this method the conc. Of the unknown compound can be determined by using the measured
absorbance and standard absorptivity value.
A = abc
Where,
A = absorbance of the solution
a = standard absorptivity value
b = pathlength of the sample cell
c = conc. Of the unknown to be determined
b. calibration graph/ curve method-
 In this method the absorbance of a
number of standard solutions of the
reference substance at conc. Of the
sample solutions are measured and
a calibration graph is drawn.
 The absorbance or linearity is
dependent on the assay conditions.
c. single or double point standardization method -
 The absorbance of a sample solution and a standard solution of the reference substance .
 The concentration of a substance in the sample is measured from the proportional relationship
between the absorbance and concentration.
Ctest = Atest x Cstd Where,
Astd Ctest= conc. Of test solution
Cstd = conc. Of standard solution
Atest= absorbance of test solution
Astd = absorbance of standard solution
DRUG PROFILE –
Name of drug : Tizanidine Hydrochloride
Brand name : Zanaflex
Chemical Formula : C9H8CIN5S, HCL
Category : α-adrenergic agonist
Appearance ; White to yellowish white crystalline powder
Mechanism of action : Tizanidine reduces spasticity by causing presynaptic ihibition of motor
neurons via agonist actions at alpha-2 adrenergic receptor sites.This drug is centrally acting and leads
to a reductionin the release of excitatory amino acids like glutamate and aspartate, which cause
neuronal firing that leads to muscle spasm.
Uses : muscle relaxant . it relieves spasms, cramping, and tightness of the muscles caused by medical
problems, such as multiple sclerosis or certain injuries to the spine. Tizanidine does not cure these
problems, but it may allow other treatment, such as physical therapy, to be more helpful in improving
your condition.
Result –
1. Solubility
Sr
No solvents solubility
1 water Slightly soluble
2 HCL Soluble
3 acetonitrile Soluble
4 ethaol Soluble
5 methanol Slightly soluble
6 Naoh Insoluble
2. ASSAY
CONC ABSORBANCE ABSORPTIVITY
%
RECOVERY SD RSD
6 0.549 0.0915 97
0.110 0.199
6 0553 0.0921 97
6 0.548 0.0913 98
6 0.551 0.0918 97
6 0.557 0.0928 98
6 0.550 0.0916 97
0.551 97.3
Concentration (g/ml) Absorbance
2 0.192
4 0.355
6 0.542
8 0.718
10 0.878
12 1.062
The linearity was determined at conc. Range of 2 ug/ml to 12ug/ml and R2 obtained at
0.99961
3. Linearity
Level of
addition
Tablet drug
conc.
standard
API conc.
Total conc.
Absorbance Absorptivity %
Recovery
SD RSD
80%
2 4 6 0.540 0.09 97
0.26 1
2 4 6 0.541 0.09 96
2 4 6 0.539 0.08 99
0.54 0.26 97.3
100%
4 4 8 0.716 0.08 99
0.30 1.27
4 4 8 0.717 0.08 99
4 4 8 0.715 0.08 99
0.716 0.24 99
120%
6 4 10 0.885 0.08 99.9
0.36 1.5
6 4 10 0.883 0.08 99.8
6 4 10 0.880 0.08 99.2
0.882 0.24 99.63
4. Accuracy –
It is the closeness of test results obtained by that method to the true value .
CONC. ABSORBANCE ABSORPTIVITY %
RECOVERY
SD RSD
6 0.597 0.099 90
0.22 0.75
6 0.611 0.101 88
6 0.572 0.095 93
0.59 0.295 90.3
8 0.714 0.089 99
0.28 1.07
8 0.712 0.089 99
8 0.714 0.089 99
0.71 0.267 99
10 0.981 0.098 90
0.38 1.31
10 0.985 0.098 90
10 0.989 0.098 90
0.91 0.294 90
5. Precision- it is refers to how consistently a method or instrument produces the same results
when repeated under the same conditions.
a) Intraday precision – Consistency of results obtained from the same method when
measurements are taken multiple times within the same day.
CONC. ABSORBANCE ABSORPTIVITY
%
RECOVERY SD RSD
6 0.557 0.09 96
0.20 0.74
6 0.554 0.09 98
6 0.551 0.09 98
0.55 0.27 97.3
8 0.720 0.09 98
0.28 2.22
8 0.722 0.09 98
8 0.729 0.09 97
0.72 0.27 97.6
10 0.980 0.09 90
0.4 5.33
10 0.949 0.09 93
10 0.983 0.09 90
0.97 0.27 91
.b) Interday precision –
consistency of result obtained from the same method when measurements are taken on
different days.
SOLVENTS WAVELENGTH CONC. ABSORBANCE ABSORPTIVITY %
RECOVERY
SD RSD
HCL 320.2 nm
6 0.555 0.092 96
0.00005 0.0000909
6 0.552 0.092 97
6 0.557 0.092 96
6 0.551 0.091 97
6 0.556 0.092 96
6 0.553 0.092 97
0.55 96.5
water 320.2 nm
6 0.621 0.103 86
0.000056 0.0000903
6 0.630 0.105 84
6 0.625 0.104 85
6 0.626 0.104 85
6 0.629 0.104 85
6 0.622 0.103 86
0.62 85.16
6) Robustness
The study was carried out using standard solution of PPM and its absorbance was checked at two
different Solvents i.e., HCL and WATER to determine the robustness of method. The observed values
of same concentration on two different solvent.
ANALYST CONC. ABSORBANCE ABSORPTIVITY
%
RECOVERY SD RSD
ANALYST 1
6 0.552 0.092 97
0.0000602
0.000109
6 0.559 0.093 96
6 0.551 0.091 97
6 0.554 0.092 96
6 0.558 0.093 96
6 0.553 0.092 97
0.55 96.5
6 0.555 0.092 96
0.00005 0.0000909
6 0.552 0.092 97
ANALYST 2 6 0.557 0.092 96
6 0.551 0.091 97
6 0.556 0.092 96
6 0553 0.092 97
0.55 96.5
7) Ruggedness –
ability of method to remain unaffected by small variations such as change in analyst.
CONCLUSION.
 The tizanidine hcl has absorption maxima ( wavelength ) at 320.2nm in HCL.
 In the development of analytical method of tizanidine hydrochloride the linearity was found
to be 2 – 12ug/ml . & the correlation coefficient was found to be 0.99961.
 The method was validated by such parameter like accuracy, precision, robustness, assay ,
ruggedness, linearity.
FUTURE SCOPE
1. Optimization of Method Parameters*: Investigate and optimize various
parameters such as wavelength selection, solvent system, and pH conditions
to enhance the sensitivity, selectivity, and robustness of the UV spectroscopic
method
.2. *Application to Complex Matrices*: Extend the validation study to include analysis
of tizanidine hydrochloride in complex matrices such as pharmaceutical
formulations or biological samples. This would involve developing sample
preparation techniques to ensure accurate quantification in the presence of
interfering substances.
3. *Comparative Studies*: Conduct comparative studies with other analytical
techniques (e.g., HPLC, LC-MS) to evaluate the accuracy, precision, and
reliability of UV spectroscopy for the analysis of tizanidine hydrochloride. This
could help establish the method's suitability for routine quality control or
pharmacokinetic studies.
4. *Stability Indicating Method*: Validate the developed UV spectroscopic method
as a stability-indicating assay to assess the degradation products and stability of
tizanidine hydrochloride under various stress conditions (e.g., temperature, light,
pH)
5. *Method Transfer and Collaborative Studies*: Collaborate with other research
groups or pharmaceutical companies to transfer the validated method to
different laboratory settings or to conduct multi-center validation studies, thereby
enhancing the method's applicability and credibility.
REFERENCES-
1. Kenkel J. Analytical Chemistry For Technicians, Third Edition. CRC Publication; 2009. p. 2-4.
2. Kasture AV, Mahadik KR, Wadodkar SG, More HN. Pharmaceutical Analysis, Vol.II, Seventh Edition.
Nirali Publication; 2007. p. 28-30.
3. Jeffery GH, Bassett J, Mendham J, Denny RC. Vogel’s Textbook of Quantitative Chemical Analysis,
Fifth Edition. Longman Scientific and Technical Publishers; 1991. p. 3-13.
4. Chatwal GR, Anand SK. Instrumental Methods of Chemical Analysis, Fifth Edition. Himalaya
Publishing House; 2008. p. 2.108-2.124
5. Vermeij TAC, Edelbroek PM. High Performance Liquid Chromatographic and megabore Gas-Liquid
Chromatographic determination of Levetiracetam in human serum after solid-phase extraction. J
Chromatogr B. 1994;375:134-139.
6. Contin M, Mohamed S, Albani F, Riva R, Baruzzi A. Simple and validated HPLCUV analysis of
Levetiracetam in deproteinized plasma of patients with epilepsy. J Chromatogr B. 2008;873:129-132
7. Ravisankar P, Naga Navya C, Pravallika D, Navya Sri D. A Review on Step-by-Step Analytical Method
Validation. 2015;5(10):07-19.
8. ICH Q2 (R1), Validation of Analytical Procedures: Text and Methodology. International Conference on
Harmonization. Geneva: IFPMA; 2005.
9. Pavia DL, Lampman GM, Kriz GS. Introduction to Spectroscopy, Third Edition. Thomson Learning
publication; 2007. p. 356, 797-817.
10. Beckett AH, Stenlake JB. Practical Pharmaceutical Chemistry, Fourth Edition Part II. CBS Publishers
and Distributors; 2004. p. 284-300, 162-163
11. WWW.WIKIPEDIA.ECYCLOPEDIA
12. https://www.slideshare.net .
13. www.ezyaccess.in.
14. http://www.delnet.in.
15. https://www.sciencedirect.com
16. https://www.chromatographytoday.com

Analytical method development and validation of Tizanidine hydrochloride by uv spectroscopy

  • 1.
    ANALYTICAL METHOD DEVELOPMENT& VALIDATION OF TIZANIDINE HYDROCHLORIDE BY UV SPECTROSCOPY Name – Shruti Pandit & Vaishnavi pagar class – final year B pharmacy (sem–VIII) under the guidance of Ms. PRAJAKTA THETE (M PHARMACY) COLLEGE NAME – K C Ts R G SAPKAL COLLEGE OF PHARMACY .
  • 2.
    CONTENTS  AIM andobjective  Literature review  Plan of work  Introduction  PRINCIPLE  INSTRUMENTATION  TYPES  Conclusion  Future scope  Reference
  • 3.
    AIM –  Todetermine the analytical method development and validation of tizanidine hydrochloride by uv spectroscopy. OBJECTIVE –  Method Development – This involves selecting appropriate analytical techniques and parameter to detect and quantify tizanidine hydrochloride effectively.  Method optimization – fine tuning the choosen method to enhance its performance characteristics, such as accuracy ad robustness.  Validation studies – conducting through validation experiments to ensure that the developed method meets the required criteria for precision, accuracy, linearity, specificity, and robustness.
  • 4.
    LITERATURE REVIEW- a. P.Kumar Nallasivan, et. al.,(2010) He developed two simple Spectrophotometric methods for the simultaneous estimation method involves the measurement of absorbance at two wavelengths 264 nm (λmax of Ibuprofen) and 319 nm (λmax of Tizanidine). Absorbance correction method in which absorbance is measured at two wavelengths 264 nm at which Tizanidine has no absorbance and 319 nm at which both the drugs have considerable absorbance. The methods were found linear between the range of 150- 750 g/ml for Ibuprofen and 3-15 g/ml for Tizanidine for both the methods. b. Rekha Rani, et . al.,(2023) The quantitative analysis of tizanidine hydrochloride in both pharmaceutical dosage form and bulk medication has been developed and validated using an easy, affordable, quick, and unique isocratic HPLC approach. Tizanidine hydrochloride was separated isocratically using Waters symmetry C18 ODS as the stationary phase (250×4.6 mm, 5μm particle size), a flow rate of 1.0 ml/min, and a UV detector to track the eluate at 230 nm. The drug and its degradation products could be separated using the mobile phase,
  • 5.
    d. Shyam DibariSharma, et .al.,(2009) The simple, selective, rapid and precise UV spectrophotometric method has been developed for the simultaneous estimation of valdecoxib and tizanidine in pharmaceutical dosage form. The proposed method is based on the Vierodt's simultaneous equations. Tizanidine has absorption maxima at 318.1 nm and valdecoxib absorption maxima at 239.0 nm in methanol. The linearity was observed In the concentration range of l-18 J.Lg/ml for tizanldine and valdecoxib. Both the drugs obey Beer's law. The method is validated statistically. The recovery studies confirmed the accuracy of the proposed method. e. Lalit Lata Jha , et .al.,(2016) In the present work one simple and sensitive UV spectrophotometric method have been developed for the quantitative estimation of mefenamic acid and tizanidine hydrochloride in combination. For this dual wavelength method, 222 nm and 237 nm were selected as λ1 and λ2 for the determination of mefenamic acid and 240 nm and 272 nm were selected as λ3 and λ4 for the determination of tizanidine hydrochloride. The method was validated with respect to linearity, precision, accuracy, LOD and LOQ with analytical method validation guideline.
  • 6.
    PLAN OF WORK- Literaturereview Find the properties of the API Determine solubility profile and select detector λ max Select the chromatography method. ( based on solubility study) Set the linearity for UV Perform the calibration curve method Perform the validation parameter ( Linearity, Specificity, Accuracy, Precision – Interday - Intraday, Robustness, LOD, & LOQ).
  • 7.
    ANALYTICAL METHOD DEVELOPMENT–  Analytical method development is the process of selecting and optimizing analytical methods for measuring a specific property of a drug substance or drug product.  This procedure entails a systematic strategy to analyzing and selecting appropriate methods that are sensitive, specific, and robust, as well as capable of measuring the target property within acceptable accuracy and precision. UV VISIBLE SPECTROSCOPY –  This spectroscopy used for quantitative analysis of matter / samples by using UV (ultra violet) and visible light.  The overall range of wavelength of UV & visible is 200 – 800 nm. INTRODUCTION - UV VISIBLE SPECTROSCOPY
  • 8.
    PRINCIPLE -  TheUV– visible spectroscopy’s principle depend upon the absorption of light.  EMR light contain packets of energy (photons), the light passes through the sample the particle of samples absorb this light.  To determine the intensity of light then calculate the concentration of the particle. ABSORPTION  CONCENTRATION OF PARTICLE  The principle also depends on the Beer-lambert law. Beer’s lambert law - A = £Cl where, £ = absorption coefficient c = conc. Of solution l = path length
  • 9.
    there are twotypes – 1. single component analysis a) standard absorptivity value method b) calibration graph/curve method c) single and double point standardization method 2 . multicomponent analysis a) simultaneous equation method b) absorption ratio or Q analysis method c) area under curve method d) derivative spectroscopy e) Absorbance correction method f) Different spectroscopy g) geometric correction method h) Orthogonal polynomial method
  • 10.
    1. single component–  It is a technique used to isolate and study the absorbance of specific compound in a sample.  it helps us focus on one particular substance and measure how much light it absorbs at specific wavelength. a) standard absorptivity value method – In this method the conc. Of the unknown compound can be determined by using the measured absorbance and standard absorptivity value. A = abc Where, A = absorbance of the solution a = standard absorptivity value b = pathlength of the sample cell c = conc. Of the unknown to be determined
  • 11.
    b. calibration graph/curve method-  In this method the absorbance of a number of standard solutions of the reference substance at conc. Of the sample solutions are measured and a calibration graph is drawn.  The absorbance or linearity is dependent on the assay conditions. c. single or double point standardization method -  The absorbance of a sample solution and a standard solution of the reference substance .  The concentration of a substance in the sample is measured from the proportional relationship between the absorbance and concentration. Ctest = Atest x Cstd Where, Astd Ctest= conc. Of test solution Cstd = conc. Of standard solution Atest= absorbance of test solution Astd = absorbance of standard solution
  • 12.
    DRUG PROFILE – Nameof drug : Tizanidine Hydrochloride Brand name : Zanaflex Chemical Formula : C9H8CIN5S, HCL Category : α-adrenergic agonist Appearance ; White to yellowish white crystalline powder Mechanism of action : Tizanidine reduces spasticity by causing presynaptic ihibition of motor neurons via agonist actions at alpha-2 adrenergic receptor sites.This drug is centrally acting and leads to a reductionin the release of excitatory amino acids like glutamate and aspartate, which cause neuronal firing that leads to muscle spasm. Uses : muscle relaxant . it relieves spasms, cramping, and tightness of the muscles caused by medical problems, such as multiple sclerosis or certain injuries to the spine. Tizanidine does not cure these problems, but it may allow other treatment, such as physical therapy, to be more helpful in improving your condition.
  • 13.
    Result – 1. Solubility Sr Nosolvents solubility 1 water Slightly soluble 2 HCL Soluble 3 acetonitrile Soluble 4 ethaol Soluble 5 methanol Slightly soluble 6 Naoh Insoluble 2. ASSAY CONC ABSORBANCE ABSORPTIVITY % RECOVERY SD RSD 6 0.549 0.0915 97 0.110 0.199 6 0553 0.0921 97 6 0.548 0.0913 98 6 0.551 0.0918 97 6 0.557 0.0928 98 6 0.550 0.0916 97 0.551 97.3
  • 14.
    Concentration (g/ml) Absorbance 20.192 4 0.355 6 0.542 8 0.718 10 0.878 12 1.062 The linearity was determined at conc. Range of 2 ug/ml to 12ug/ml and R2 obtained at 0.99961 3. Linearity
  • 15.
    Level of addition Tablet drug conc. standard APIconc. Total conc. Absorbance Absorptivity % Recovery SD RSD 80% 2 4 6 0.540 0.09 97 0.26 1 2 4 6 0.541 0.09 96 2 4 6 0.539 0.08 99 0.54 0.26 97.3 100% 4 4 8 0.716 0.08 99 0.30 1.27 4 4 8 0.717 0.08 99 4 4 8 0.715 0.08 99 0.716 0.24 99 120% 6 4 10 0.885 0.08 99.9 0.36 1.5 6 4 10 0.883 0.08 99.8 6 4 10 0.880 0.08 99.2 0.882 0.24 99.63 4. Accuracy – It is the closeness of test results obtained by that method to the true value .
  • 16.
    CONC. ABSORBANCE ABSORPTIVITY% RECOVERY SD RSD 6 0.597 0.099 90 0.22 0.75 6 0.611 0.101 88 6 0.572 0.095 93 0.59 0.295 90.3 8 0.714 0.089 99 0.28 1.07 8 0.712 0.089 99 8 0.714 0.089 99 0.71 0.267 99 10 0.981 0.098 90 0.38 1.31 10 0.985 0.098 90 10 0.989 0.098 90 0.91 0.294 90 5. Precision- it is refers to how consistently a method or instrument produces the same results when repeated under the same conditions. a) Intraday precision – Consistency of results obtained from the same method when measurements are taken multiple times within the same day.
  • 17.
    CONC. ABSORBANCE ABSORPTIVITY % RECOVERYSD RSD 6 0.557 0.09 96 0.20 0.74 6 0.554 0.09 98 6 0.551 0.09 98 0.55 0.27 97.3 8 0.720 0.09 98 0.28 2.22 8 0.722 0.09 98 8 0.729 0.09 97 0.72 0.27 97.6 10 0.980 0.09 90 0.4 5.33 10 0.949 0.09 93 10 0.983 0.09 90 0.97 0.27 91 .b) Interday precision – consistency of result obtained from the same method when measurements are taken on different days.
  • 18.
    SOLVENTS WAVELENGTH CONC.ABSORBANCE ABSORPTIVITY % RECOVERY SD RSD HCL 320.2 nm 6 0.555 0.092 96 0.00005 0.0000909 6 0.552 0.092 97 6 0.557 0.092 96 6 0.551 0.091 97 6 0.556 0.092 96 6 0.553 0.092 97 0.55 96.5 water 320.2 nm 6 0.621 0.103 86 0.000056 0.0000903 6 0.630 0.105 84 6 0.625 0.104 85 6 0.626 0.104 85 6 0.629 0.104 85 6 0.622 0.103 86 0.62 85.16 6) Robustness The study was carried out using standard solution of PPM and its absorbance was checked at two different Solvents i.e., HCL and WATER to determine the robustness of method. The observed values of same concentration on two different solvent.
  • 19.
    ANALYST CONC. ABSORBANCEABSORPTIVITY % RECOVERY SD RSD ANALYST 1 6 0.552 0.092 97 0.0000602 0.000109 6 0.559 0.093 96 6 0.551 0.091 97 6 0.554 0.092 96 6 0.558 0.093 96 6 0.553 0.092 97 0.55 96.5 6 0.555 0.092 96 0.00005 0.0000909 6 0.552 0.092 97 ANALYST 2 6 0.557 0.092 96 6 0.551 0.091 97 6 0.556 0.092 96 6 0553 0.092 97 0.55 96.5 7) Ruggedness – ability of method to remain unaffected by small variations such as change in analyst.
  • 20.
    CONCLUSION.  The tizanidinehcl has absorption maxima ( wavelength ) at 320.2nm in HCL.  In the development of analytical method of tizanidine hydrochloride the linearity was found to be 2 – 12ug/ml . & the correlation coefficient was found to be 0.99961.  The method was validated by such parameter like accuracy, precision, robustness, assay , ruggedness, linearity.
  • 21.
    FUTURE SCOPE 1. Optimizationof Method Parameters*: Investigate and optimize various parameters such as wavelength selection, solvent system, and pH conditions to enhance the sensitivity, selectivity, and robustness of the UV spectroscopic method .2. *Application to Complex Matrices*: Extend the validation study to include analysis of tizanidine hydrochloride in complex matrices such as pharmaceutical formulations or biological samples. This would involve developing sample preparation techniques to ensure accurate quantification in the presence of interfering substances. 3. *Comparative Studies*: Conduct comparative studies with other analytical techniques (e.g., HPLC, LC-MS) to evaluate the accuracy, precision, and reliability of UV spectroscopy for the analysis of tizanidine hydrochloride. This could help establish the method's suitability for routine quality control or pharmacokinetic studies. 4. *Stability Indicating Method*: Validate the developed UV spectroscopic method as a stability-indicating assay to assess the degradation products and stability of tizanidine hydrochloride under various stress conditions (e.g., temperature, light, pH) 5. *Method Transfer and Collaborative Studies*: Collaborate with other research groups or pharmaceutical companies to transfer the validated method to different laboratory settings or to conduct multi-center validation studies, thereby enhancing the method's applicability and credibility.
  • 22.
    REFERENCES- 1. Kenkel J.Analytical Chemistry For Technicians, Third Edition. CRC Publication; 2009. p. 2-4. 2. Kasture AV, Mahadik KR, Wadodkar SG, More HN. Pharmaceutical Analysis, Vol.II, Seventh Edition. Nirali Publication; 2007. p. 28-30. 3. Jeffery GH, Bassett J, Mendham J, Denny RC. Vogel’s Textbook of Quantitative Chemical Analysis, Fifth Edition. Longman Scientific and Technical Publishers; 1991. p. 3-13. 4. Chatwal GR, Anand SK. Instrumental Methods of Chemical Analysis, Fifth Edition. Himalaya Publishing House; 2008. p. 2.108-2.124 5. Vermeij TAC, Edelbroek PM. High Performance Liquid Chromatographic and megabore Gas-Liquid Chromatographic determination of Levetiracetam in human serum after solid-phase extraction. J Chromatogr B. 1994;375:134-139. 6. Contin M, Mohamed S, Albani F, Riva R, Baruzzi A. Simple and validated HPLCUV analysis of Levetiracetam in deproteinized plasma of patients with epilepsy. J Chromatogr B. 2008;873:129-132 7. Ravisankar P, Naga Navya C, Pravallika D, Navya Sri D. A Review on Step-by-Step Analytical Method Validation. 2015;5(10):07-19. 8. ICH Q2 (R1), Validation of Analytical Procedures: Text and Methodology. International Conference on Harmonization. Geneva: IFPMA; 2005. 9. Pavia DL, Lampman GM, Kriz GS. Introduction to Spectroscopy, Third Edition. Thomson Learning publication; 2007. p. 356, 797-817. 10. Beckett AH, Stenlake JB. Practical Pharmaceutical Chemistry, Fourth Edition Part II. CBS Publishers and Distributors; 2004. p. 284-300, 162-163
  • 23.
    11. WWW.WIKIPEDIA.ECYCLOPEDIA 12. https://www.slideshare.net. 13. www.ezyaccess.in. 14. http://www.delnet.in. 15. https://www.sciencedirect.com 16. https://www.chromatographytoday.com