
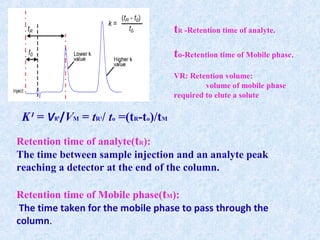
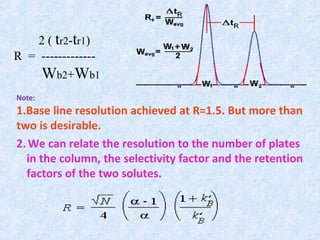

![Plate height = H = A + B/u + u [CM +CS]
Van Deemter model
u = L/ tM
A: Eddy diffusion
random movement through stationary phase
B: Longitudinal diffusion
diffusion from high concentration to low concentration
CS: Stationary mass transfer
CM: Mobile phase mass transfer
u: average linear velocity of mobile phase](https://image.slidesharecdn.com/3-190626174117/85/Chromarogaphy-system-suitability-ppt-22-320.jpg)
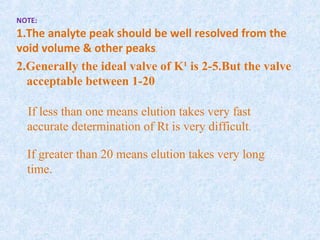
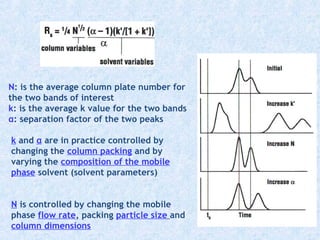
![Term A
- molecules may travel
unequal distances
- independent of u
- depends on size of
stationary particles or
coating (TLC)
H = A + B/u + u [CM +CS]
Van Deemter model
time
Eddy diffusion
MP moves through the column
which is packed with stationary
phase. Solute molecules will take
different paths through the
stationary phase at random. This
will cause broadening of the
solute band, because different
paths are of different lengths.](https://image.slidesharecdn.com/3-190626174117/85/Chromarogaphy-system-suitability-ppt-23-320.jpg)
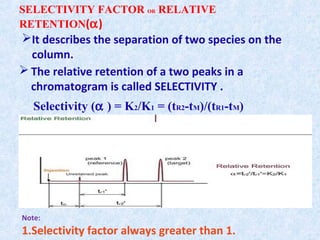
![Term B
H = A + B/u + u [CM +CS]
Van Deemter model
Longitudinal diffusion
B = 2γ DM
γ: Impedance factor due to
packing
DM: molecular diffusion
coefficient
B term dominates at low u and is
more important in GC than LC
since DM(gas) > 104
DM(liquid)
One of the main causes of
band spreading is
DIFFUSION
The diffusion
coefficient measures
the ratio at which a
substance moves
randomly from a region
of high concentration to
a region of lower
concentration](https://image.slidesharecdn.com/3-190626174117/85/Chromarogaphy-system-suitability-ppt-24-320.jpg)
![Term B
H = A + B/u + u [CM +CS]
Van Deemter model
Longitudinal diffusion
B = 2γ DM
γ: Impedance factor due to
packing
DM: molecular diffusion
coefficient
B term dominates at low u and is
more important in GC than LC
since DM(gas) > 104
DM(liquid)
B - Longitudinal diffusion
The concentration of analyte is less
at the edges of the band than at
the centre. Analyte diffuses out
from the centre to the edges. This
causes band broadening. If the
velocity of the mobile phase is high
then the analyte spends less time
on the column, which decreases
the effects of longitudinal
diffusion.](https://image.slidesharecdn.com/3-190626174117/85/Chromarogaphy-system-suitability-ppt-25-320.jpg)
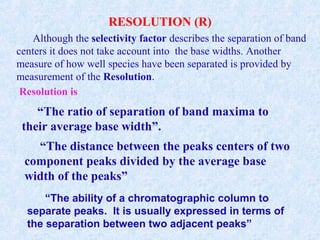
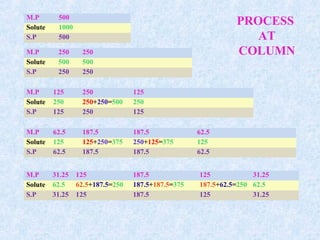
![Cs: stationary phase mass transfer
Cs = [(df)2
]/Ds
df: stationary phase film thickness
Ds: diffusion coefficient of analyte in SP
CM: mobile phase – mass transfer
CM = [(dP)2
]/DM packed columns
CM = [(dC)2
]/DM open columns
H = A + B/u + u [CM +CS]
Van Deemter model
Term C
dP: particle diameter
dC: column diameter
Bandwidth
Stationary
phase
Mobile
phase
Elution
Broadened bandwidth
Slow
equilibration](https://image.slidesharecdn.com/3-190626174117/85/Chromarogaphy-system-suitability-ppt-26-320.jpg)
![Cs: stationary phase mass transfer
CM: mobile phase – mass transfer
H = A + B/u + u [CM +CS]
Van Deemter model
Term C
Bandwidth
Stationary
phase
Mobile
phase
Elution
Broadened bandwidth
Slow
equilibration
C - Resistance to mass transfer
The analyte takes a certain amount of time to equilibrate between the stationary
and mobile phase. If the velocity of the mobile phase is high, and the analyte has
a strong affinity for the stationary phase, then the analyte in the mobile phase
will move ahead of the analyte in the stationary phase. The band of analyte is
broadened. The higher the velocity of mobile phase, the worse the broadening
becomes.](https://image.slidesharecdn.com/3-190626174117/85/Chromarogaphy-system-suitability-ppt-27-320.jpg)


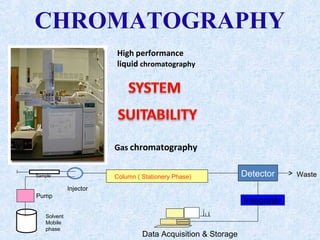
The document discusses chromatography and system suitability testing. It defines system suitability testing as verifying that the chromatographic system is suitable for the intended analysis. Key parameters of system suitability testing include precision, capacity factor, resolution, theoretical plates, and tailing factor. Tests are run at the beginning and end of analysis, or when changes are made to the equipment or reagents. Acceptance criteria for parameters like precision and tailing factor are provided.


