Download to read offline


![10.References
1. Guy RC. International Conference on Harmonisation. Encycl Toxicol Third
Ed. 2014;2:1070–1072.
2. Thakare L, Ahmad S, Shastry VM. Development and Validation of Uv-
Visible Spectrophotometric Method for Estimation of Cilnidipine and
Telmisartan in Bulk and Dosage Form. Indo Am J Pharm Res.
2017;7(04):8552–8559.
3. Jenisha Modi, Shivangi K. Patel, Namrata Parikh, Shreya R. Shah* PKP and
UMU. World Journal of Pharmaceutical Research. Infection. 2014;5(2):831-
847.
4. Rane AS, Mahajan SK. Validation and Forced Stability-Indicating Hptlc
Method for Determination of Azelnidipine. Rane al World J Pharm Res
World J Pharm Res SJIF Impact Factor 6 [Internet]. 2016;5(9):1053–1062.
Available from: www.wjpr.net
6/16/2021 DOPs, SIHAS, SHUATS, Prayagraj, U.P, India 29](https://image.slidesharecdn.com/vivapresentation-210616085527/75/Analytical-Method-Development-and-validation-of-UV-Visible-spectroscopy-29-2048.jpg)


This document presents the analytical method development and validation of azelnidipine using UV-visible spectroscopy. It outlines the methodology, including the calibration curve and validation parameters like linearity, accuracy, and precision, ensuring compliance with ICH guidelines. The study aims to develop a rapid, sensitive, and economic method for estimating azelnidipine in drug formulations.
Introduction of azelnidipine analysis using UV-Visible spectroscopy presented at SIHAS in India.
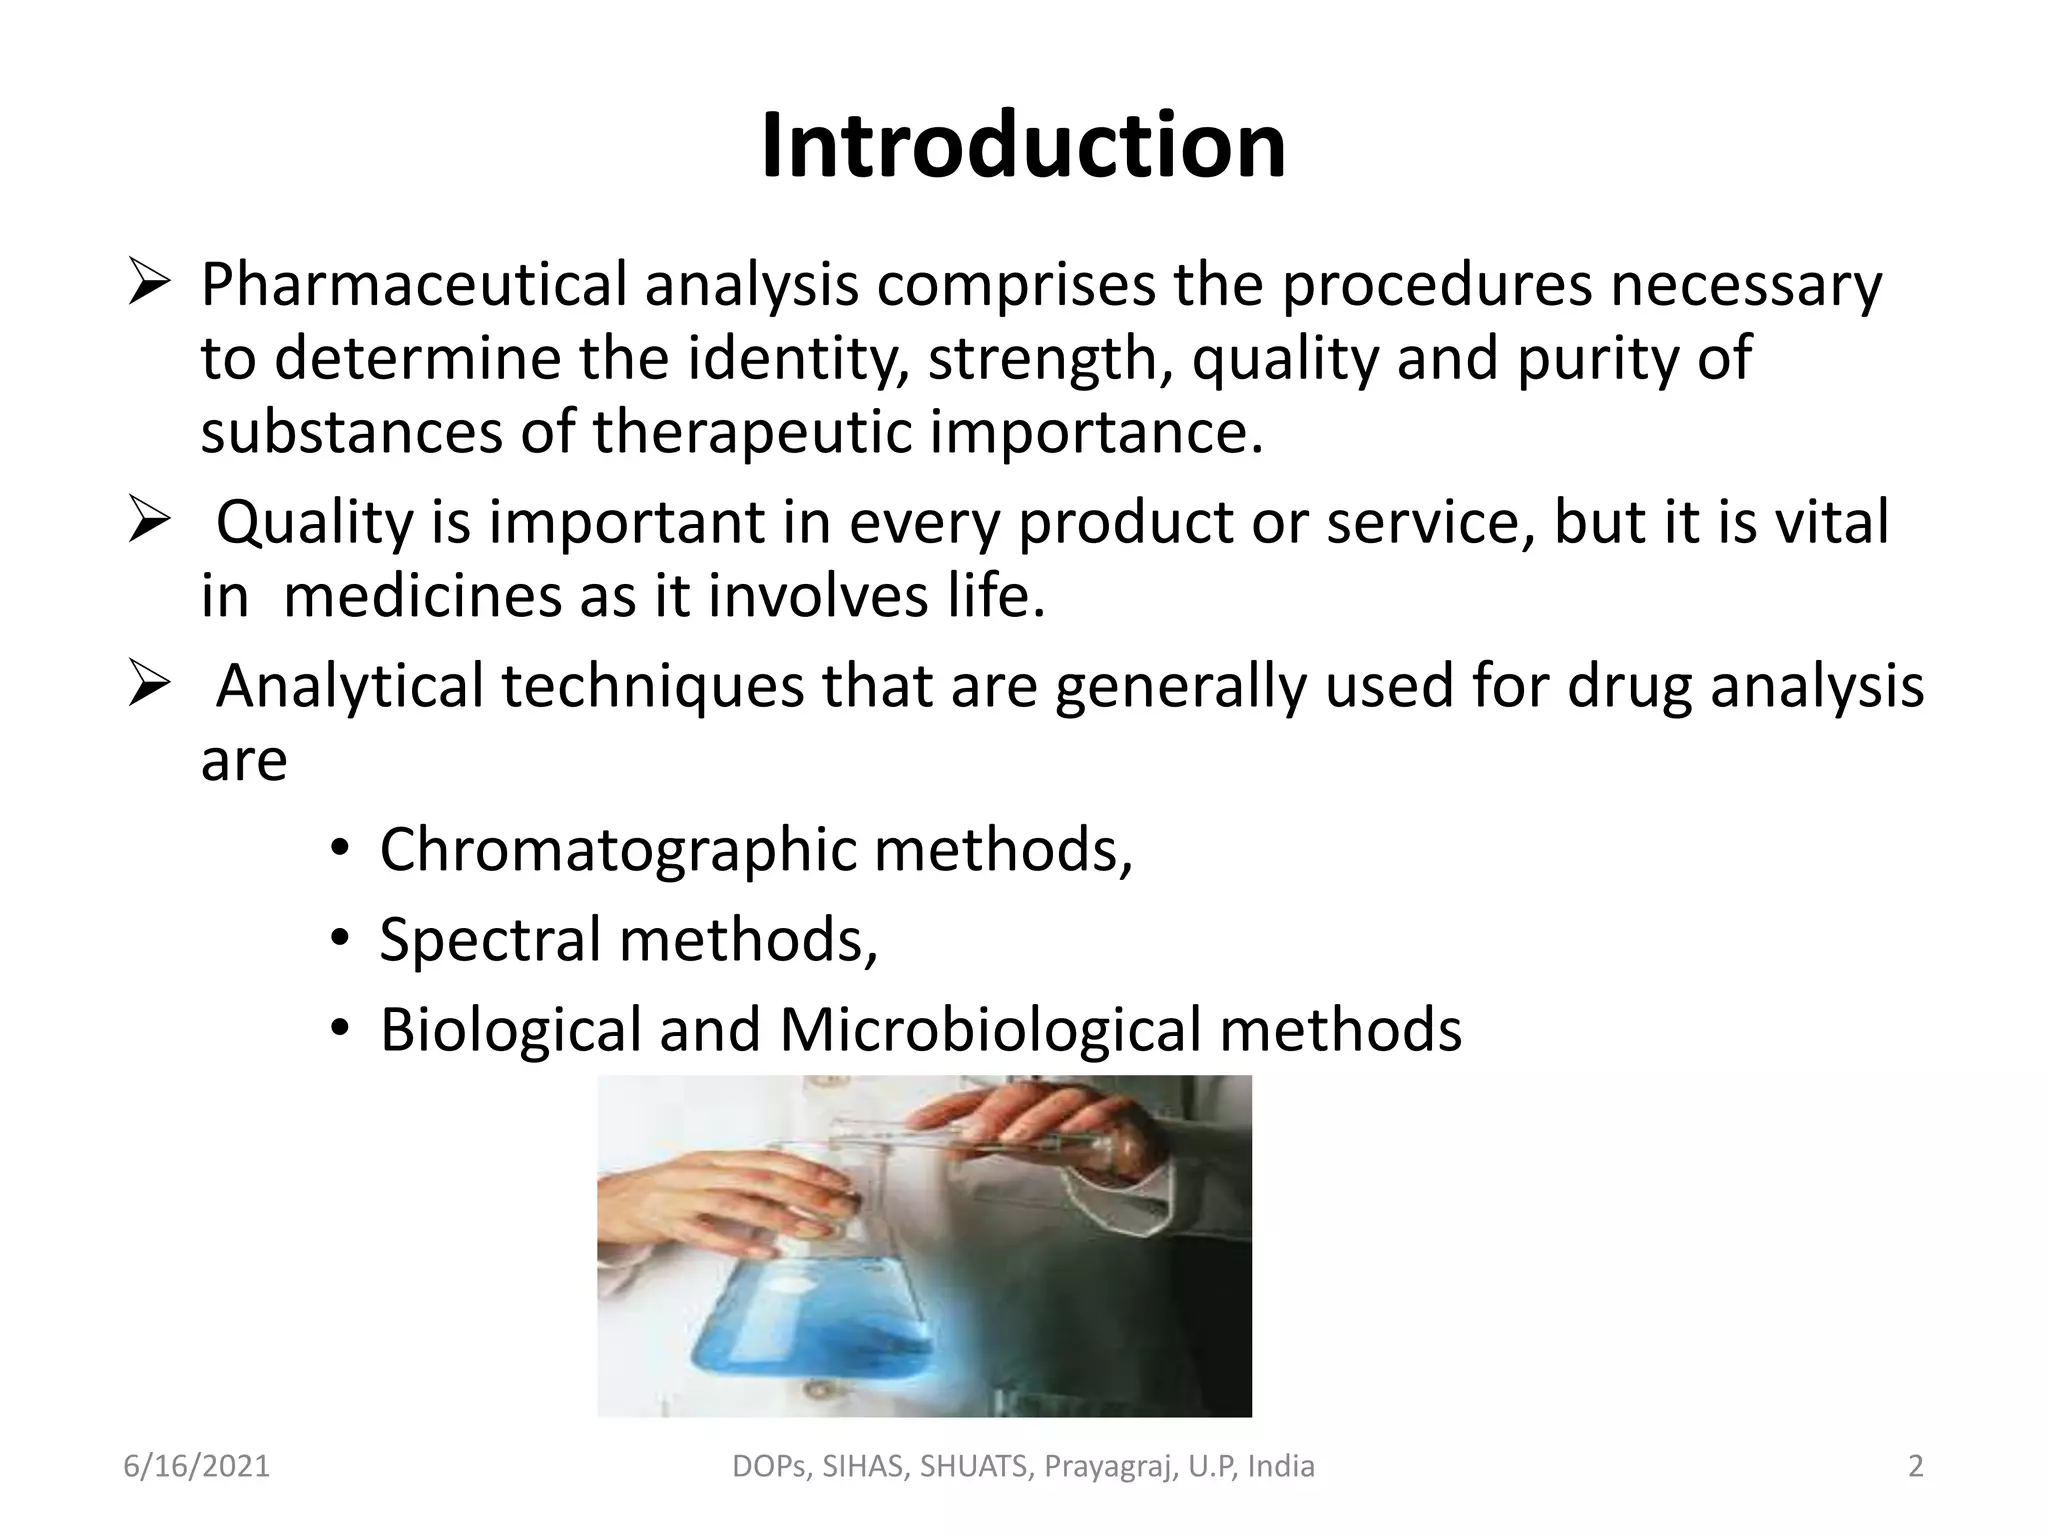
Discusses the necessity for quality in pharmaceuticals and common analytical techniques used.
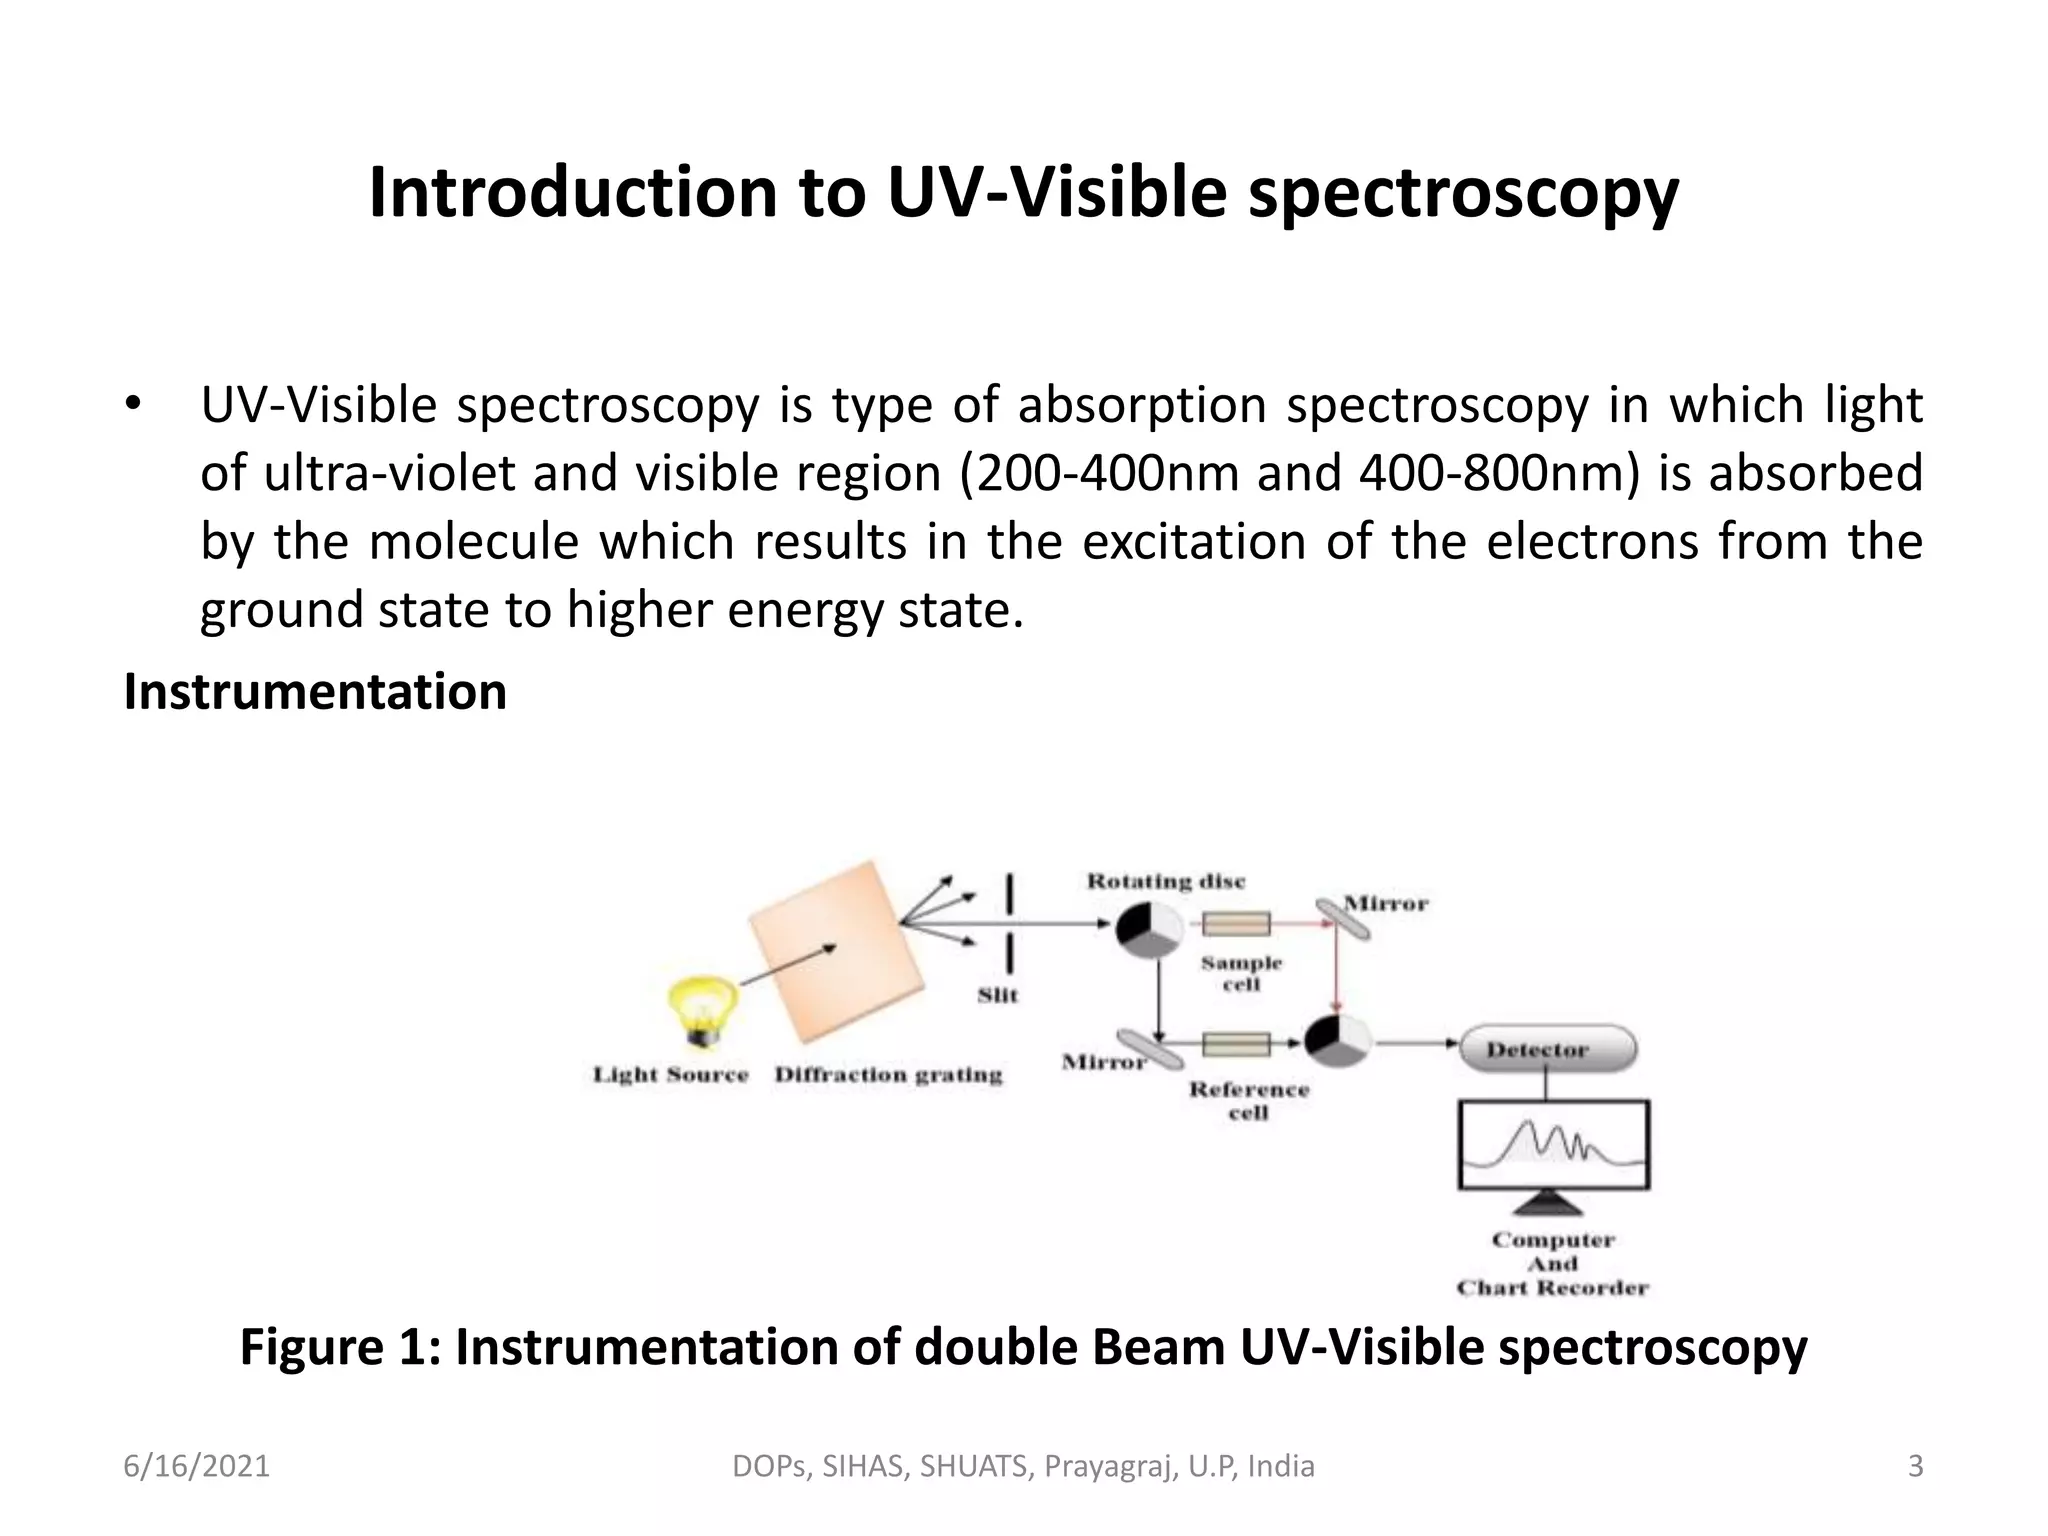
Introduction to UV-Visible spectroscopy, focusing on its absorption principles and instrumentation.
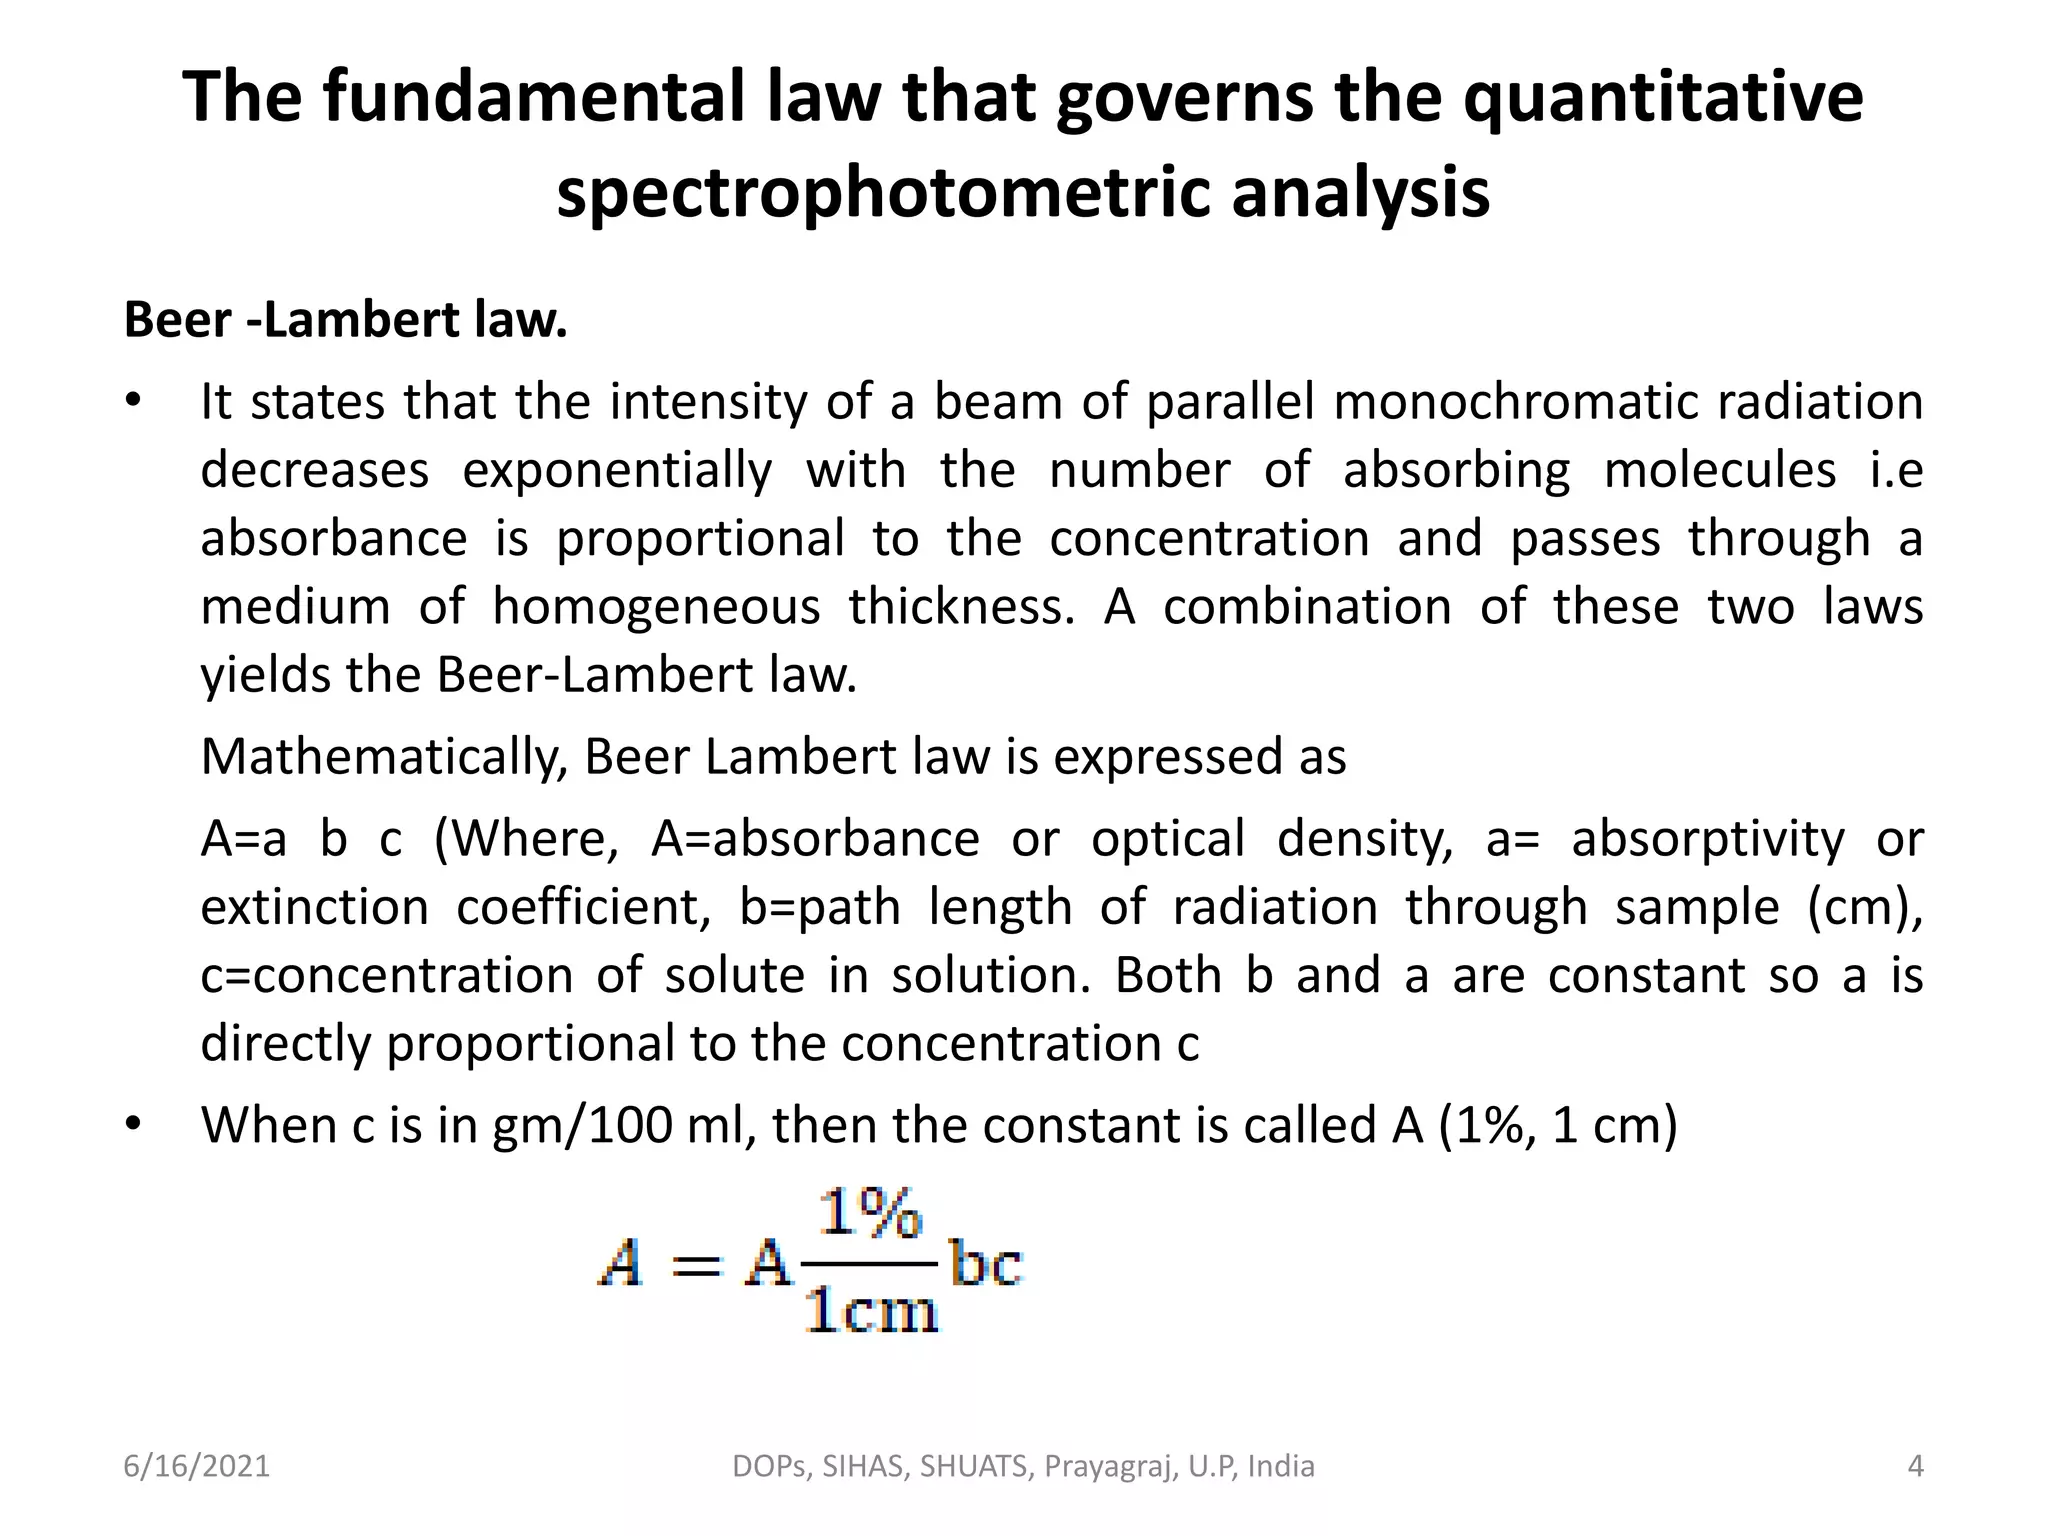
Explanation of the Beer-Lambert law, its mathematical representation, and its implications in spectroscopy.
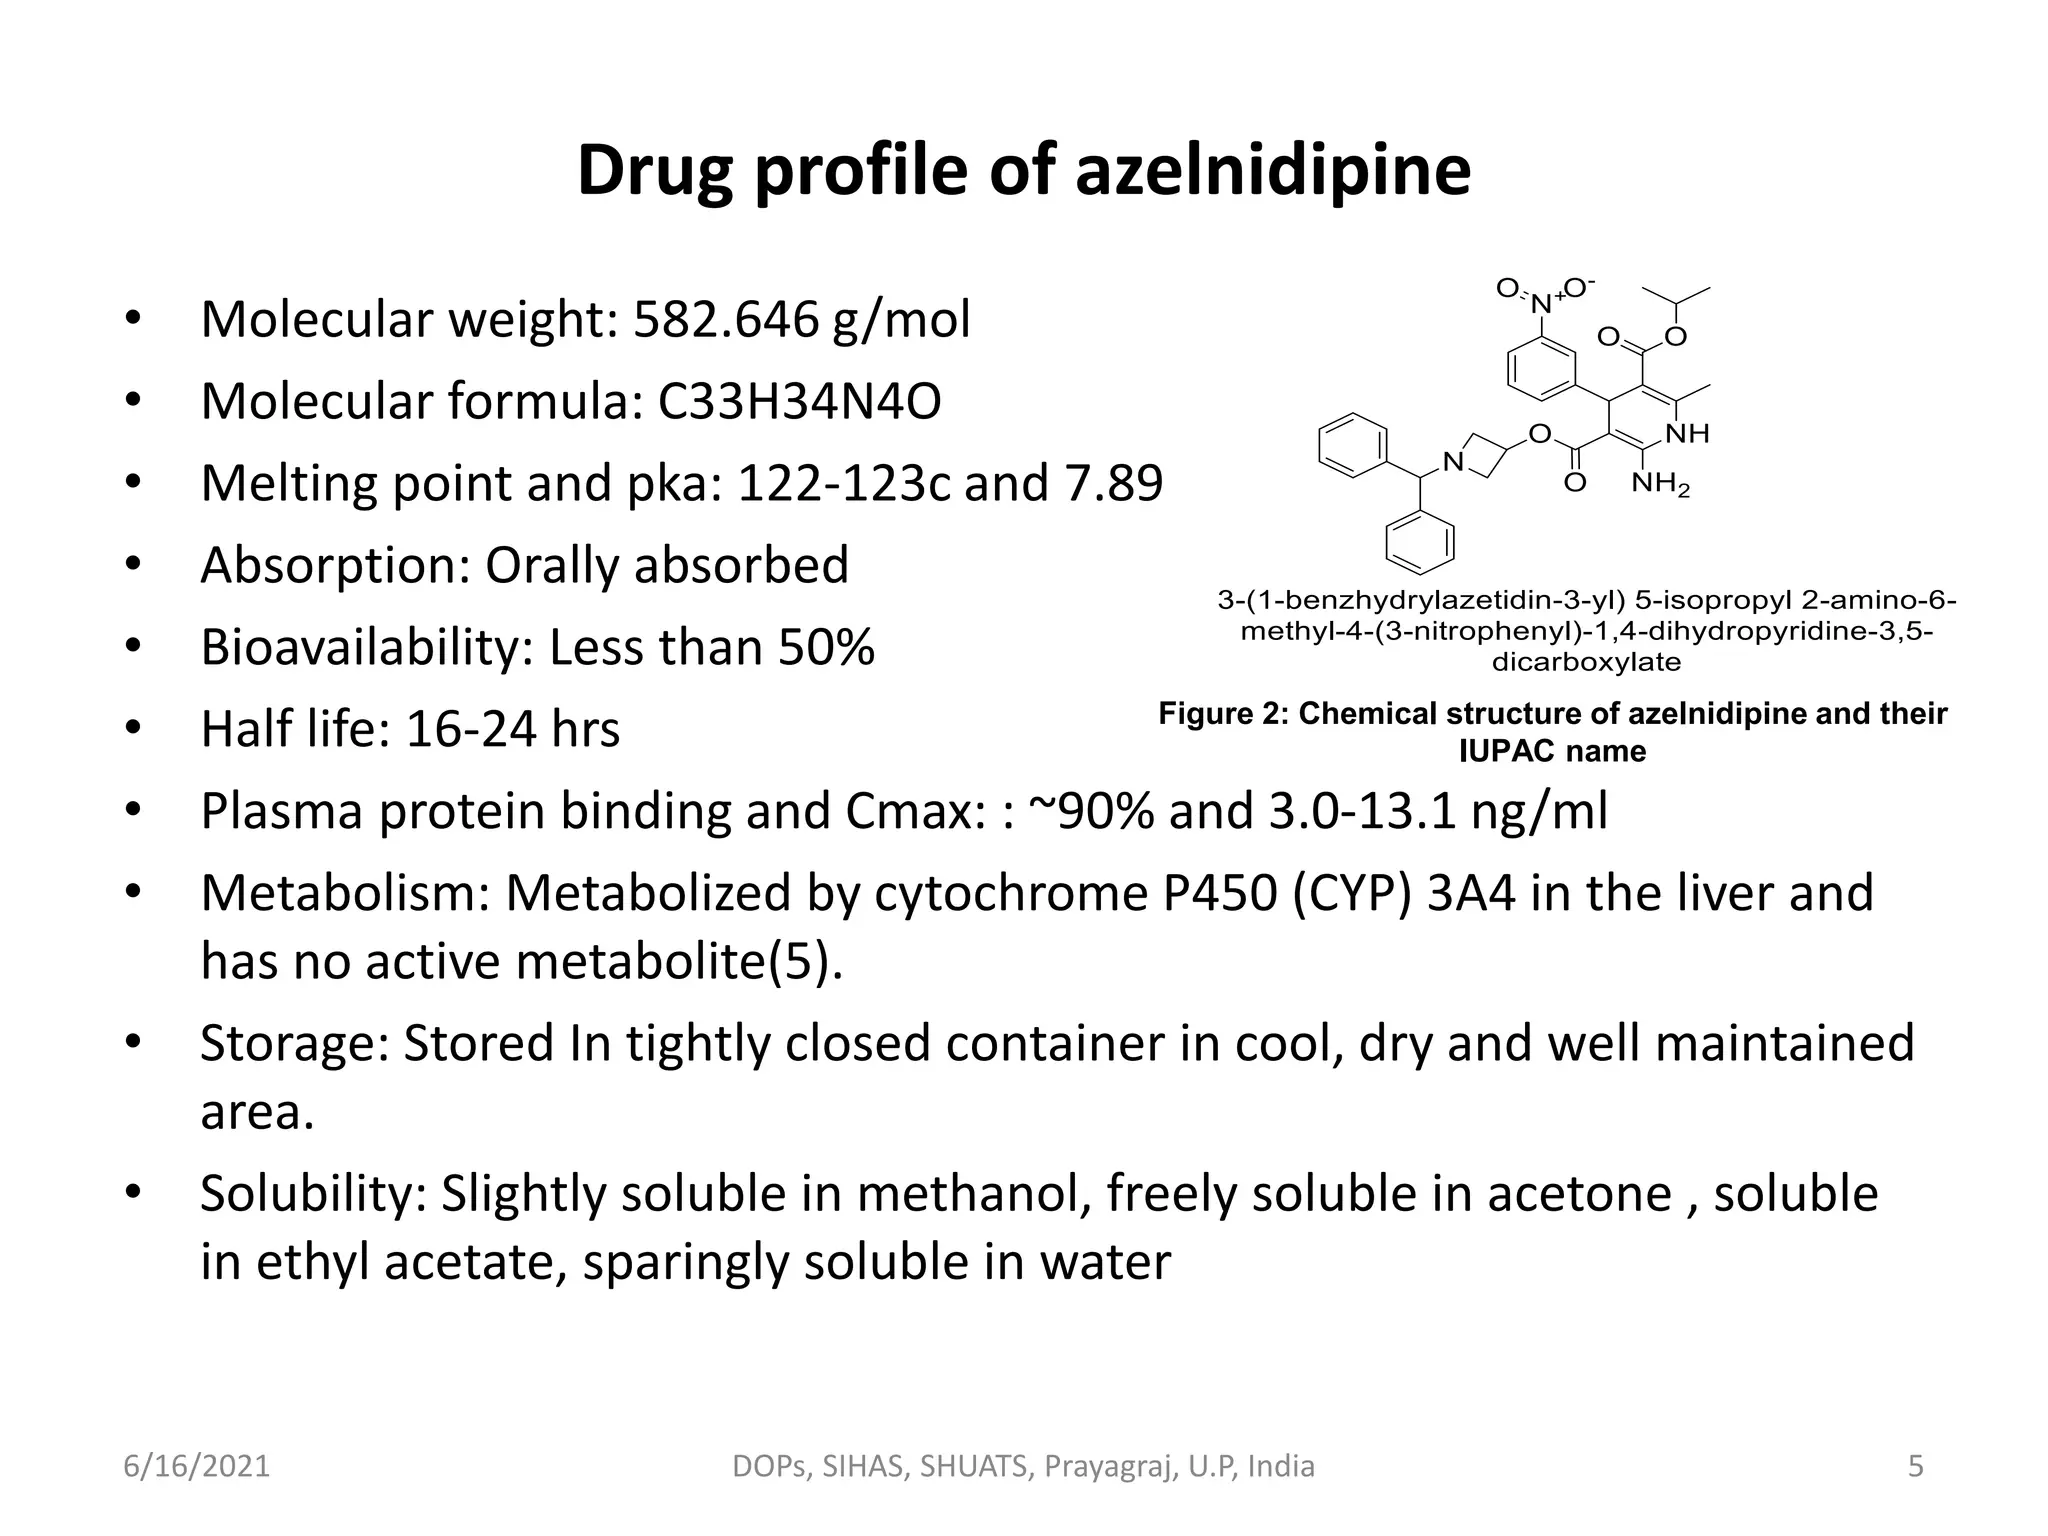
Details on azelnidipine's molecular properties, absorption, bioavailability, metabolism, and storage.
Aims for developing analytical methods to estimate azelnidipine with criteria for effectiveness.
Outlines the methodology including selection of wavelengths and sample preparation for azelnidipine.
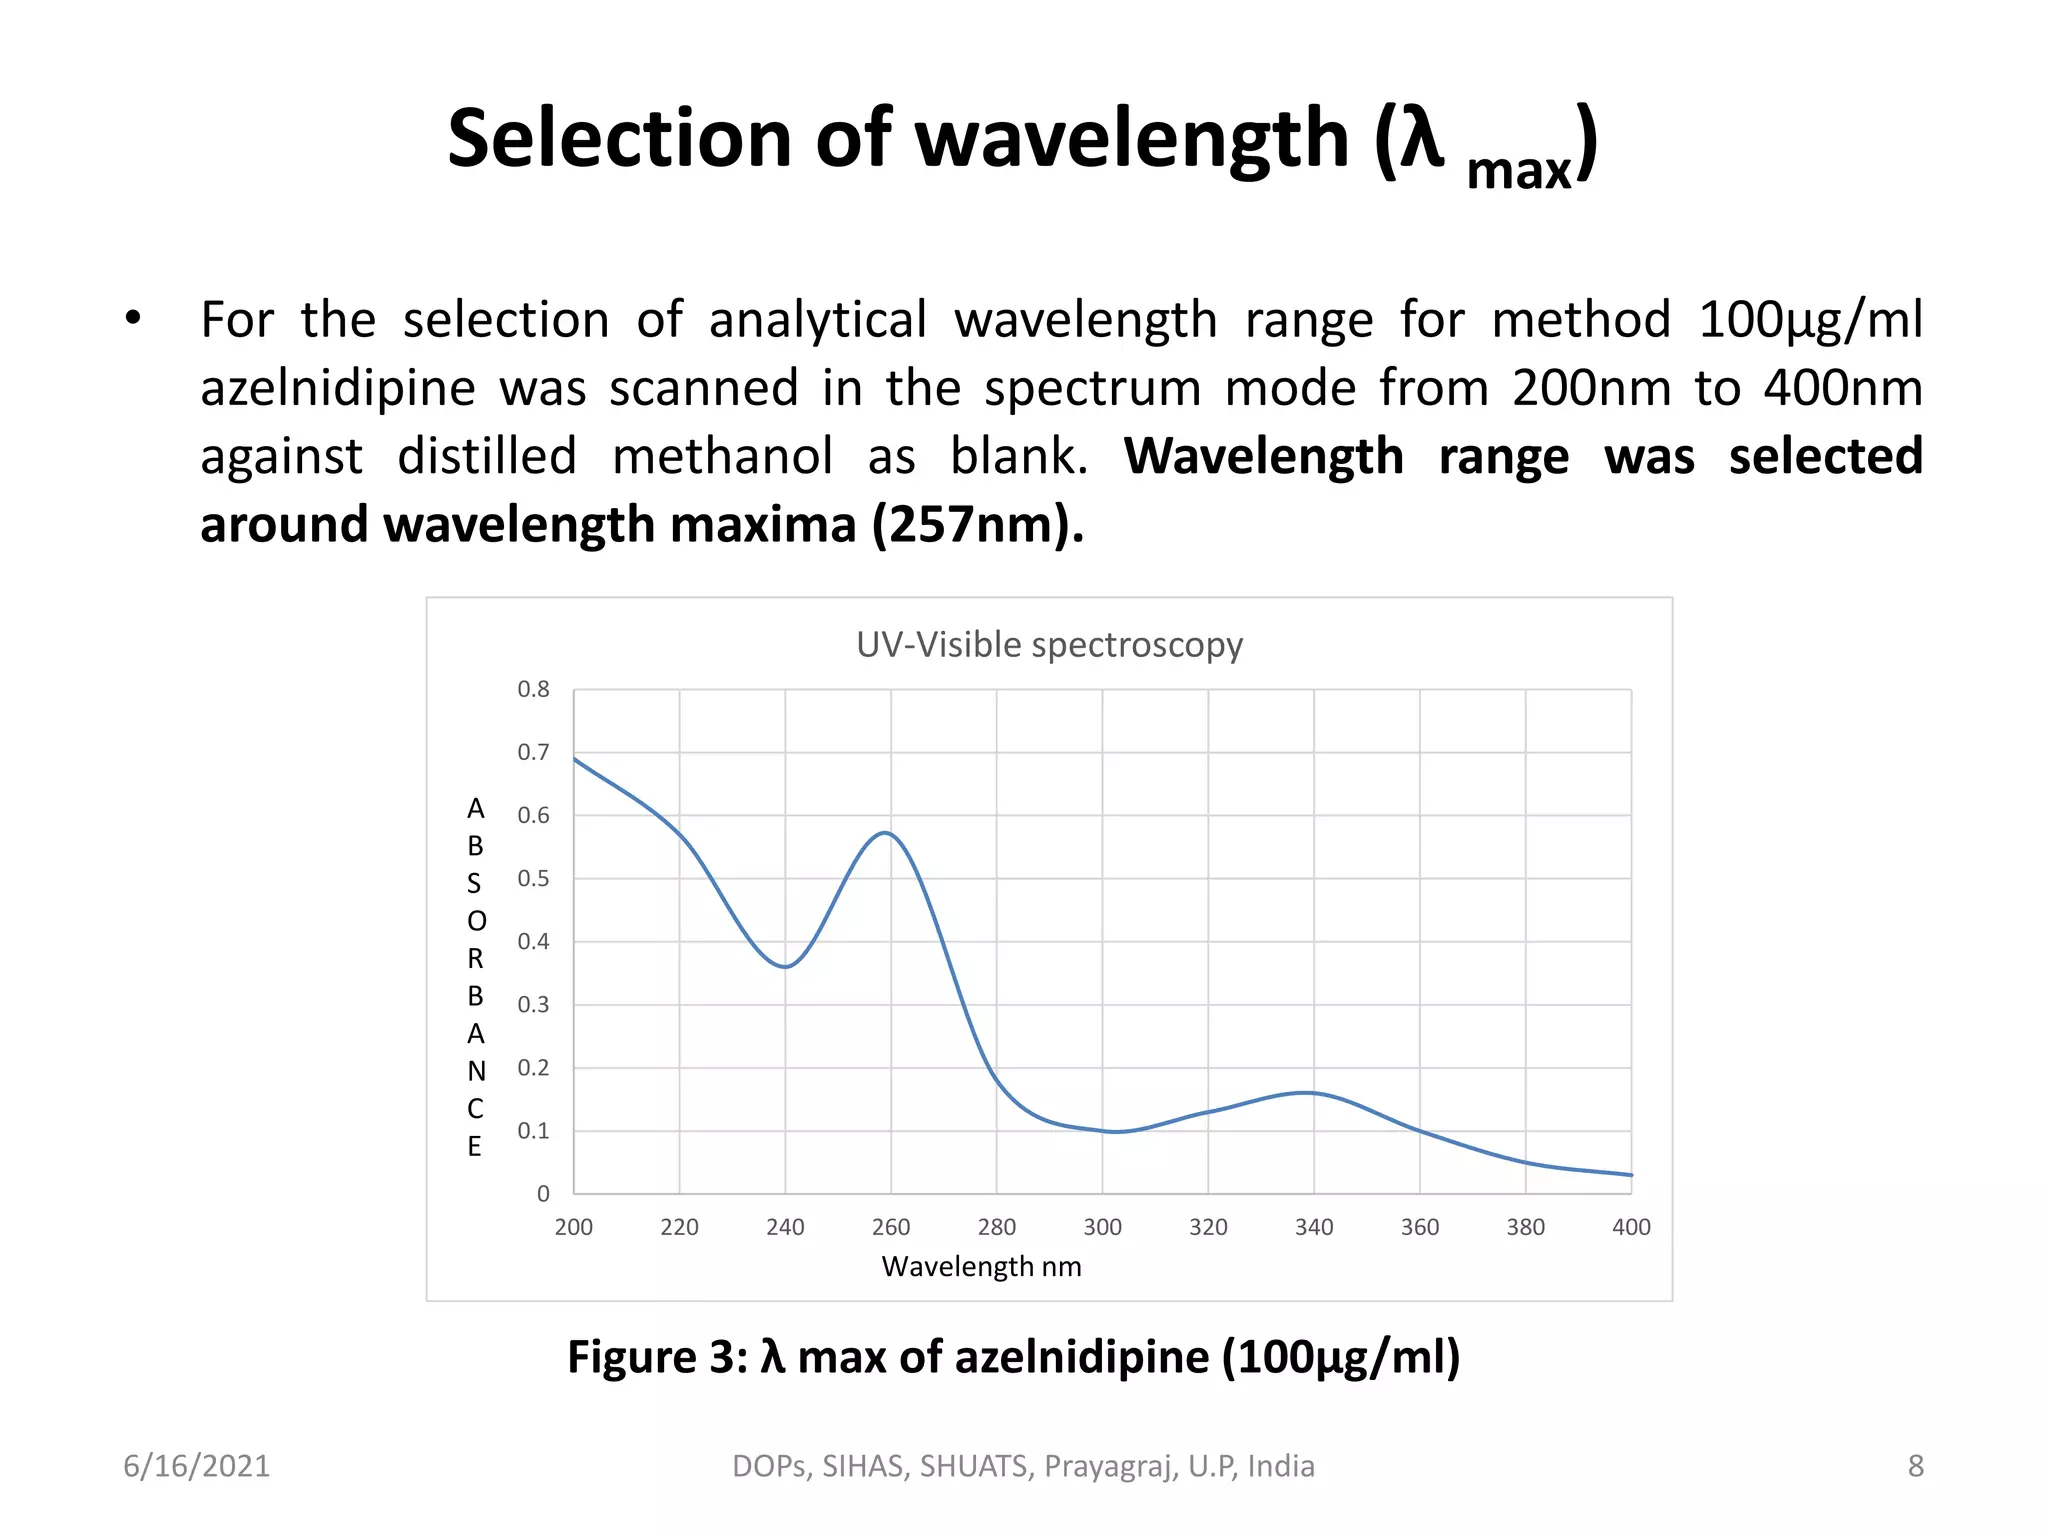
Details on the selection of the analytical wavelength (λ max) for azelnidipine during spectroscopy.
Process of developing a UV-Visible method for azelnidipine, highlighting good results at 257nm.
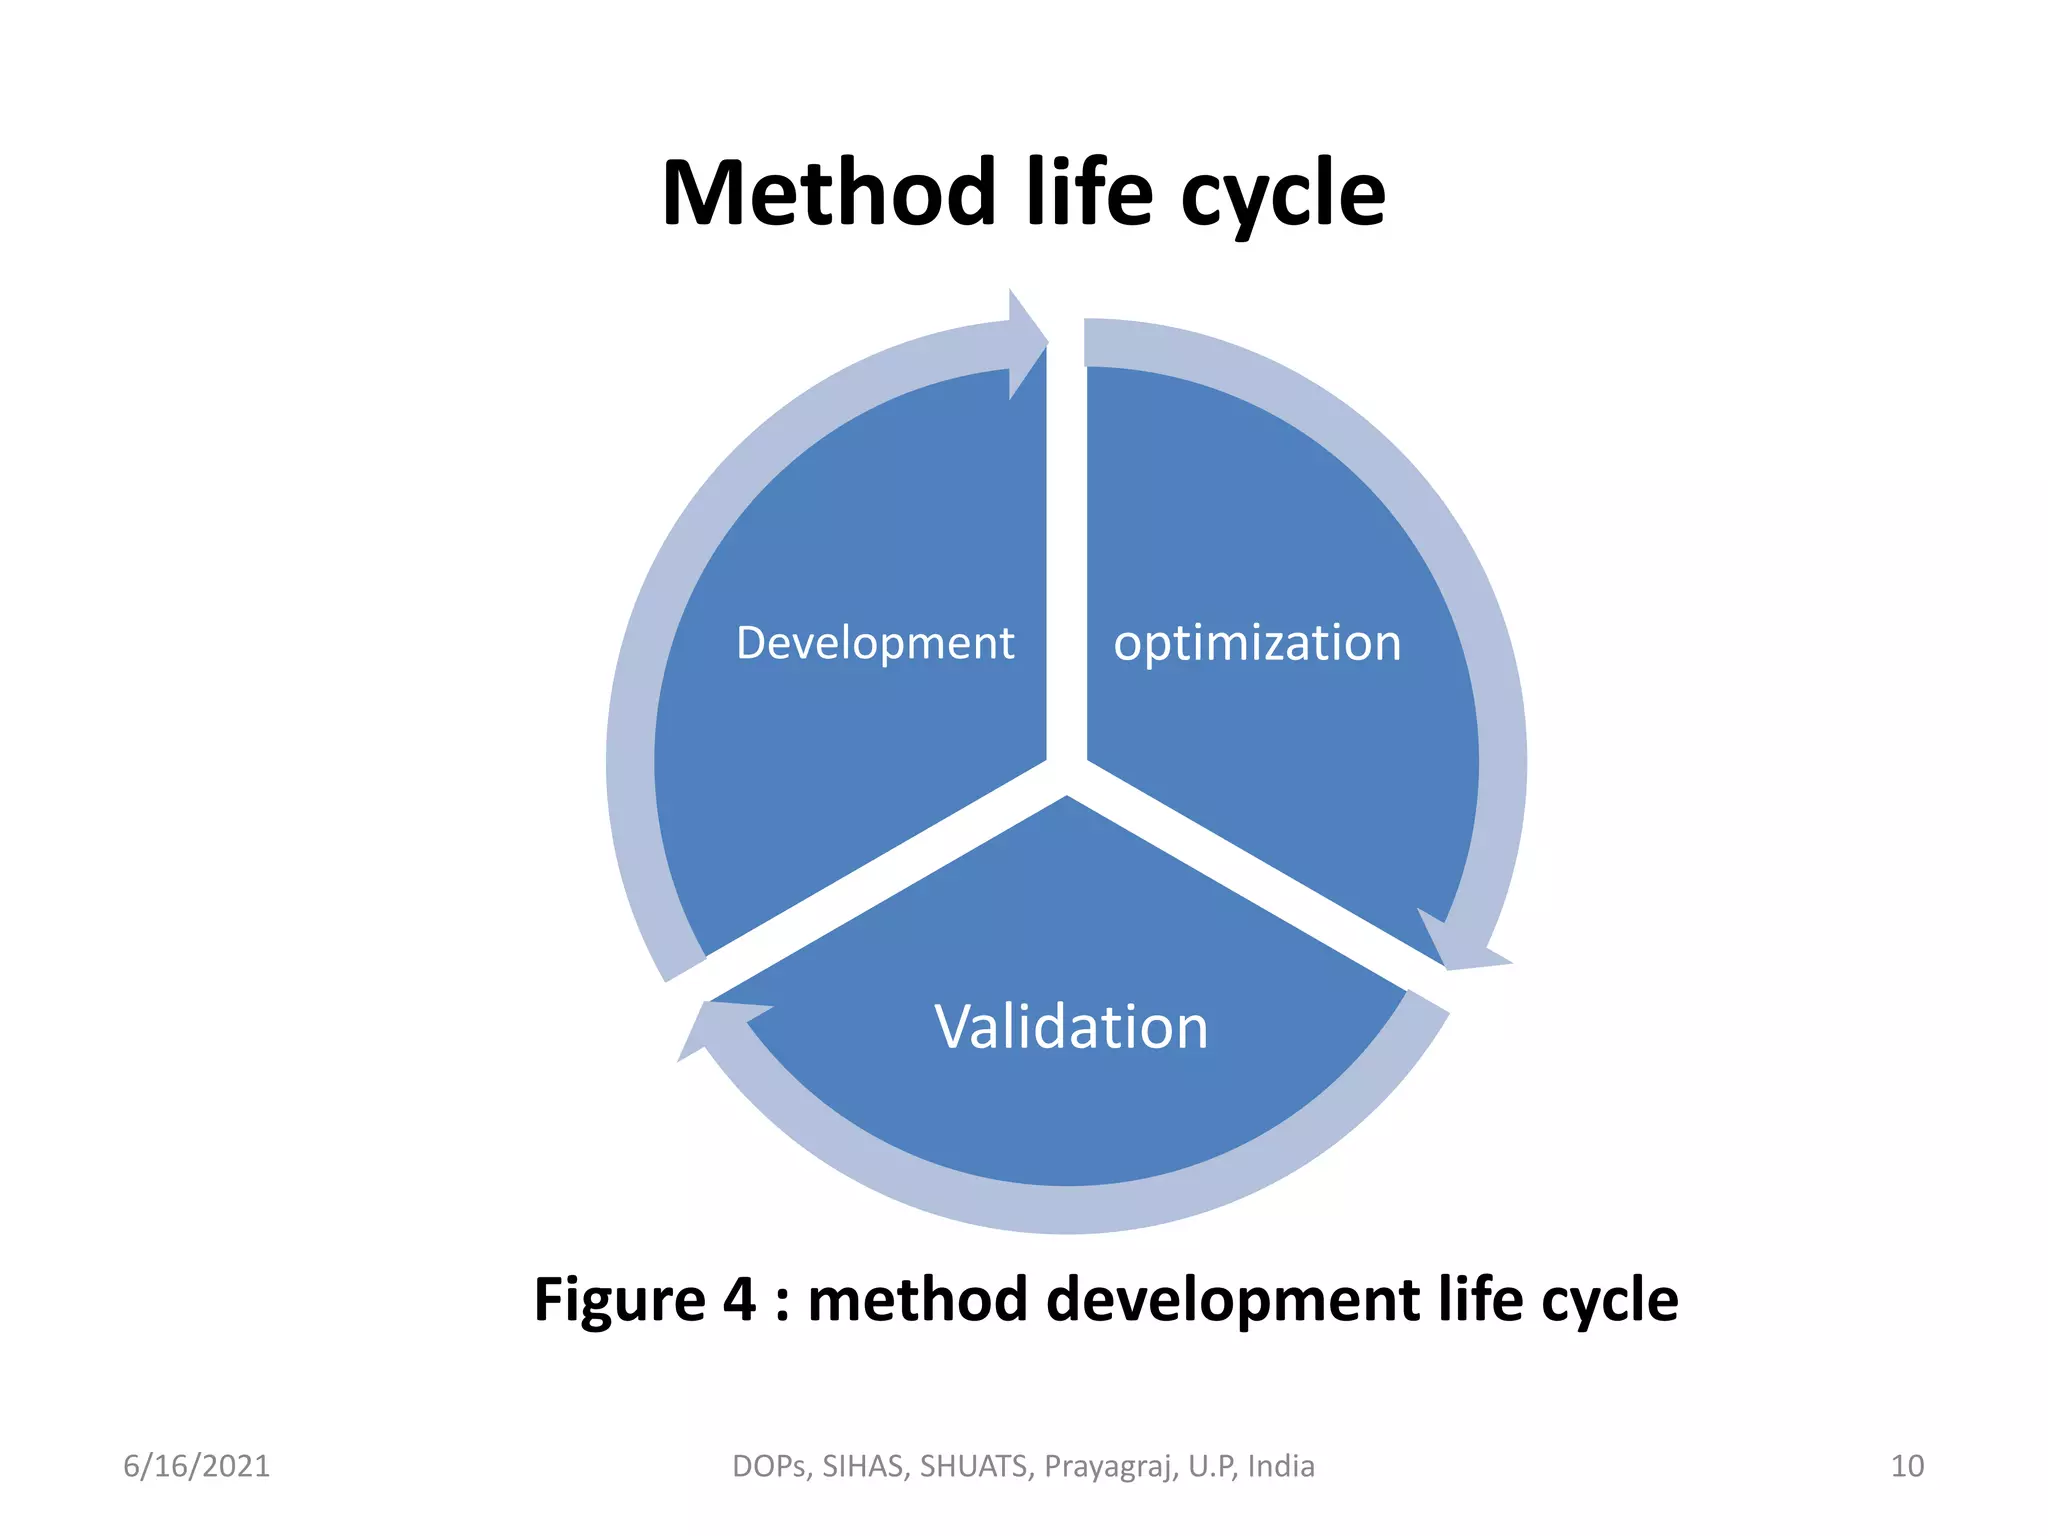
Illustrates the life cycle involved in method development including validation and optimization.
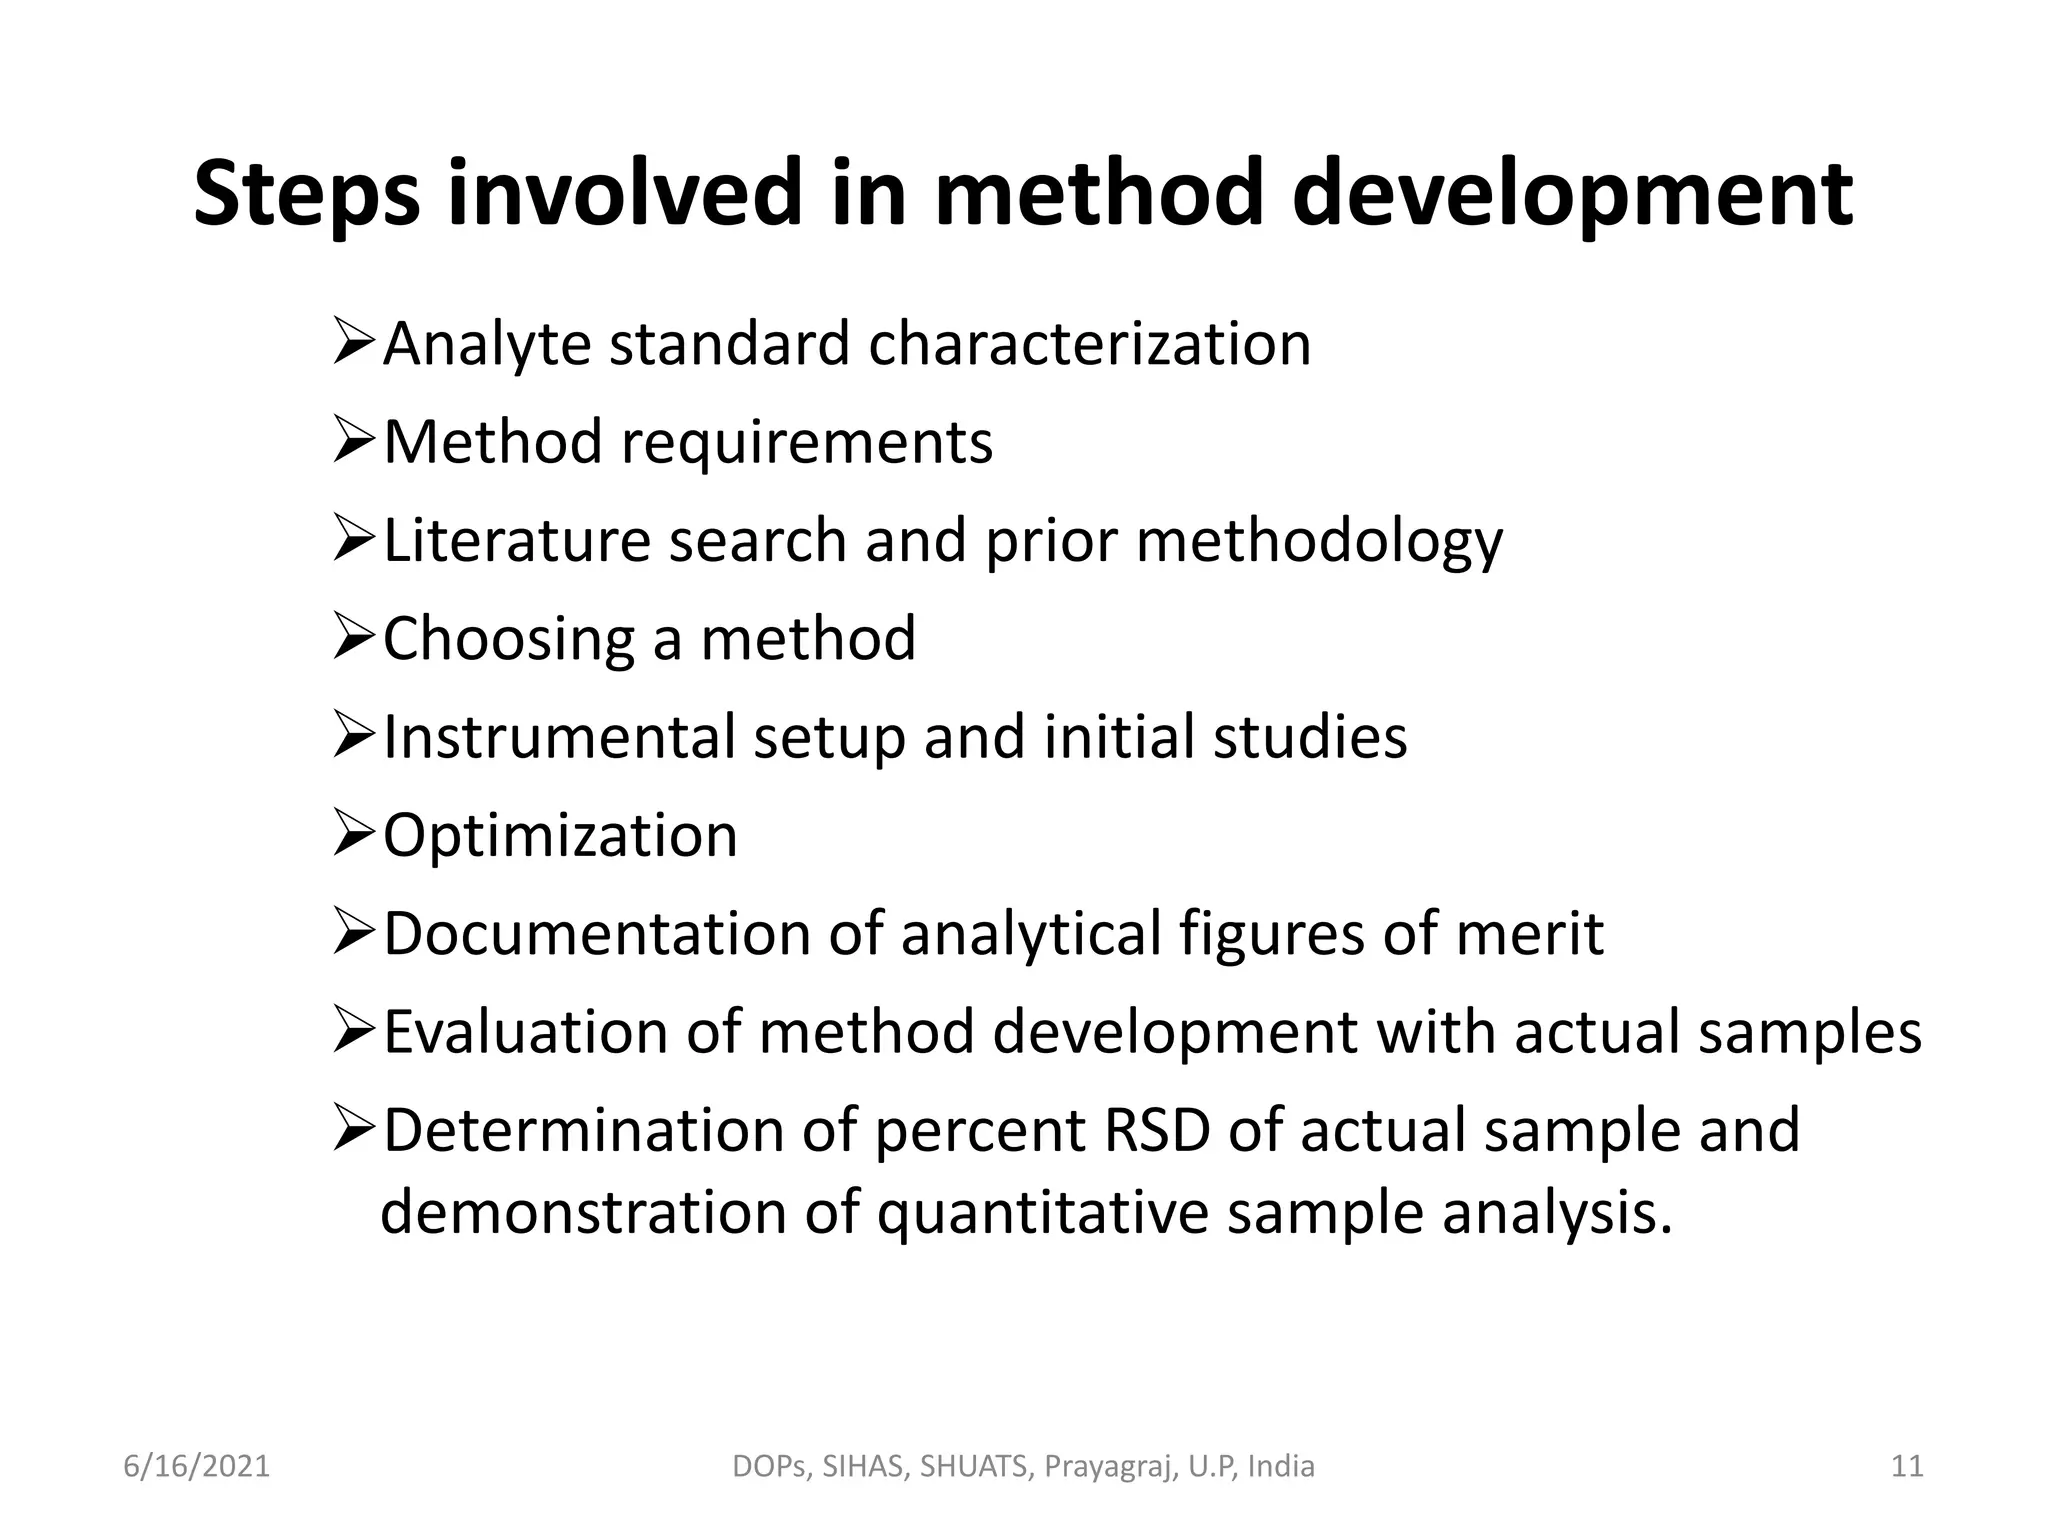
Enumerates the essential steps involved in the methodology for developing a new analytical method.
Definition and importance of validating analytical methods to ensure they meet predefined criteria.
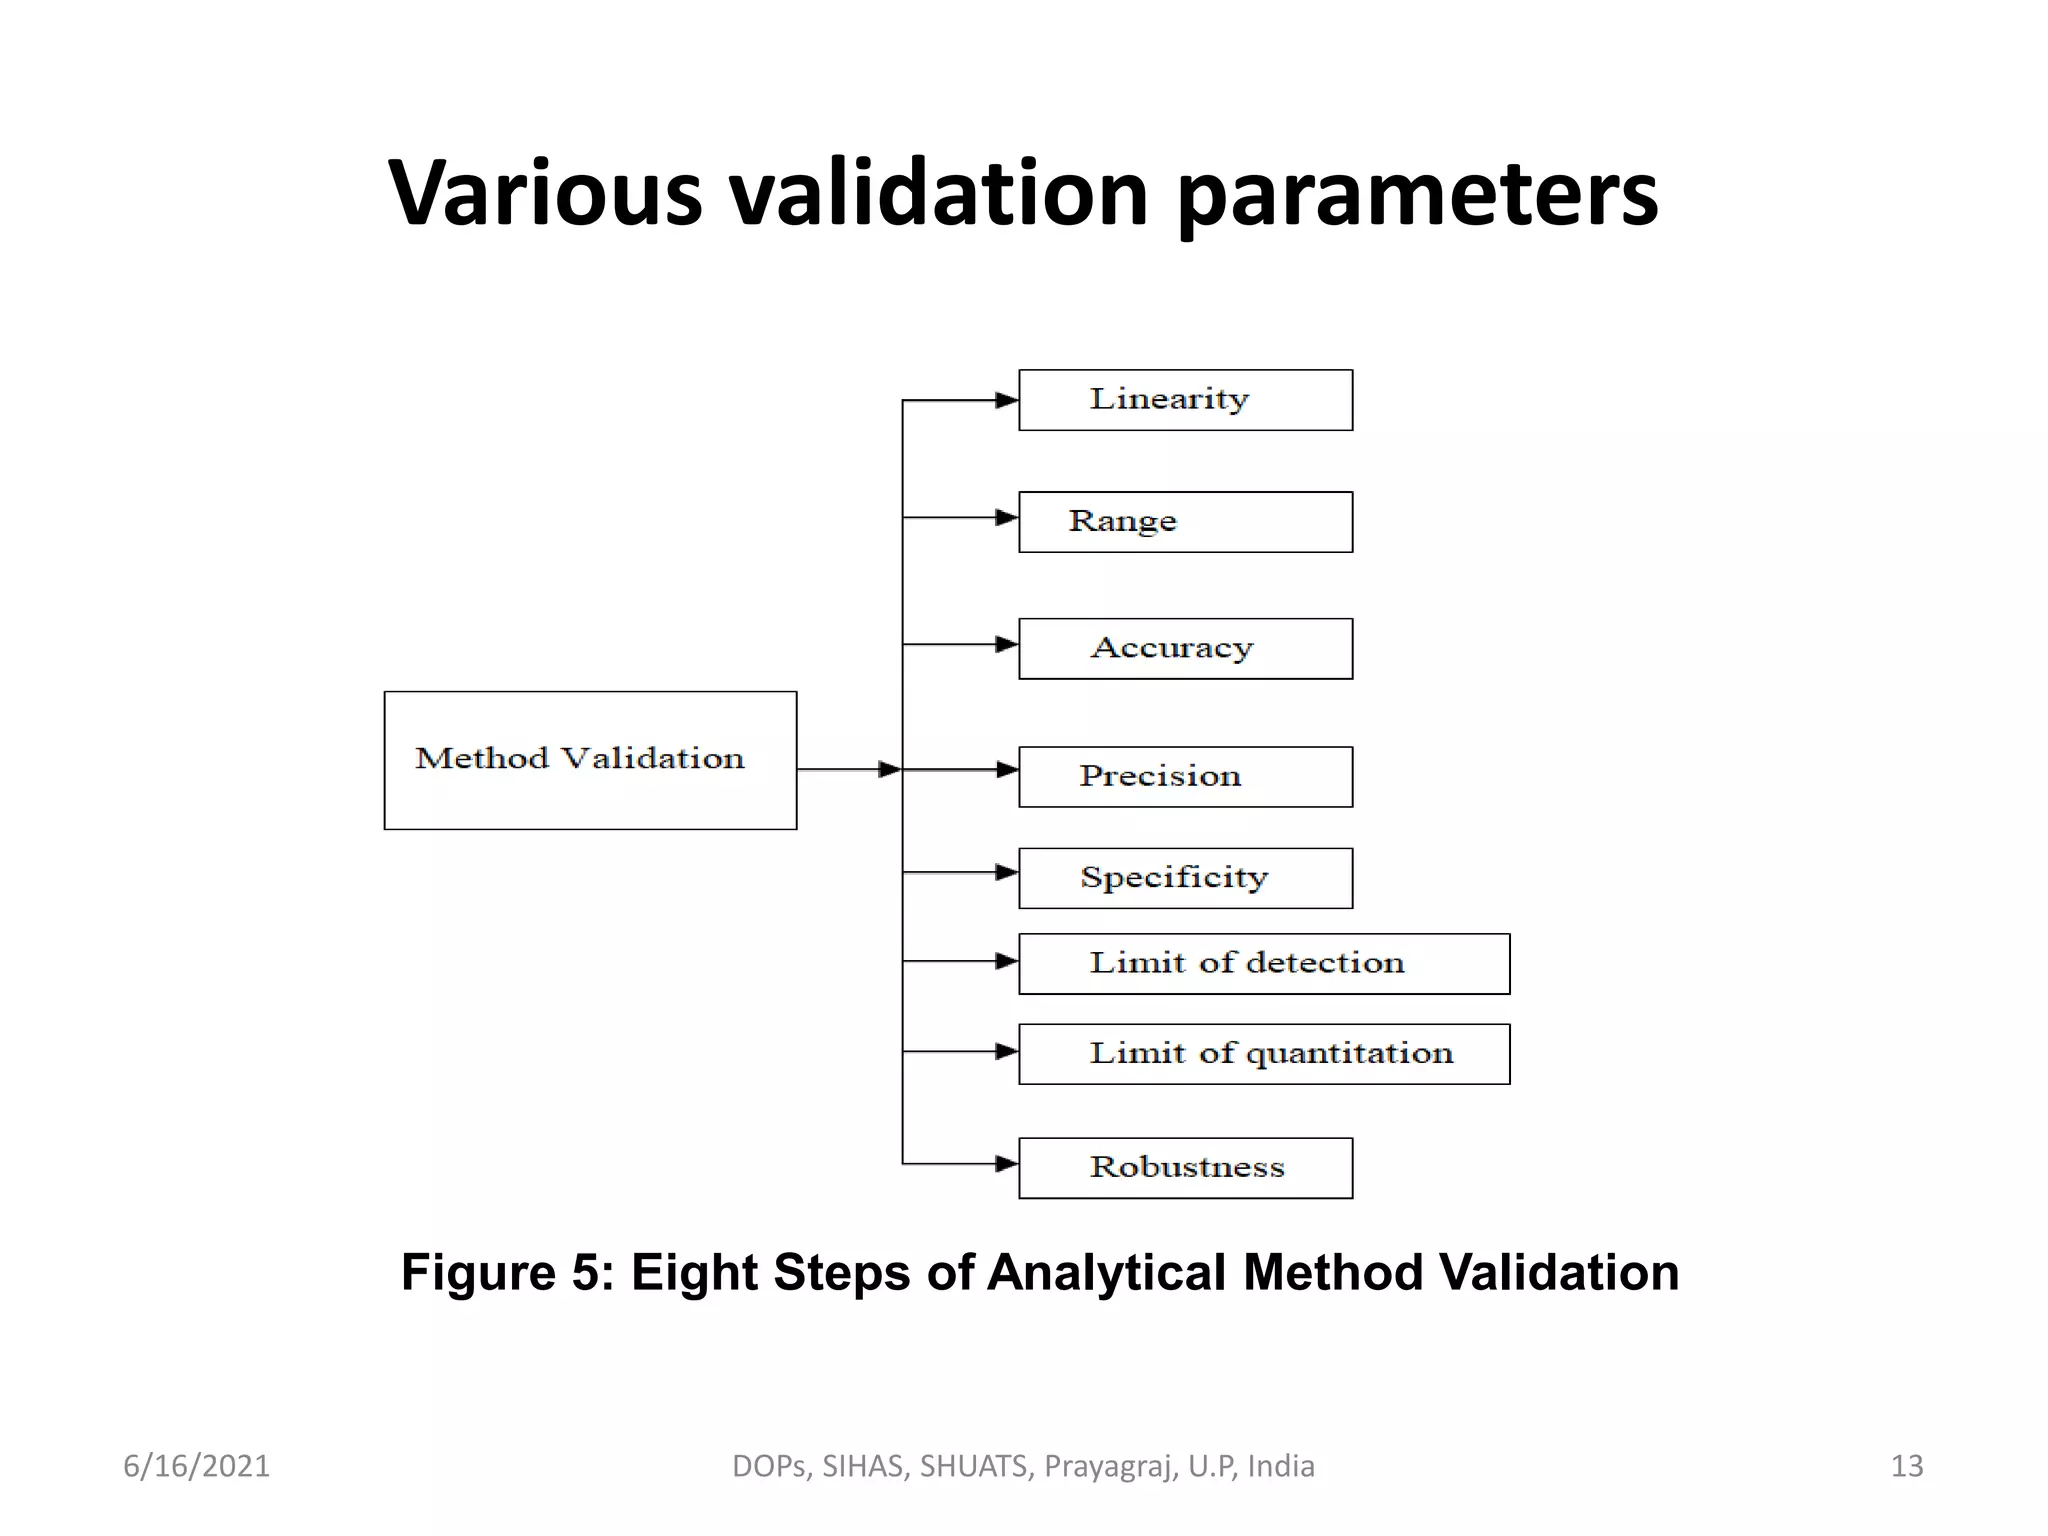
A visual representation of the 8 steps involved in analytical method validation for pharmaceutical analysis.
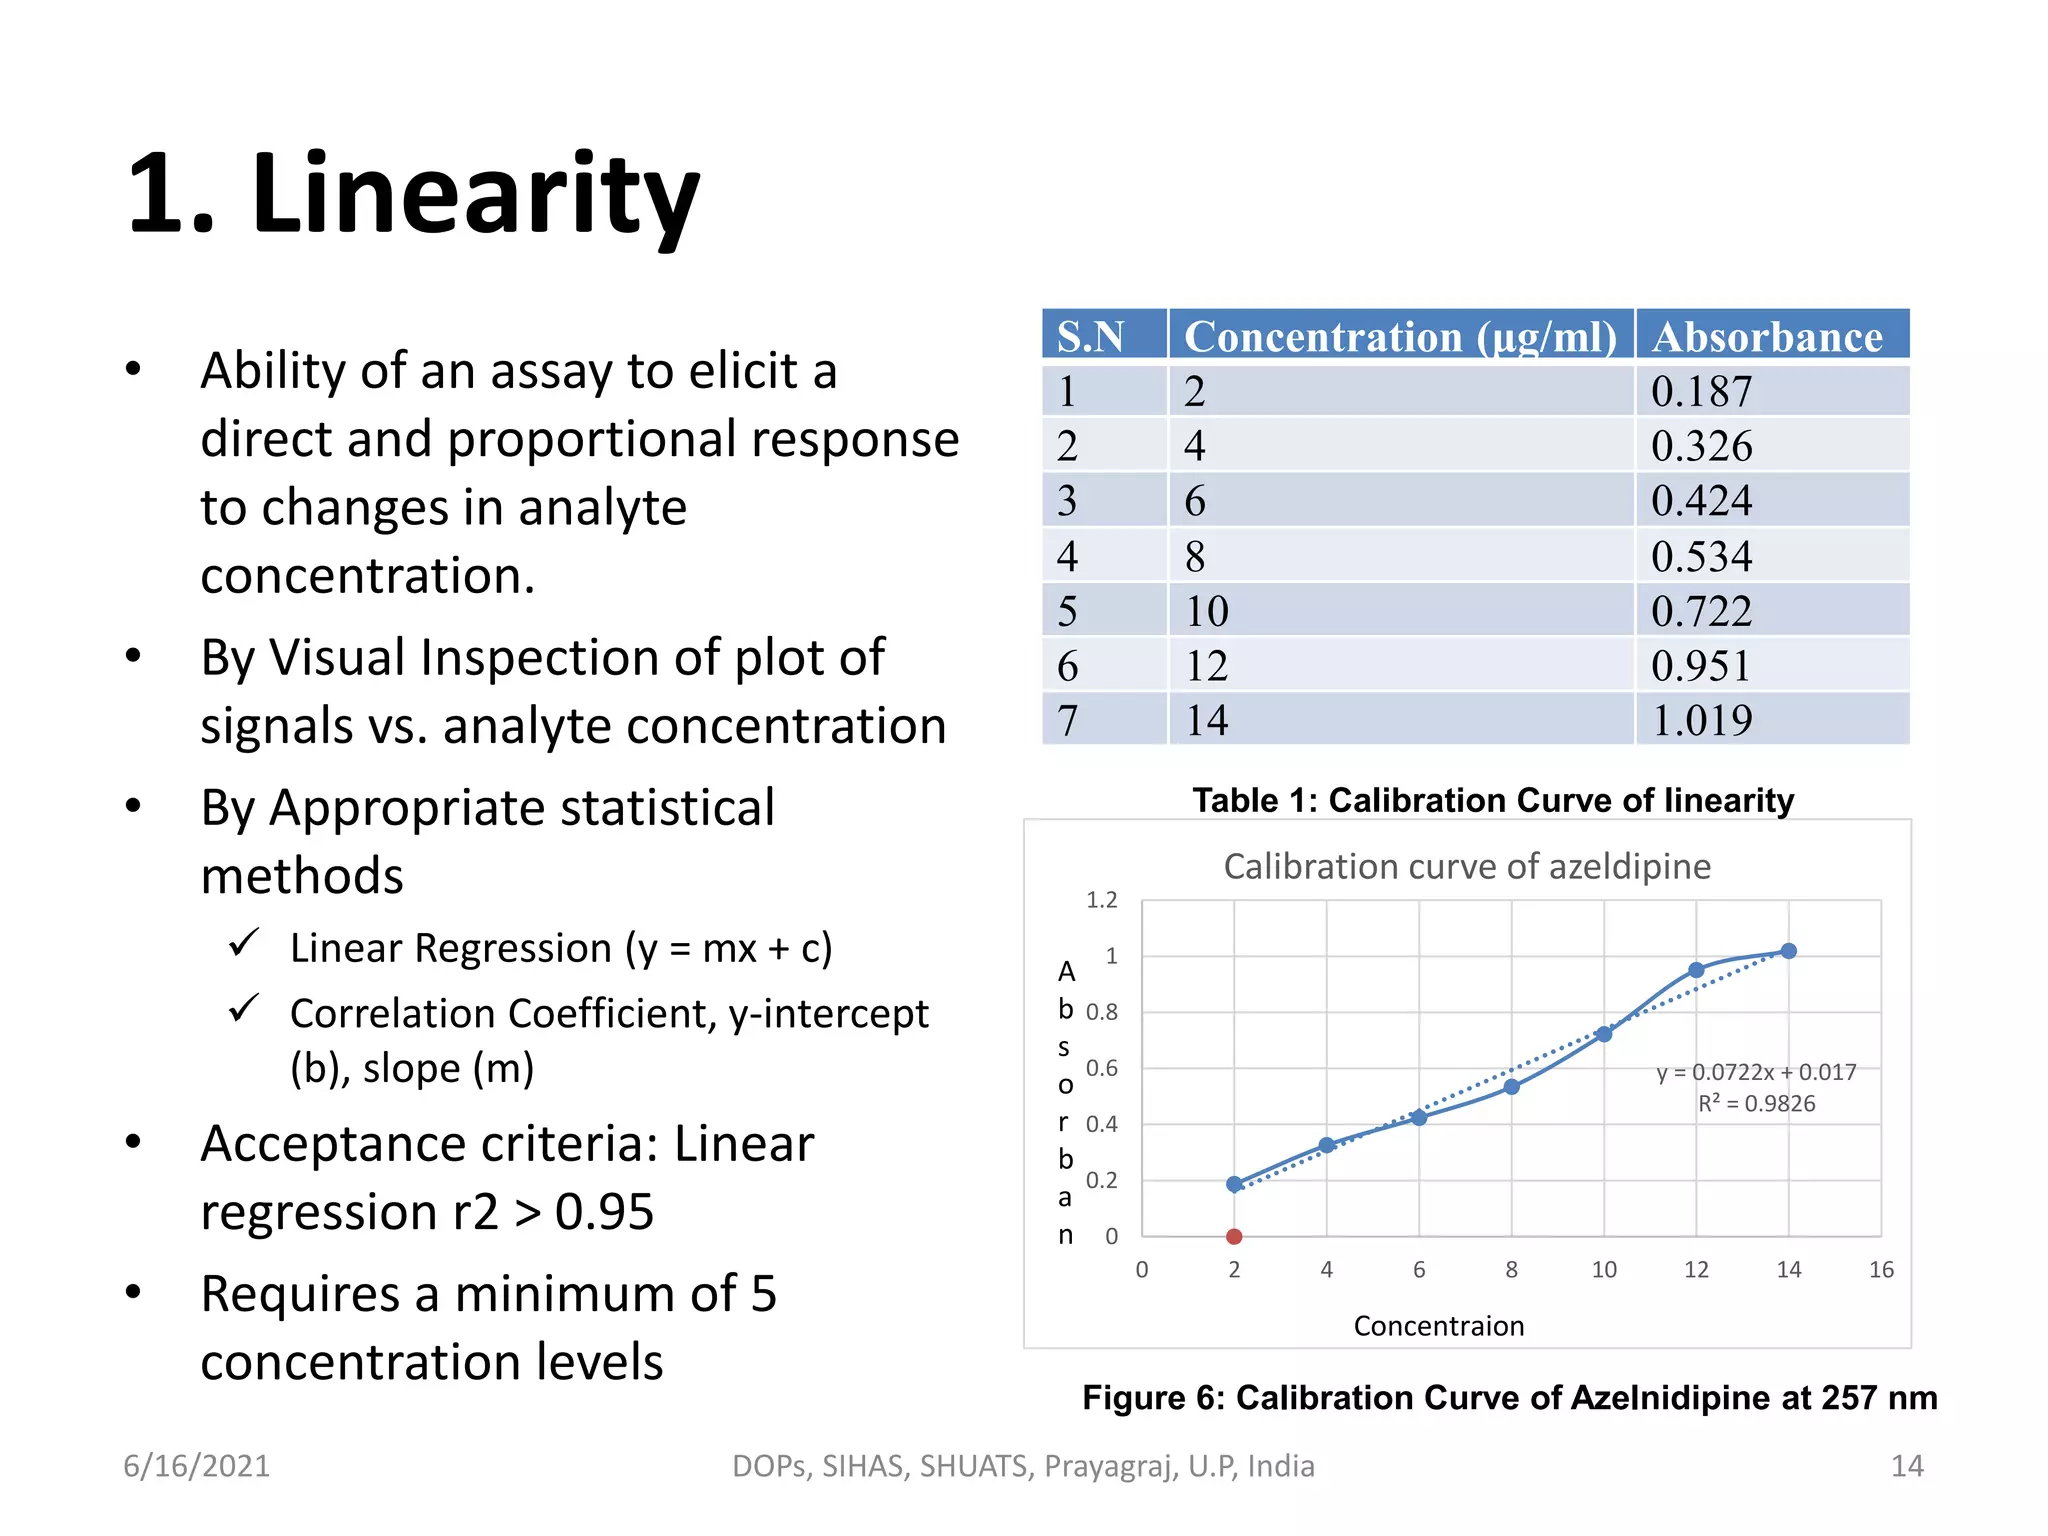
Explains the concept of linearity in assays, including acceptance criteria with concentration data.
Describes the significance of range in analysis and its derivation from linearity studies.
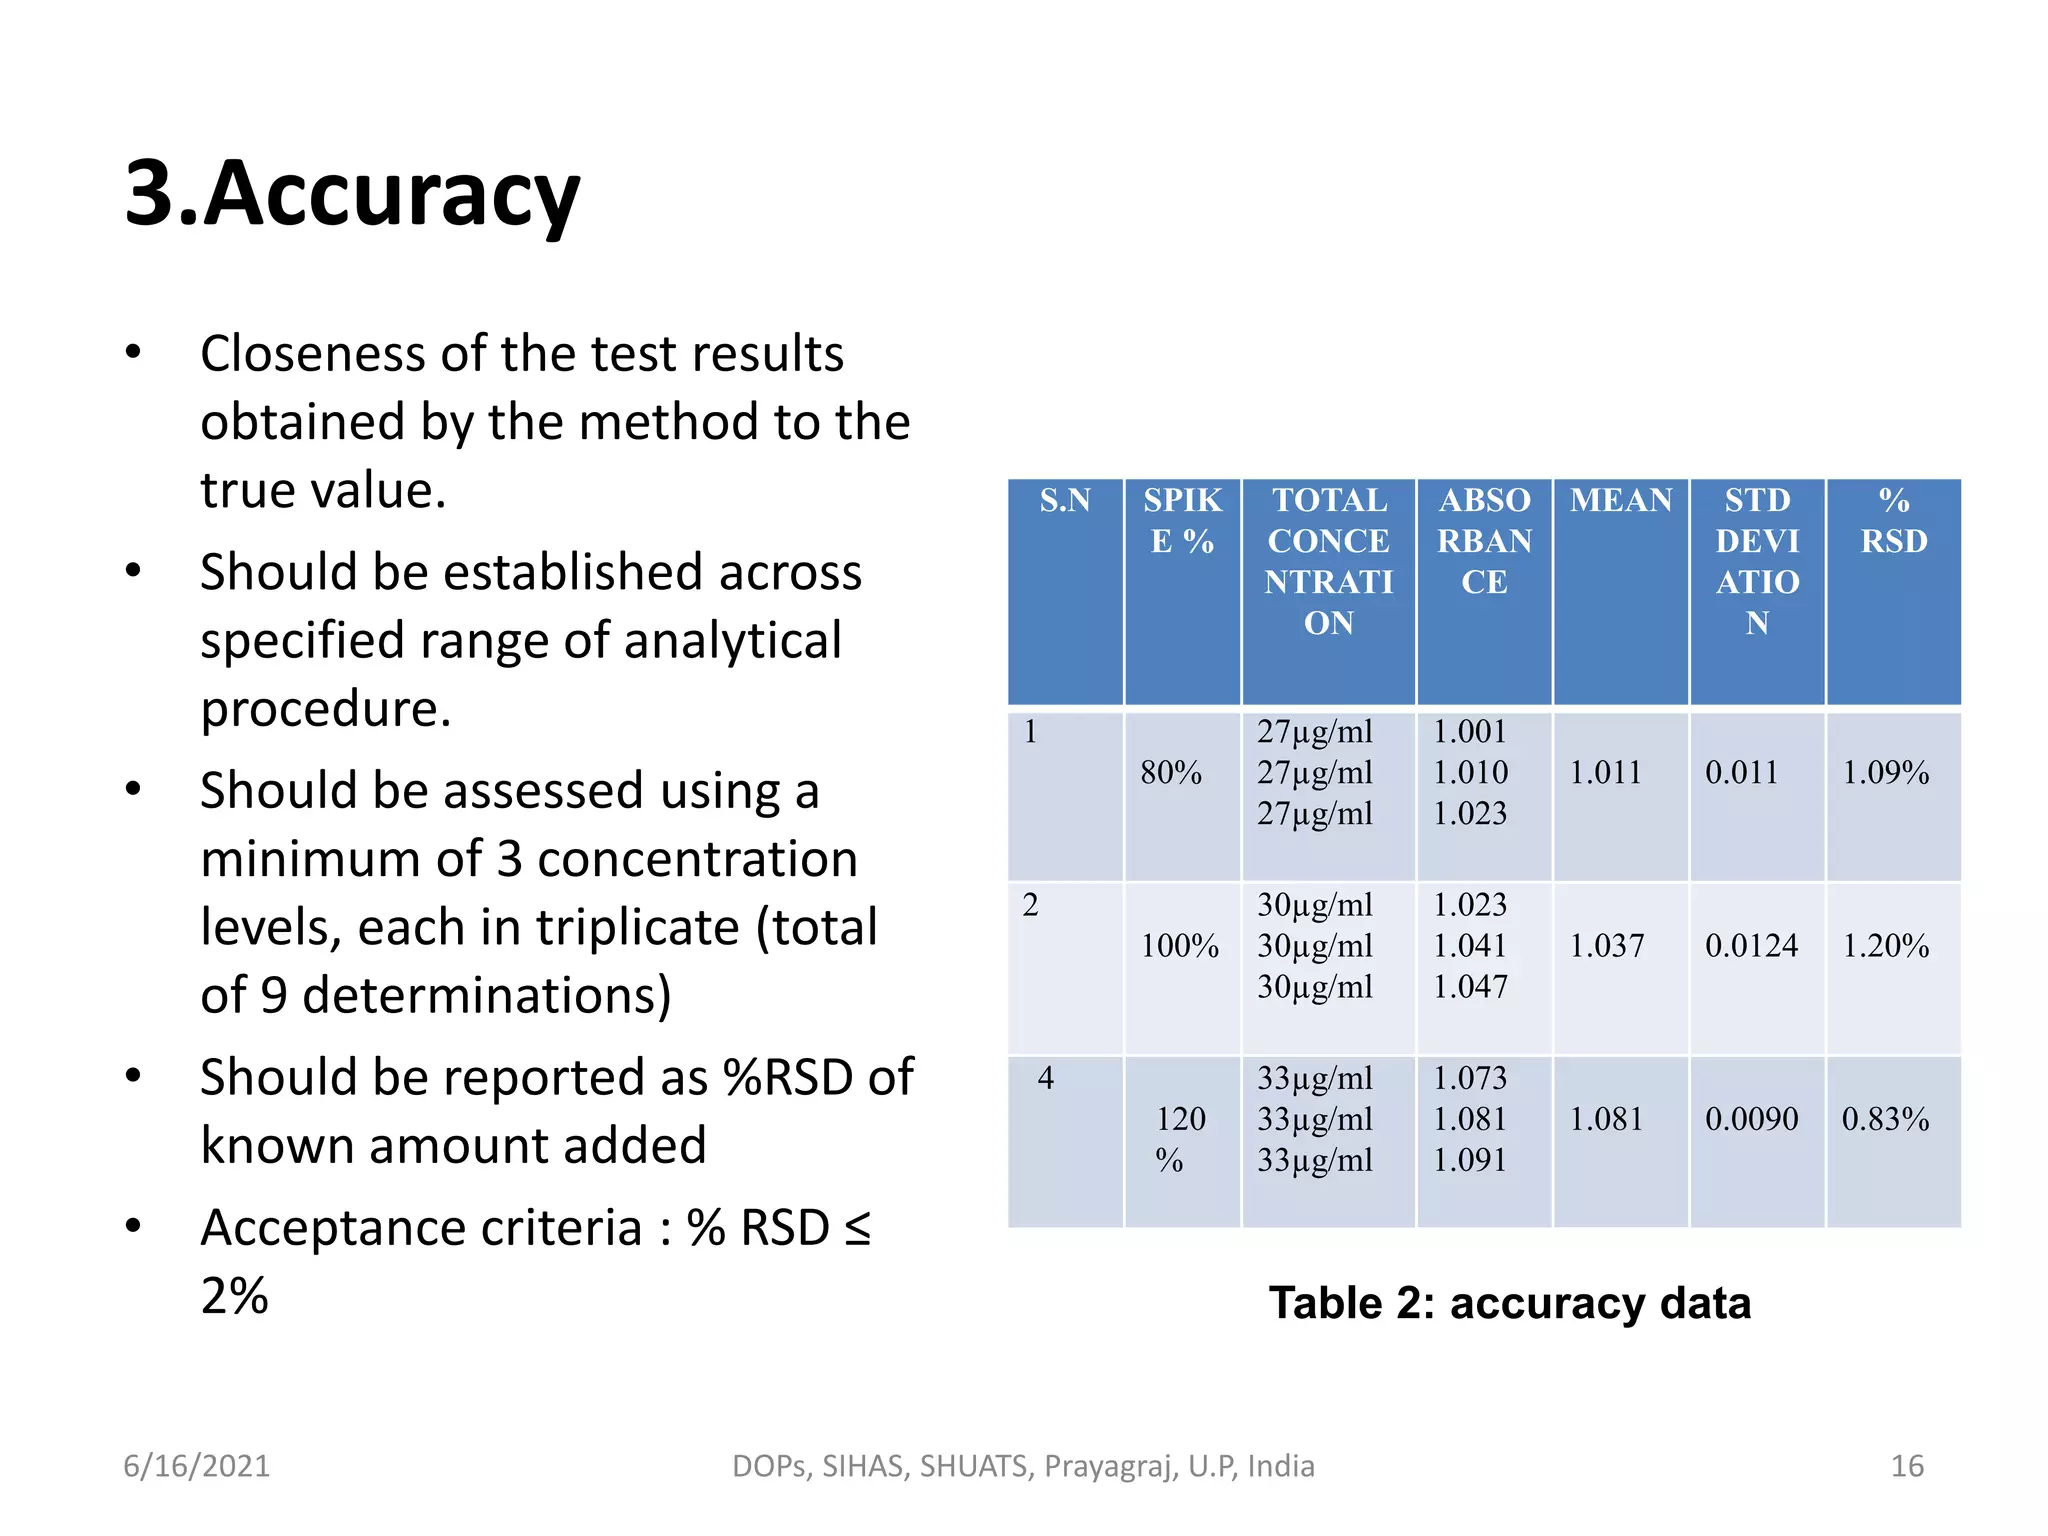
Defines accuracy in analysis and the method to assess it using predetermined concentration levels.
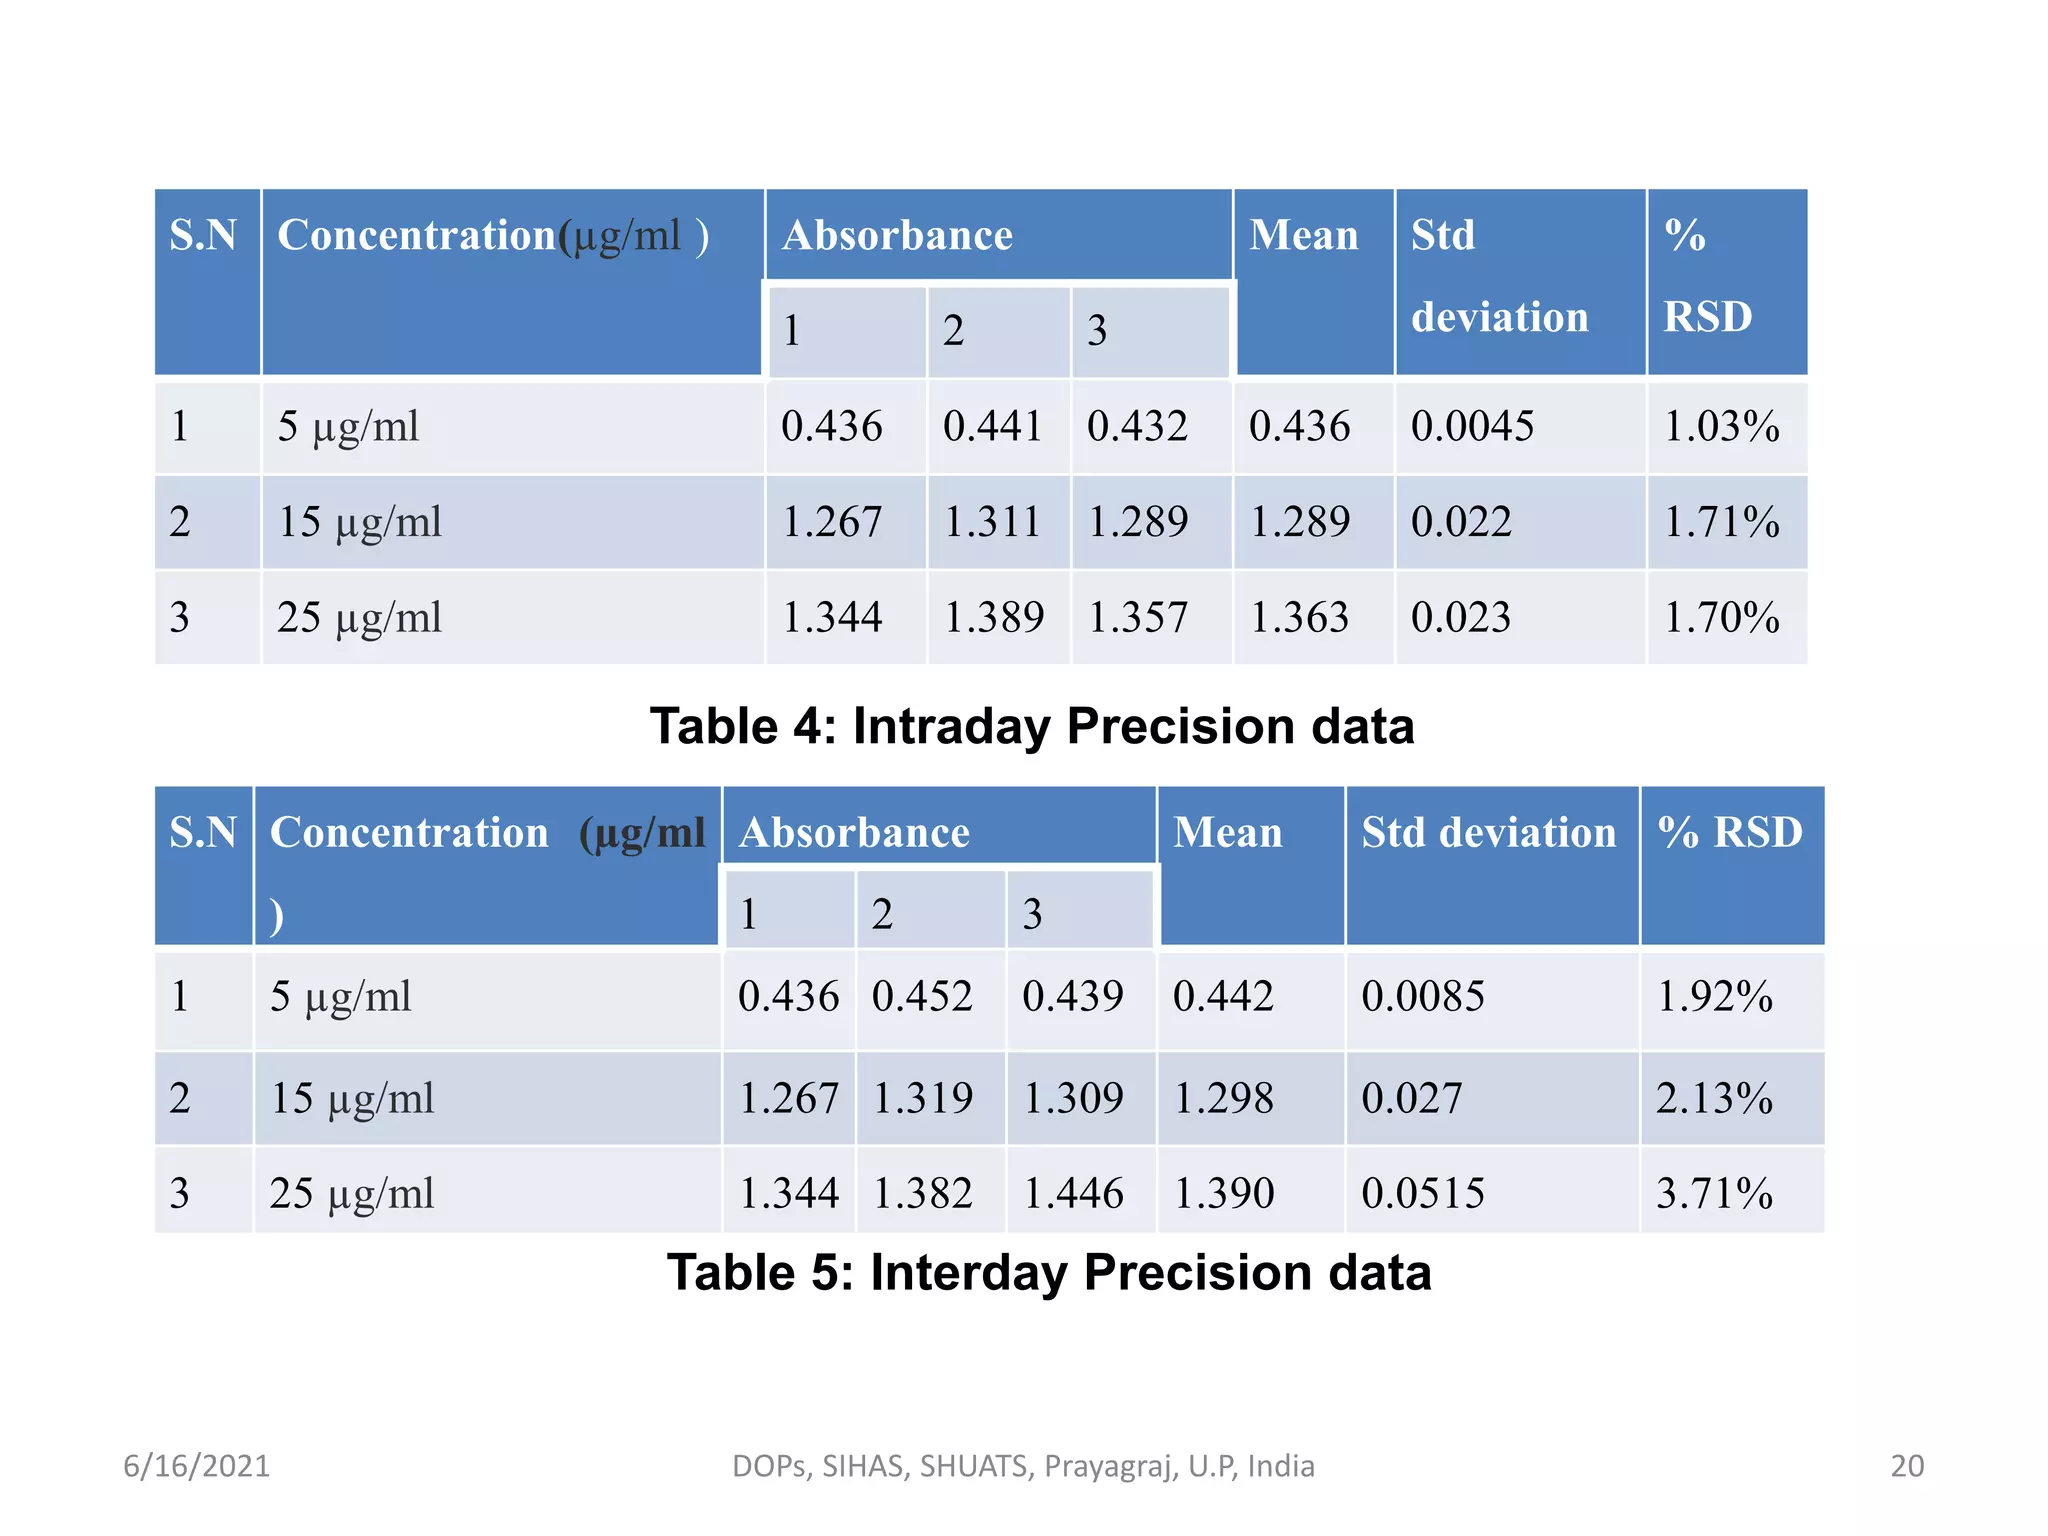
Discusses the concept of precision in measurement, detailing repeatability and intra/interday variation.
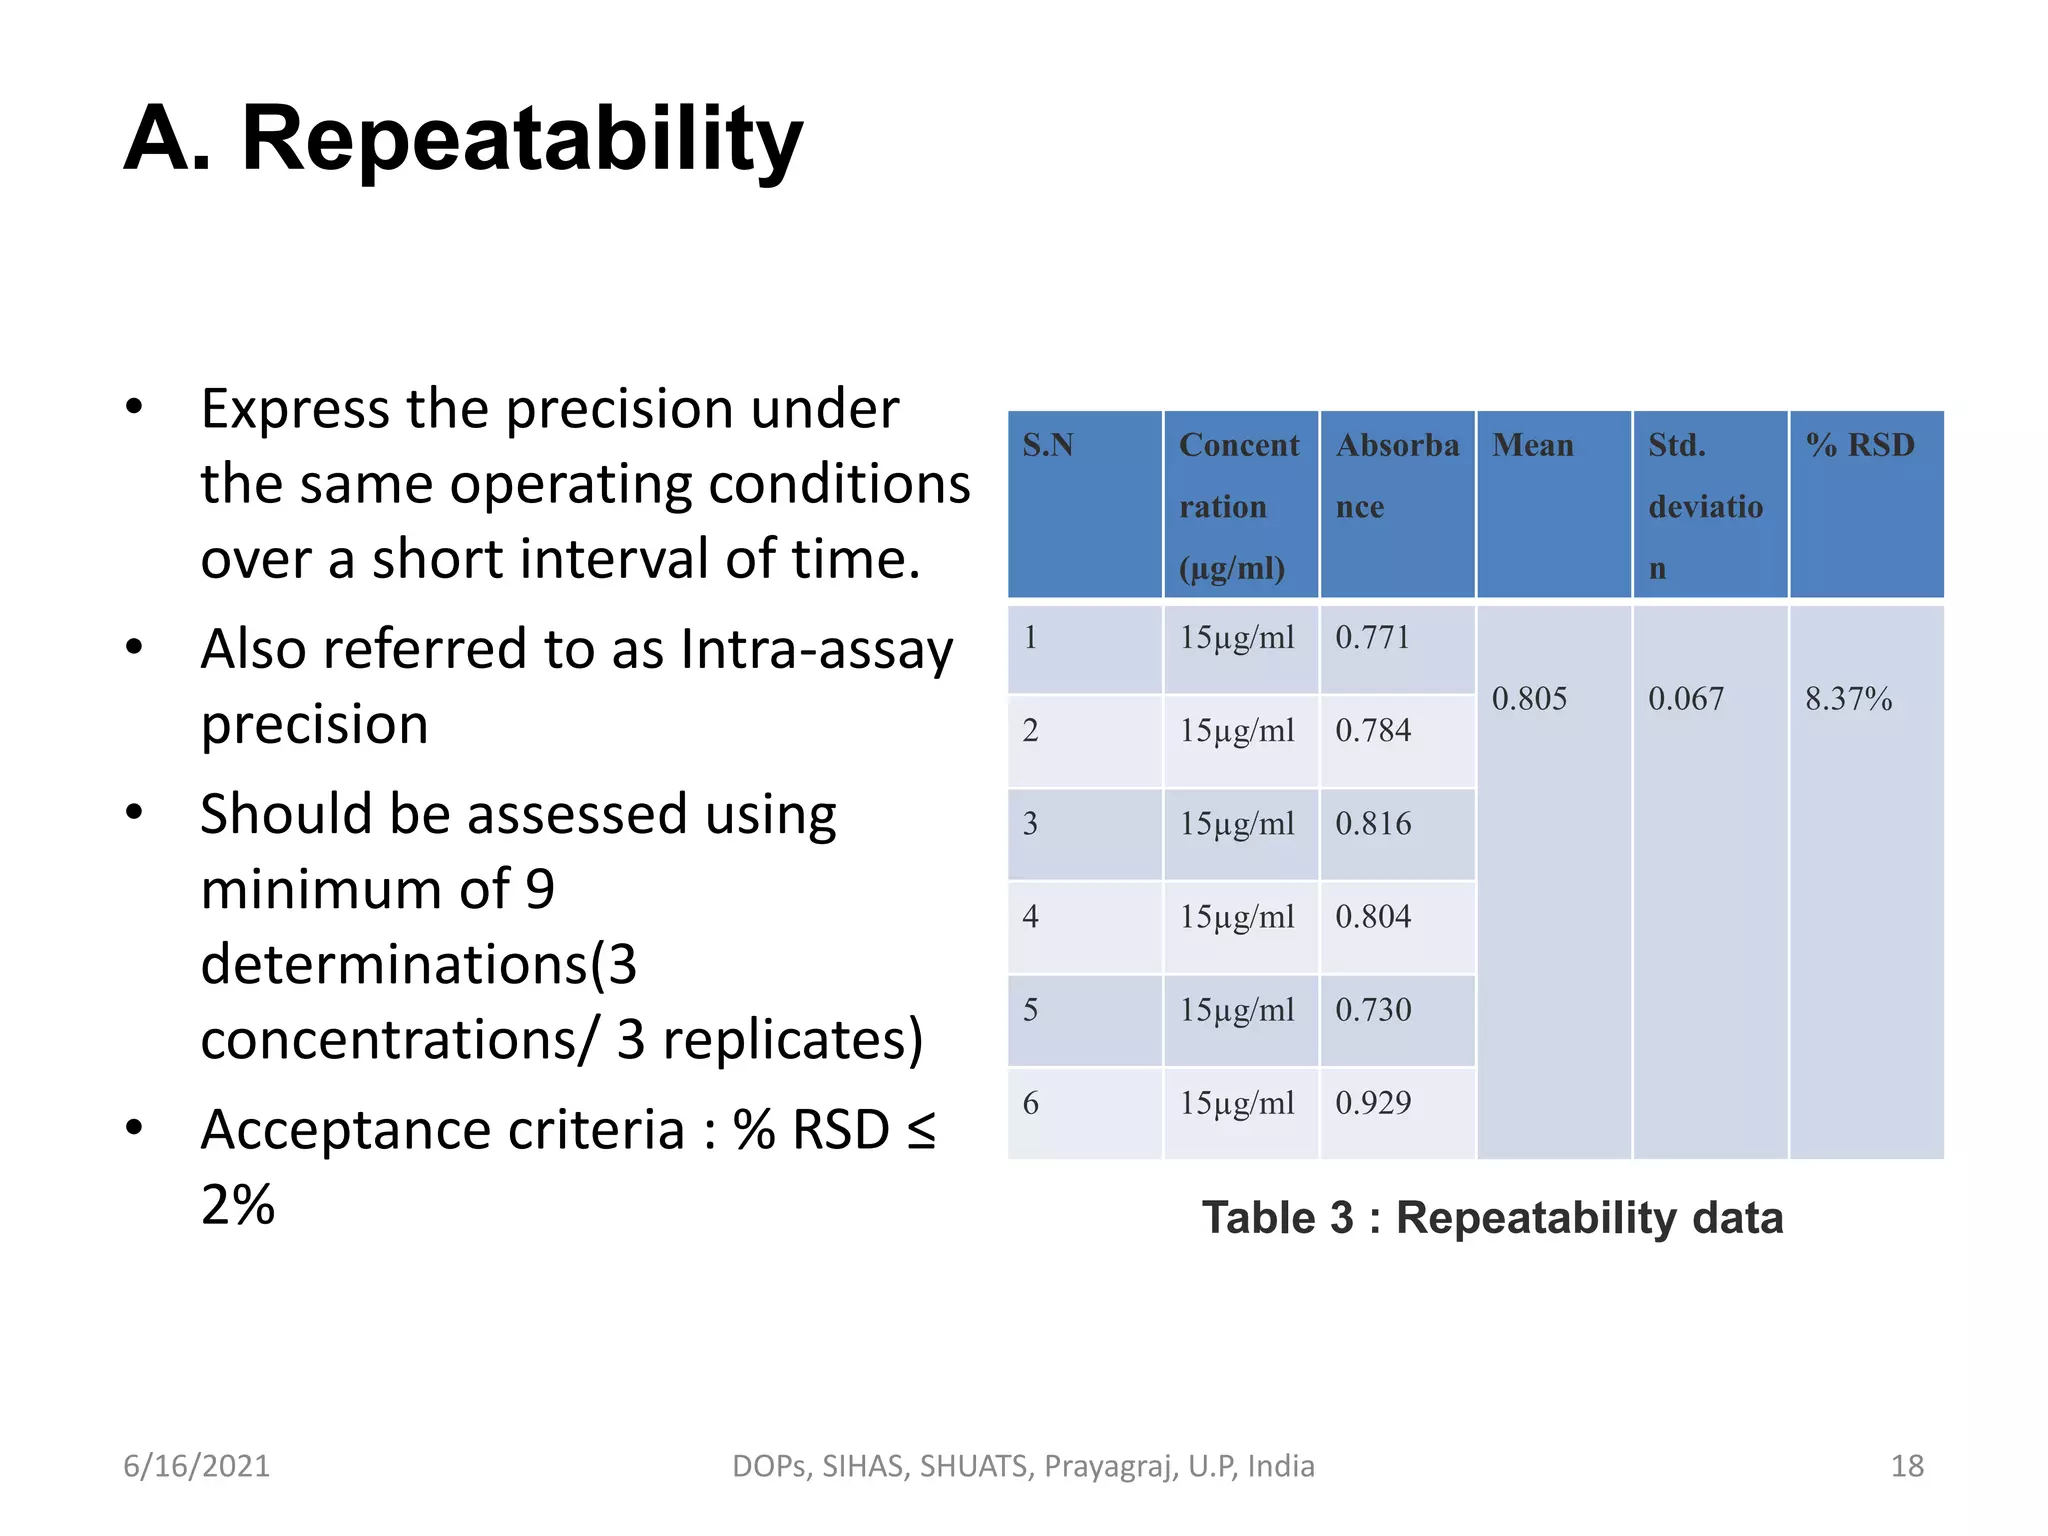
Information on the repeatability of measurements at identical conditions with provided concentration data.
Assesses intraday and interday precision in azelnidipine measurement and acceptance criteria.
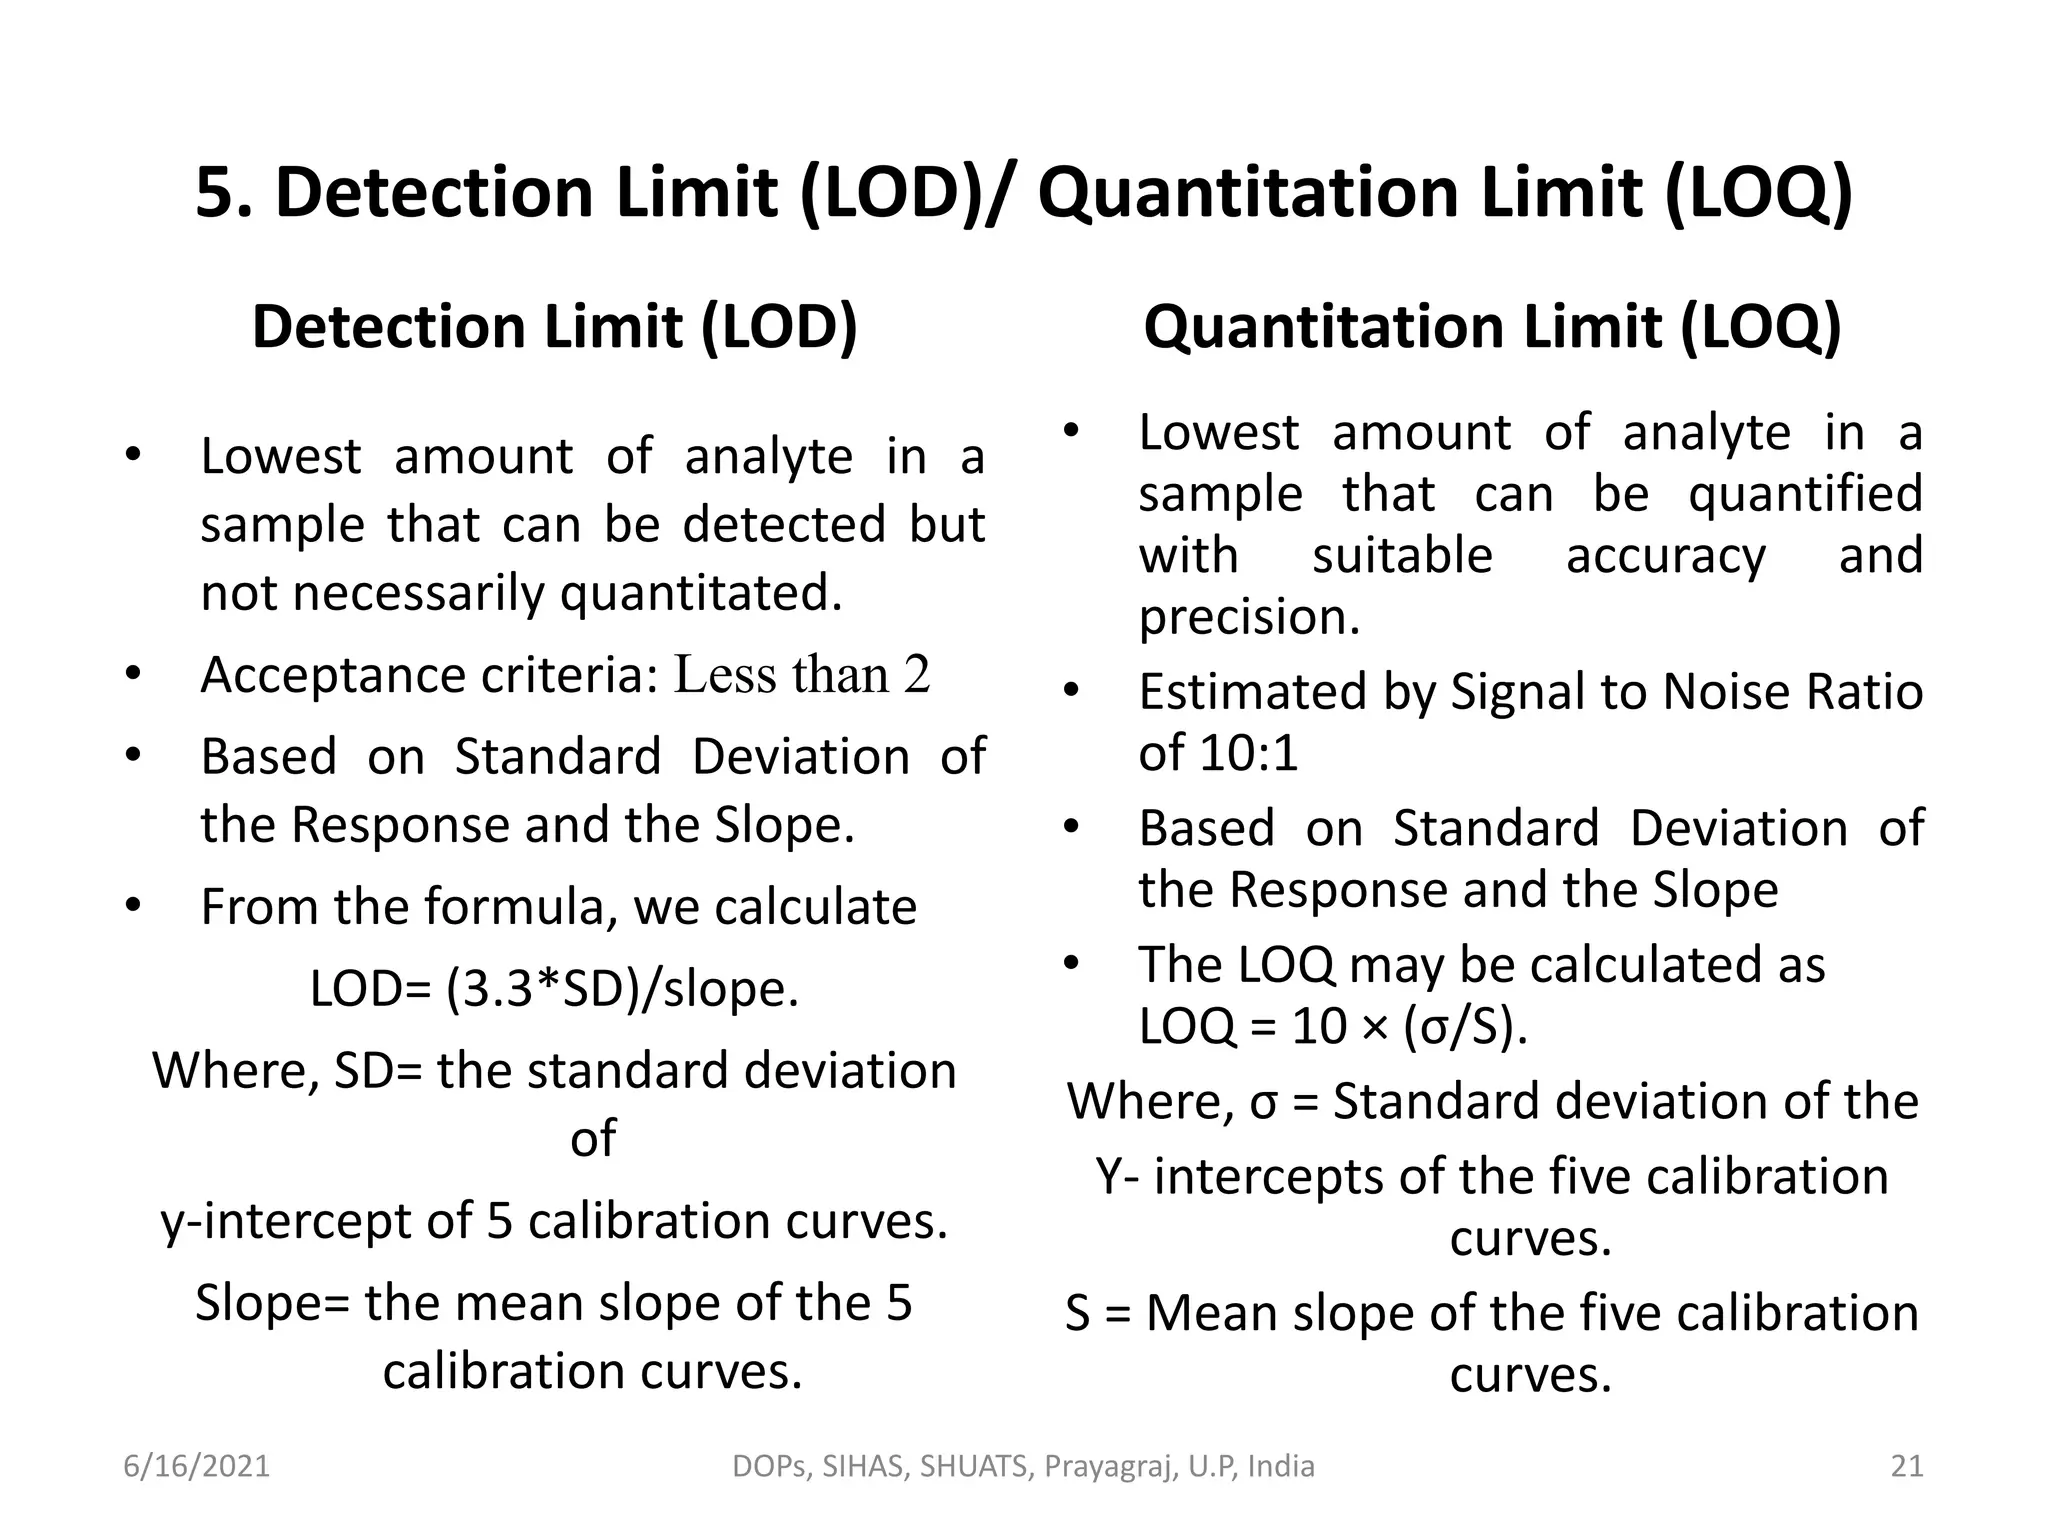
Defines Detection Limit (LOD) and Quantitation Limit (LOQ) with formulas for calculation.
Measures robustness through intentional variations in method parameters and their effects.
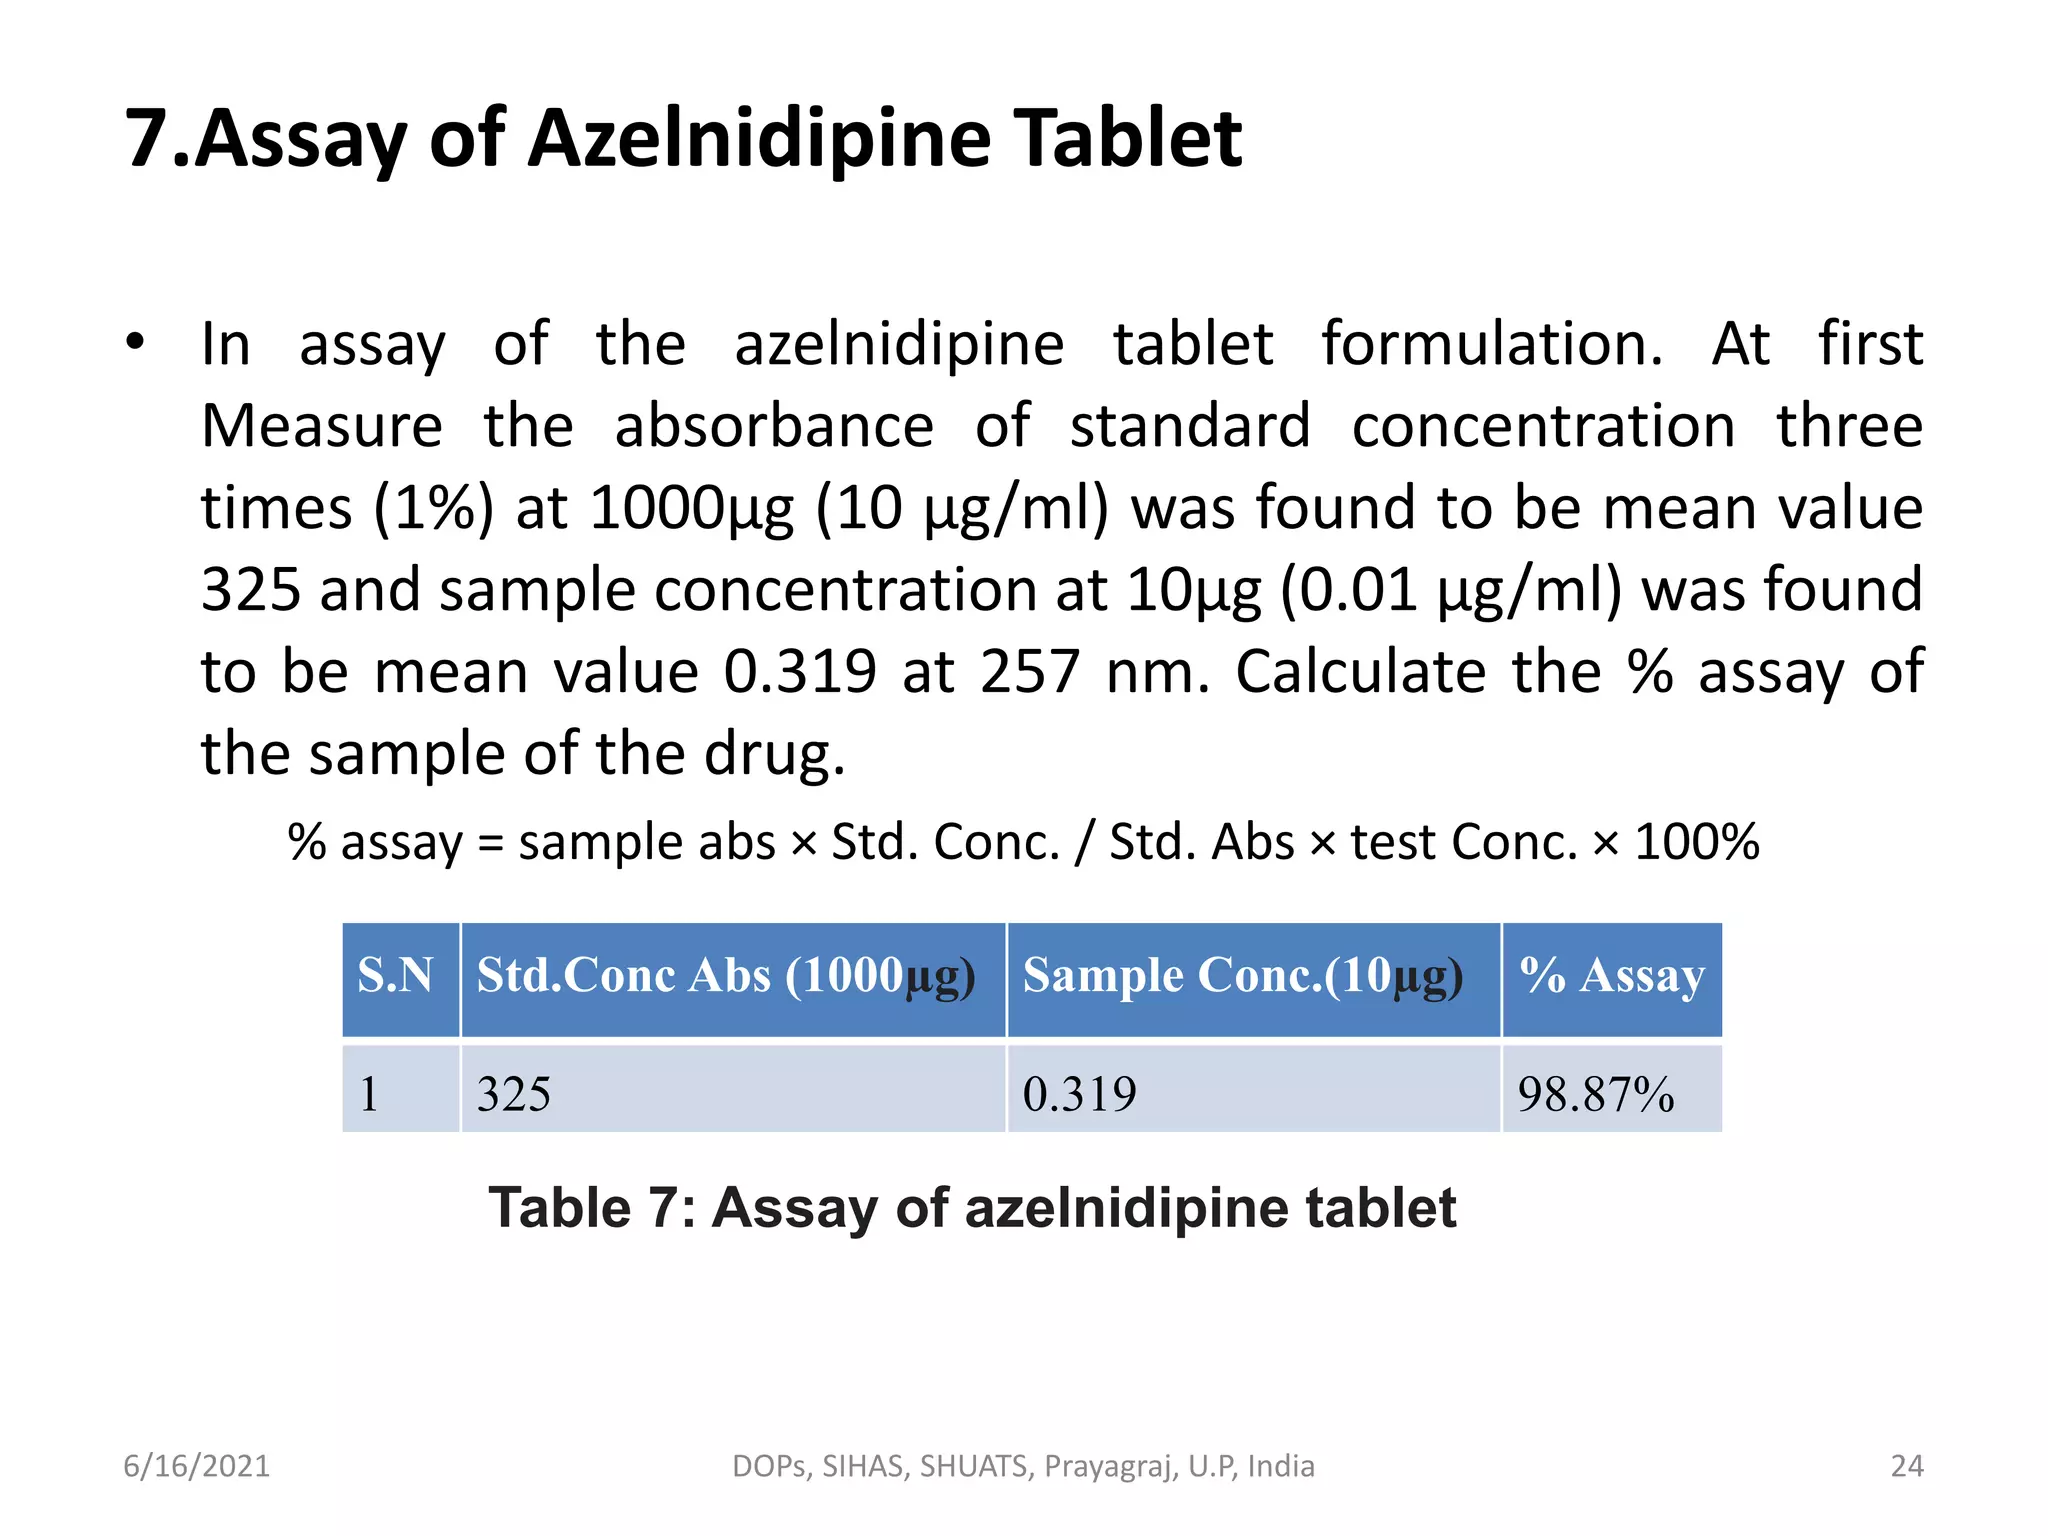
Result details from the assay of azelnidipine tablet formulations and calculating percent assay.
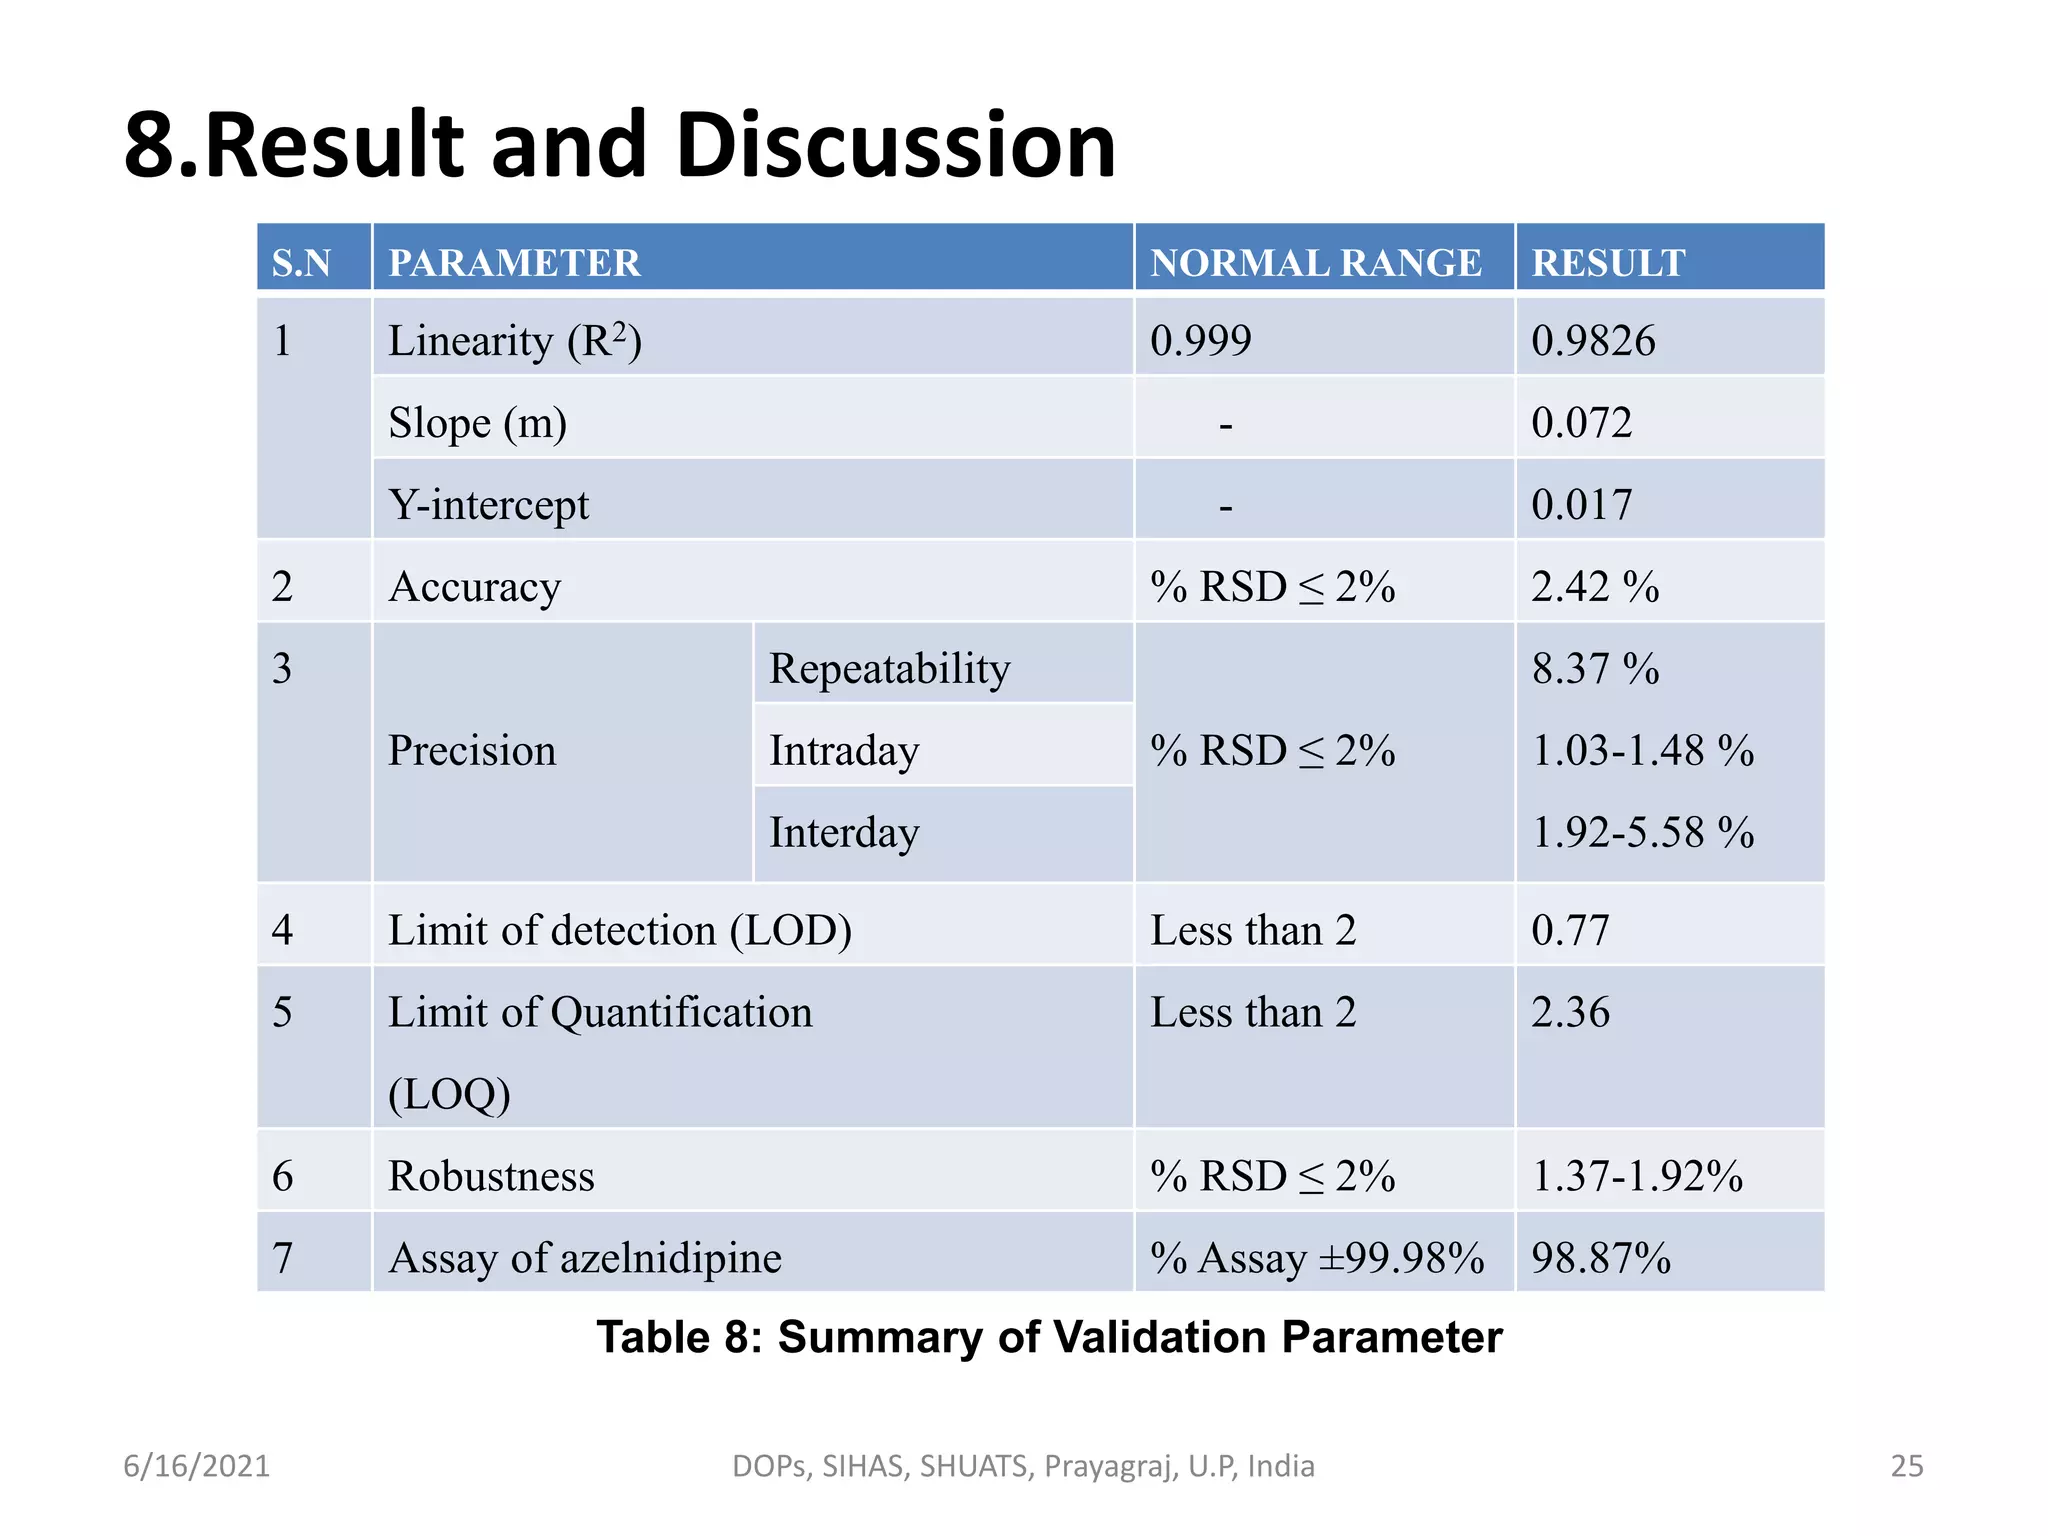
Summarizes results of validation parameters for the azelnidipine analysis according to standards.
Concludes the findings of method validation, highlighting its efficiency and areas needing improvement.
Final remarks on the method's detection limits and overall reliability in pharmaceutical estimation.
Cites various references that support the research and analysis presented throughout the slides.
Concludes the presentation and invites questions from the audience.