Downloaded 146 times


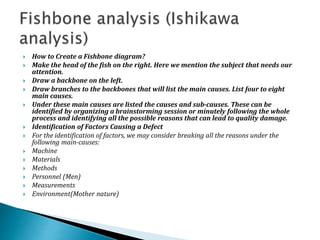


This document discusses out of specification (OOS) and out of trend (OOT) results in pharmaceutical manufacturing. It defines OOS as test results that fall outside specified limits in product specifications. OOT refers to results that fall outside a statistical prediction or fail process control criteria. The frequent occurrence of OOS and OOT indicates issues with manufacturing and analytical procedures. This can result in market complaints, batch rejections, and inventory losses. Root cause analysis tools like 5Why, fishbone diagrams, and fault tree analysis should be used to investigate OOS results and address the underlying causes in order to prevent future occurrences. Corrective and preventive actions then need to be implemented and their impact assessed.


