Download to read offline

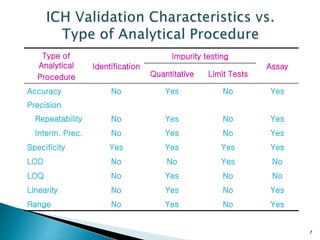
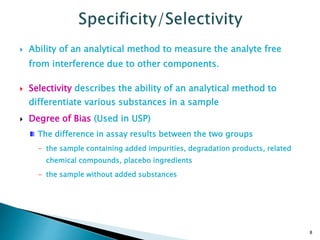

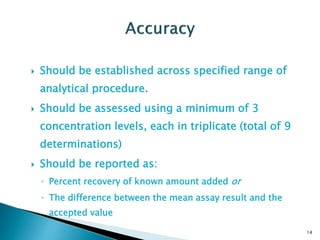


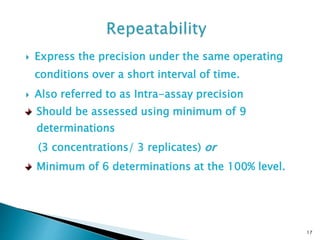
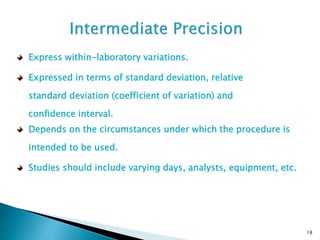
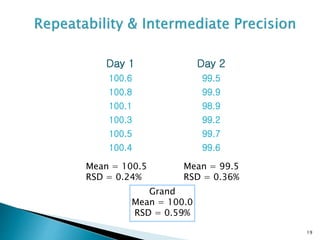


The document defines method validation and discusses its importance for developing confidence in analytical methods and meeting regulatory requirements. It describes when validation is necessary, such as for compendial or non-compendial methods. Key validation characteristics are discussed, including accuracy, precision, specificity, linearity, range, detection and quantification limits, and robustness. The document provides guidance on testing for these characteristics and establishing acceptance criteria to ensure analytical methods are suitable for their intended purposes.


![CASE_PRESENTATION_ON_subdural_hematoma(SDH)[1 FINAL PPT]-1.pptx](https://cdn.slidesharecdn.com/ss_thumbnails/casepresentationonsubduralhematomasdh1finalppt-1-260129172522-d405d375-thumbnail.jpg?width=640&height=640&fit=bounds)


