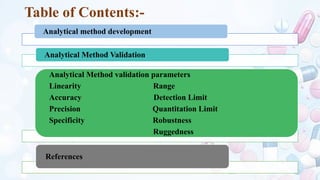
Table of Contents:-
Analyticalmethod development
Analytical Method Validation
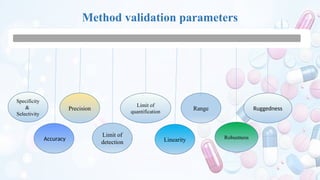
Analytical Method validation parameters
Linearity Range
Accuracy Detection Limit
Precision Quantitation Limit
Specificity Robustness
Ruggedness
References
3.
Analytical method developmentand validation
• Analytical method development and validation plays important role in
the Development, discovery, and manufacture of pharmaceuticals.
• Analytical method use to measure the concentration of an API in a
specific dosage form and later is validated to verify or prove that an
analytical procedure is accurately and consistently delivers a reliable
measurement of an ingredient in dosage form.
• Analytical method development- ICH Q14
• Analytical method validation- ICH Q2(R1)
4.
The purpose ofan analytical method
development
• The use of analytical methods during drug development and
manufacturing provides information on:
1. Potency, which can relate directly to the requirement of a known
dose.
2. Impurities, which can relate to the safety profile of the drug.
3. Evaluation of key drug characteristics such as crystal form, drug
release, and drug uniformity, properties which can compromise
bioavailability.
4. Degradation products, methods need to be stability indicating.
5.
Analytical Method Validation
Validationis "Establishing documented evidence that provides a high degree of assurance that
a
specific process will consistently produce a product meeting its pre-determined specifications
and quality attributes.
Types of analytical procedures to be validated
Identification tests
Quantitative tests for impurities content
Limit tests for the control of impurities
Quantitative tests of the active moiety in samples of drug
substance or drug product or other selected components
in the drug product
Linearity
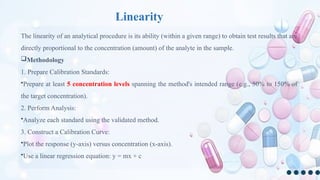
The linearity ofan analytical procedure is its ability (within a given range) to obtain test results that are
directly proportional to the concentration (amount) of the analyte in the sample.
Methodology
1. Prepare Calibration Standards:
•Prepare at least 5 concentration levels spanning the method's intended range (e.g., 50% to 150% of
the target concentration).
2. Perform Analysis:
•Analyze each standard using the validated method.
3. Construct a Calibration Curve:
•Plot the response (y-axis) versus concentration (x-axis).
•Use a linear regression equation: y = mx + c
10.
y: Response
x: Concentration
m:Slope
c: Intercept
4.Evaluate the Linearity:
• Calculate the correlation coefficient (r) or coefficient of determination ().
Acceptable : ≥ 0.99
• Data from the regression line itself may be helpful to provide mathematical
estimates of the degree of linearity.
11.
Accuracy
The accuracy ofan analytical procedure expresses the closeness of agreement
between the value which is accepted either as a conventional true value or an
accepted reference value and the value found.
This is sometimes termed trueness.
Methodology
1.Sample Preparation:
Spike known quantities of the analyte into a blank matrix (e.g., placebo, solvent,
excipients). Prepare samples at 50%, 100%, and 150% of the target concentration.
2.Replicates:
Perform at least 3 replicates per concentration level.
3.Analytical Testing:
Use the validated method to analyze the samples under consistent conditions.
12.
4.Recovery Calculation:
Recovery (%)=(MeasuredValue/True Value)×100
5.Evaluation Criteria:
Assay methods: 98%–102% recovery.
Impurities: 90%–110%.
6.Statistical Analysis:
Calculate mean, SD, and RSD:
RSD (%)=(SD/Mean)×100
Recommended Data Accuracy should be assessed using a minimum of 9 determinations over a minimum of 3
concentration levels covering the specified range (e.g., 3 concentrations/3 replicates each of the total
analytical procedure).
13.
Precision
The precision ofan analytical procedure expresses the closeness of agreement (degree of scatter) between a series of
measurements obtained from multiple sampling of the same homogeneous sample under the prescribed conditions.
Methodology
Repeatability/intra day precision
It evaluates the precision of the analytical method under the same operating conditions over a short time interval.
1.Sample Preparation:
1.Prepare a single homogeneous batch of the sample or standard solution.
2.Perform at least 6 independent determinations at 100% of the test concentration.
2.Analytical Procedure:
1.Analyze the replicates using the same equipment, analyst, and laboratory conditions.
2.Collect the results as a series of measurements (e.g., peak area, concentration).
3.Statistical Analysis:
1.Calculate the mean, standard deviation (SD), and relative standard deviation (RSD) using the formula:
RSD (%)=(SD/Mean)×100
14.
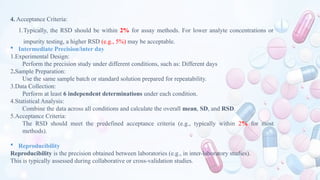
4. Acceptance Criteria:
1.Typically,the RSD should be within 2% for assay methods. For lower analyte concentrations or
impurity testing, a higher RSD (e.g., 5%) may be acceptable.
Intermediate Precision/inter day
1.Experimental Design:
Perform the precision study under different conditions, such as: Different days
2.Sample Preparation:
Use the same sample batch or standard solution prepared for repeatability.
3.Data Collection:
Perform at least 6 independent determinations under each condition.
4.Statistical Analysis:
Combine the data across all conditions and calculate the overall mean, SD, and RSD.
5.Acceptance Criteria:
The RSD should meet the predefined acceptance criteria (e.g., typically within 2% for most
methods).
Reproducibility
Reproducibility is the precision obtained between laboratories (e.g., in inter-laboratory studies).
This is typically assessed during collaborative or cross-validation studies.
15.
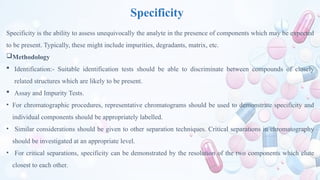
Specificity
Specificity is theability to assess unequivocally the analyte in the presence of components which may be expected
to be present. Typically, these might include impurities, degradants, matrix, etc.
Methodology
Identification:- Suitable identification tests should be able to discriminate between compounds of closely
related structures which are likely to be present.
Assay and Impurity Tests.
• For chromatographic procedures, representative chromatograms should be used to demonstrate specificity and
individual components should be appropriately labelled.
• Similar considerations should be given to other separation techniques. Critical separations in chromatography
should be investigated at an appropriate level.
• For critical separations, specificity can be demonstrated by the resolution of the two components which elute
closest to each other.
16.
• In caseswhere a non-specific assay is used, other supporting analytical procedures should be used to
demonstrate overall specificity.
17.
Range
The range ofan analytical procedure is the interval between the upper and lower concentration (amounts) of
analyte in the sample (including these concentrations) for which it has been demonstrated that the analytical
procedure has a suitable level of precision, accuracy and linearity.
Methodology
Range is established by confirming that the analytical procedure provides an acceptable degree of linearity,
accuracy and precision when applied to samples containing amounts of analyte within or at the extremes of
the specified range of the analytical procedure.
The following minimum specified ranges should be considered:
- for the assay of a drug substance or a finished (drug) product: normally from 80 to 120 % of the test
concentration;
18.
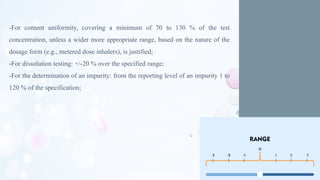
-For content uniformity,covering a minimum of 70 to 130 % of the test
concentration, unless a wider more appropriate range, based on the nature of the
dosage form (e.g., metered dose inhalers), is justified;
-For dissolution testing: +/-20 % over the specified range;
-For the determination of an impurity: from the reporting level of an impurity 1 to
120 % of the specification;
19.
Detection Limit
The detectionlimit of an individual analytical procedure is the lowest amount of analyte in a sample which
can be detected but not necessarily quantitated as an exact value.
Methodology
Based on Visual Evaluation
Based on Signal-to-Noise
A signal-to-noise ratio between 3 or 2:1 is generally considered acceptable for estimating the detection limit.
Based on the Standard Deviation of the Response and the Slope
LOD = 3.3 σ/S
where ,
σ = the standard deviation of the response
S = the slope of the calibration curve
The slope S may be estimated from the calibration curve of the analyte.
20.
The quantitation limitof an individual analytical procedure is the lowest amount of analyte in a sample which
can be quantitatively determined with suitable precision and accuracy. The quantitation limit is a parameter of
quantitative assays for low levels of compounds in sample matrices, and is used particularly for the
determination of impurities and/or degradation products.
Methdology:
Based on Visual Evaluation
Based on Signal-to-Noise Approach - A typical signal-to-noise ratio is 10:1
Based on the Standard Deviation of the Response and the Slope
The quantitation limit (QL) may be expressed as:
QL = 10 σ / S
where σ = the standard deviation of the response
S = the slope of the calibration curve
The slope S may be estimated from the calibration curve of the analyte.
Quantitation Limit
21.
Robustness
The robustness ofan analytical procedure is a measure of its capacity to remain unaffected by small, but
deliberate variations in method parameters and provides an indication of its reliability during normal usage.
Methodology
The evaluation of robustness should be considered during the development phase and depends on the type of
procedure under study. It should show the reliability of an analysis with respect to deliberate variations in
method parameters.
If measurements are susceptible to variations in analytical conditions, the analytical conditions should be
suitably controlled or a precautionary statement should be included in the procedure.
One consequence of the evaluation of robustness should be that a series of system suitability parameters
(e.g., resolution test) is established to ensure that the validity of the analytical procedure is maintained
whenever used.
Examples of typical variations are:
stability of analytical solutions.
22.
In thecase of liquid chromatography ,examples of typical variations are:
Influence of variations of pH in a mobile phase; mobile phase composition;
Different columns (different lots and/or suppliers);
Temperature
Flow rate.
In the case of gas-chromatography, examples of typical variations are:
Different columns (different lots and/or suppliers);
Temperature
Flow rate.
23.
Ruggedness
Ruggedness is definedas of reproducibility of test result obtained by the analysis of the same
samples under a variety of conditions, such as different laboratories, analysts, instruments, reagent
lots.
24.
References
1.ICH Q2R1, Validationof Analytical Procedures: Text and Methodology, ICH Harmonized
Tripartite Guideline, November 2005, IFPMA, Geneva, Switzerland.
#19 The Signal-to-Noise Detection Limit often refers to the ability to distinguish a true signal from the background noise in a measurement. This concept is widely used in fields like spectroscopy, signal processing, and data analysis
The Visual Evaluation, process of assessing the performance of an analytical procedure by visually examining a graphical representation of the data.
Linearity:
Is the data forming a straight line?
Are there deviations at higher or lower concentrations?
#20 calibration curve is a plot of the instrument's response (e.g., absorbance, peak area) on the y-axis versus the concentration of the analyte on the x-axis. It is usually a straight line for linear methods
y=mx+b