METHOD VALIDATION
It isset of parameters/process used to confirm that
the analytical procedure employed for a specific test
is suitable for its intended use.
Generation of data
Well defined & fully validated
Method does- intended to do
Quantitative measurement
Reliable and reproducible
3.
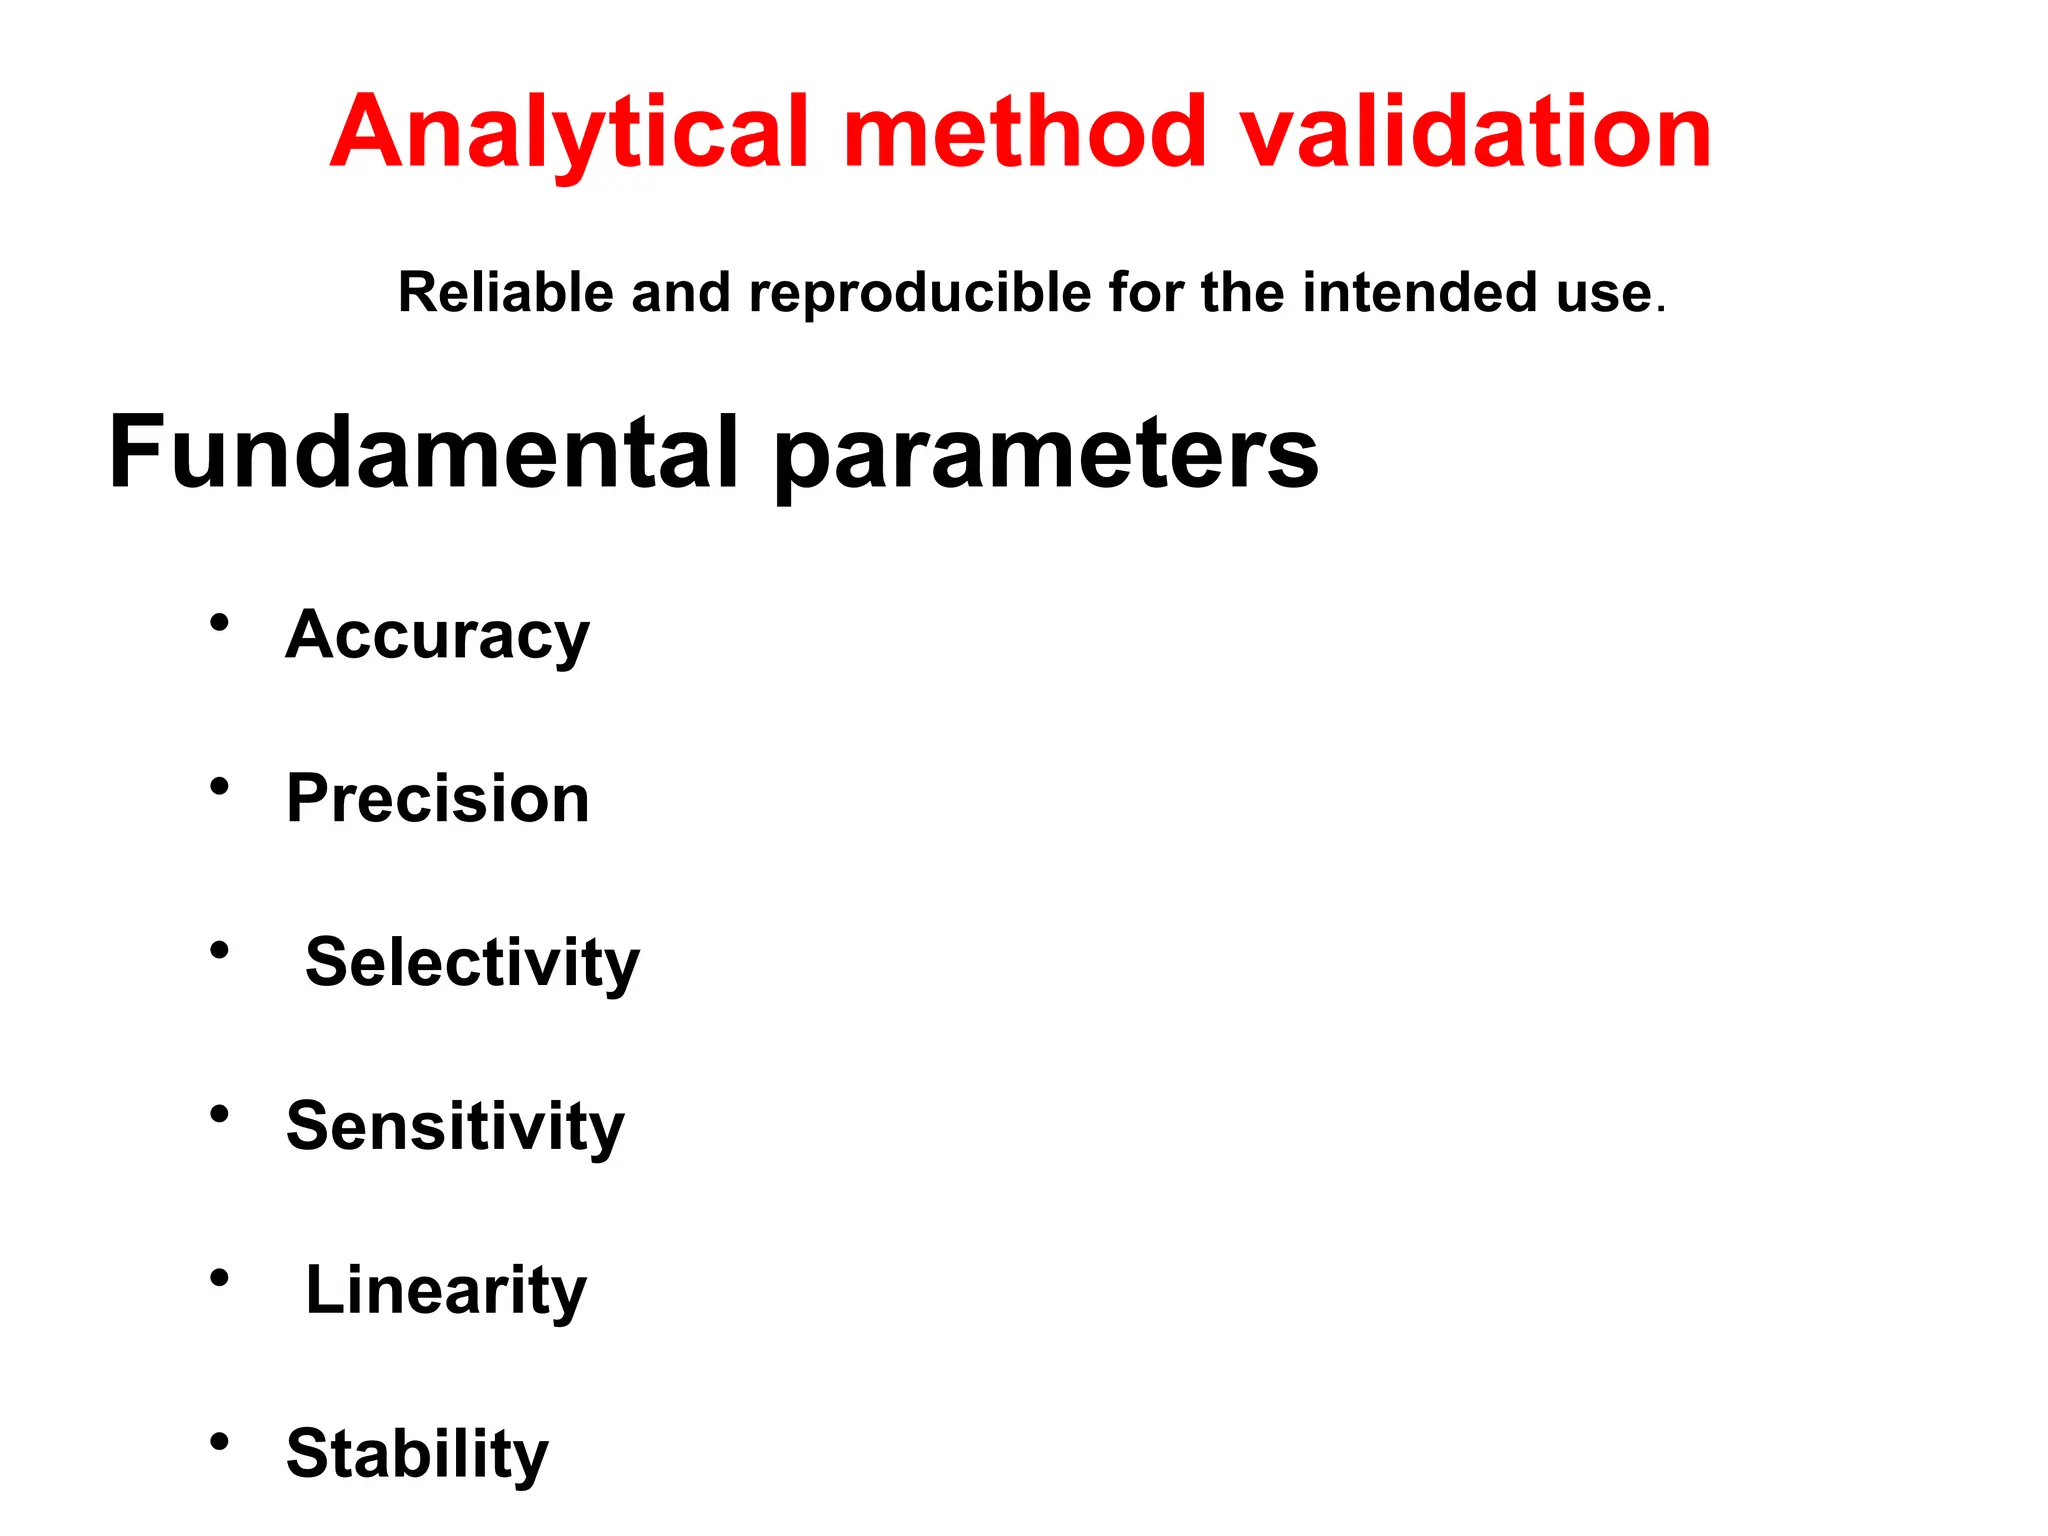
Analytical method validation
Reliableand reproducible for the intended use.
Fundamental parameters
• Accuracy
• Precision
• Selectivity
• Sensitivity
• Linearity
• Stability
4.
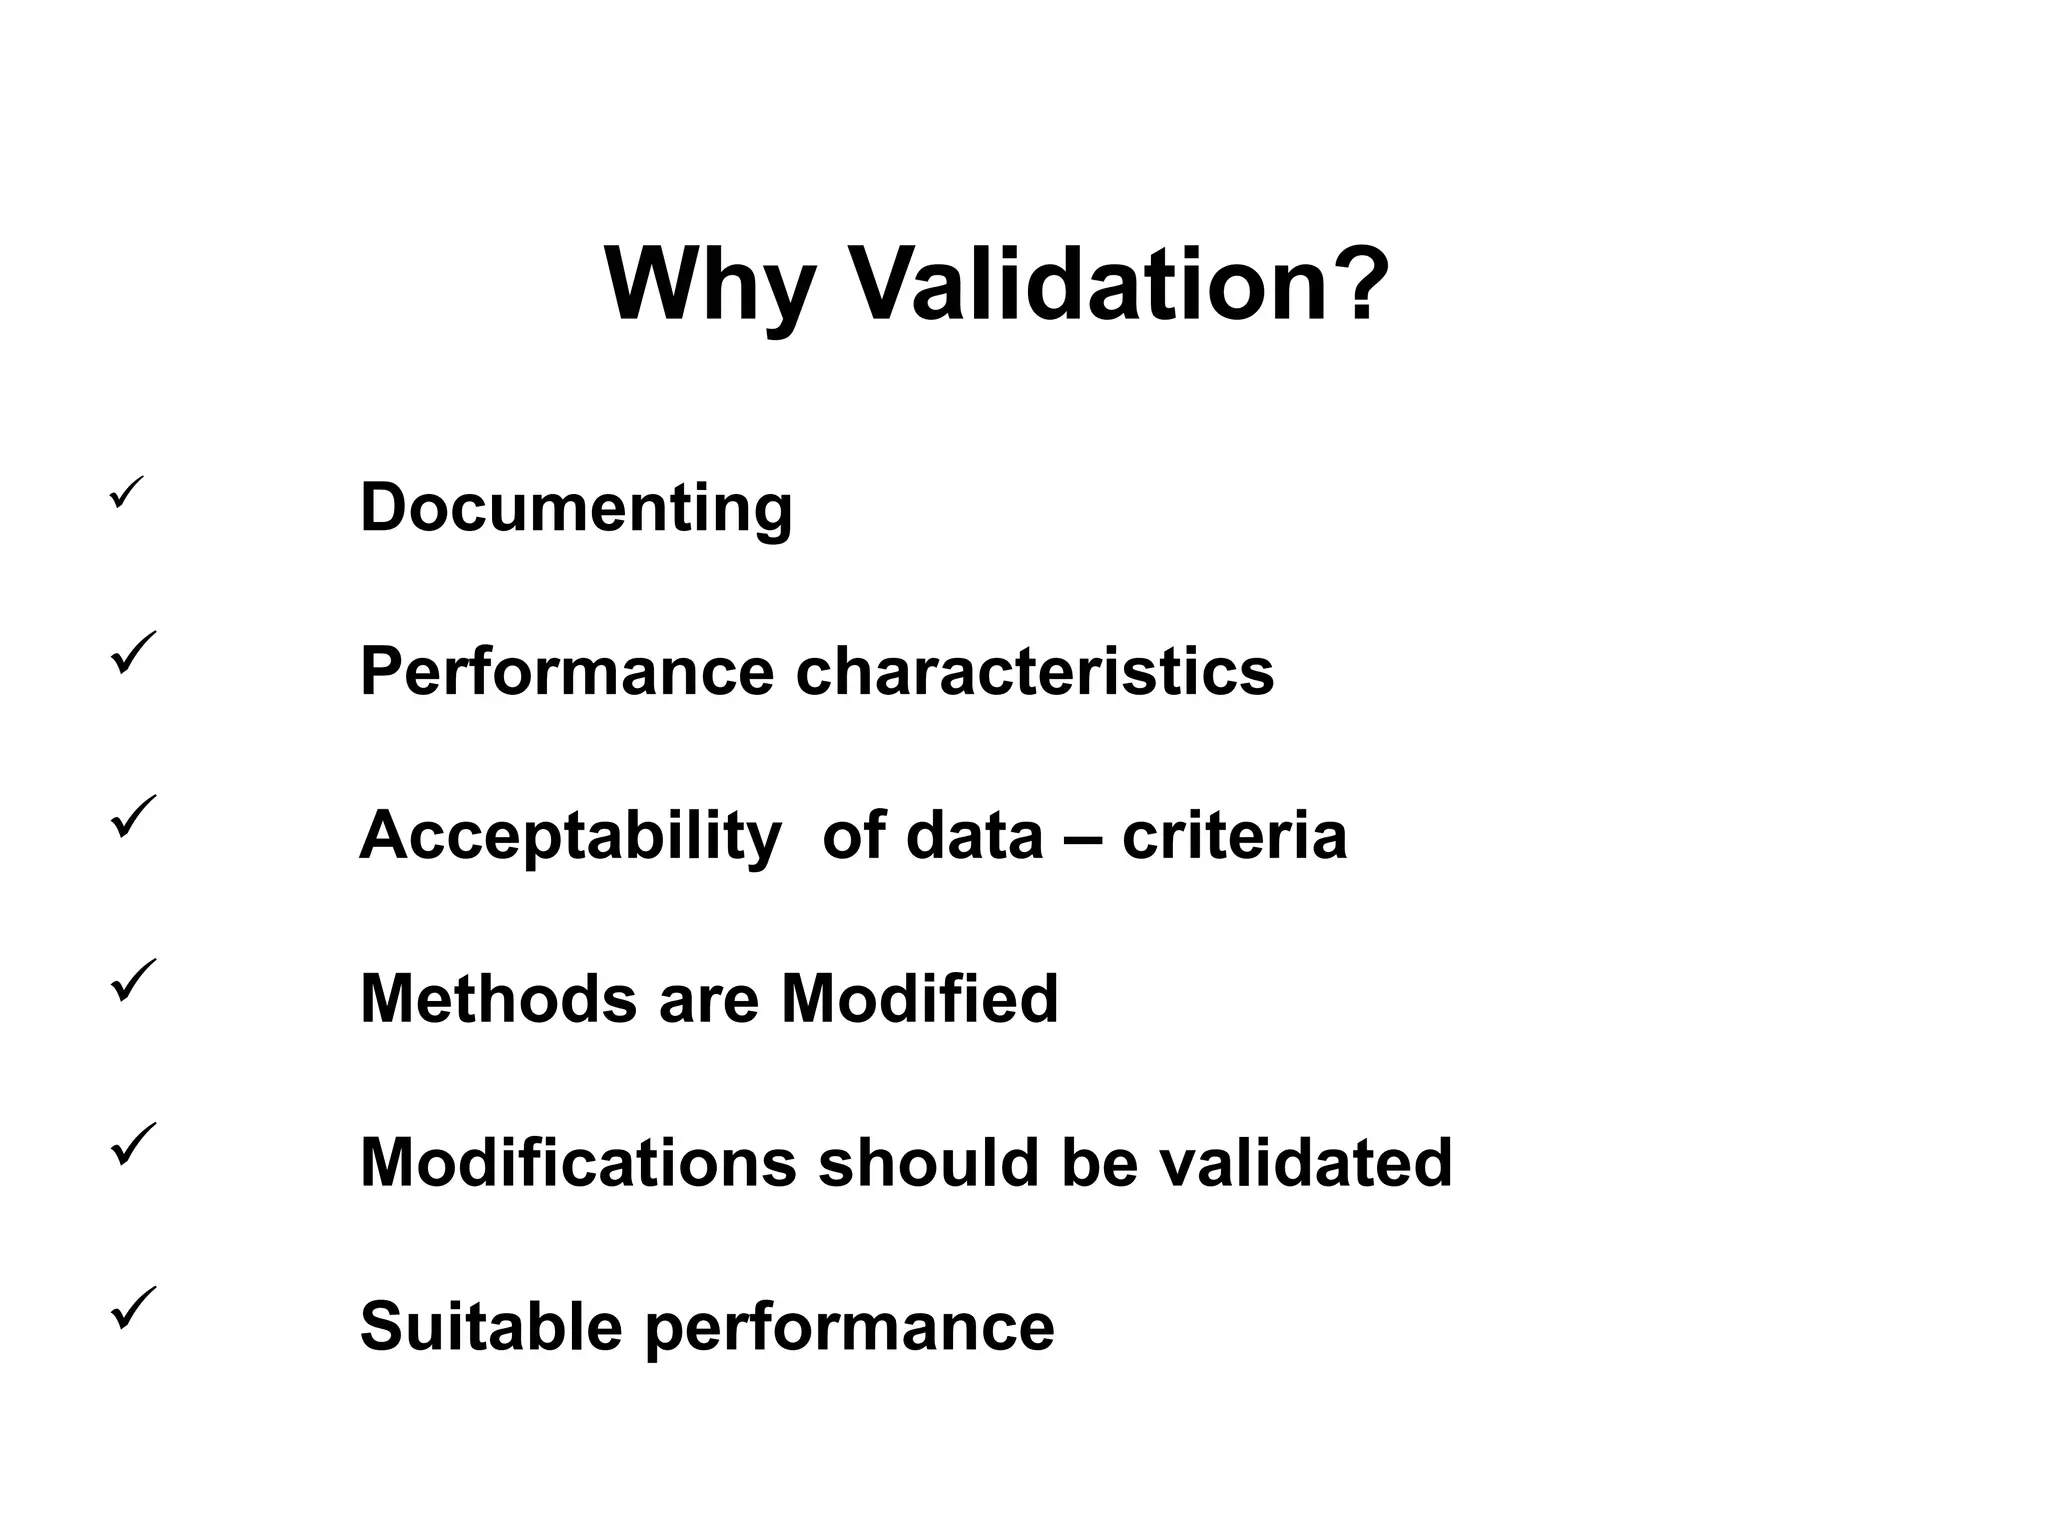
Why Validation?
Documenting
Performance characteristics
Acceptability of data – criteria
Methods are Modified
Modifications should be validated
Suitable performance
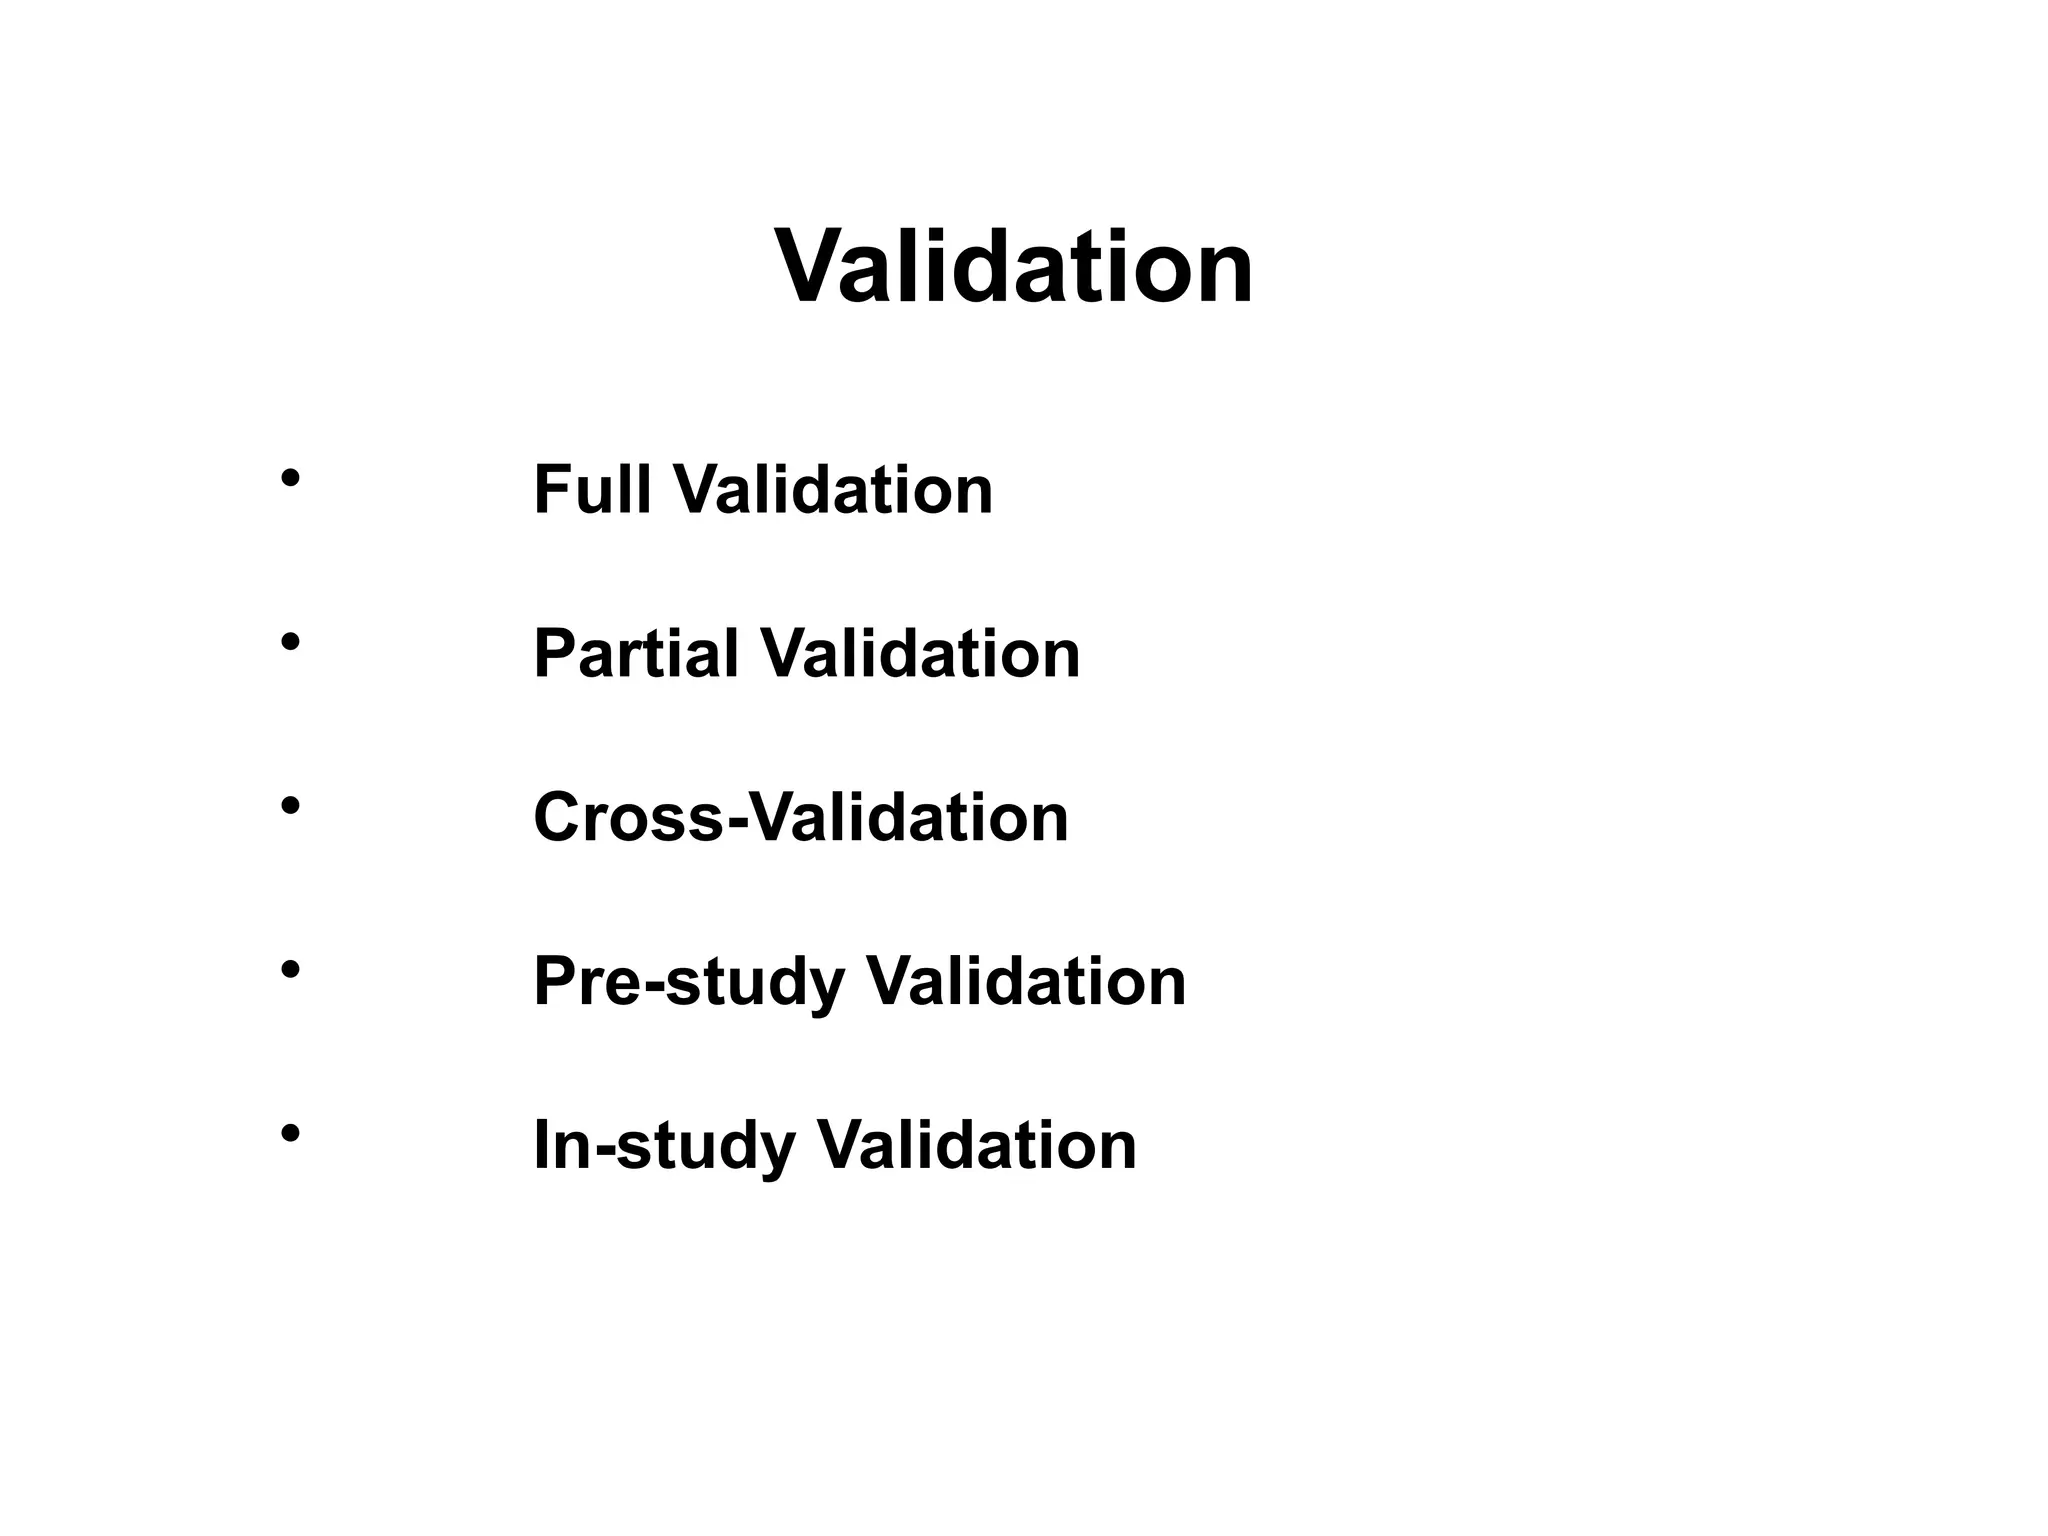
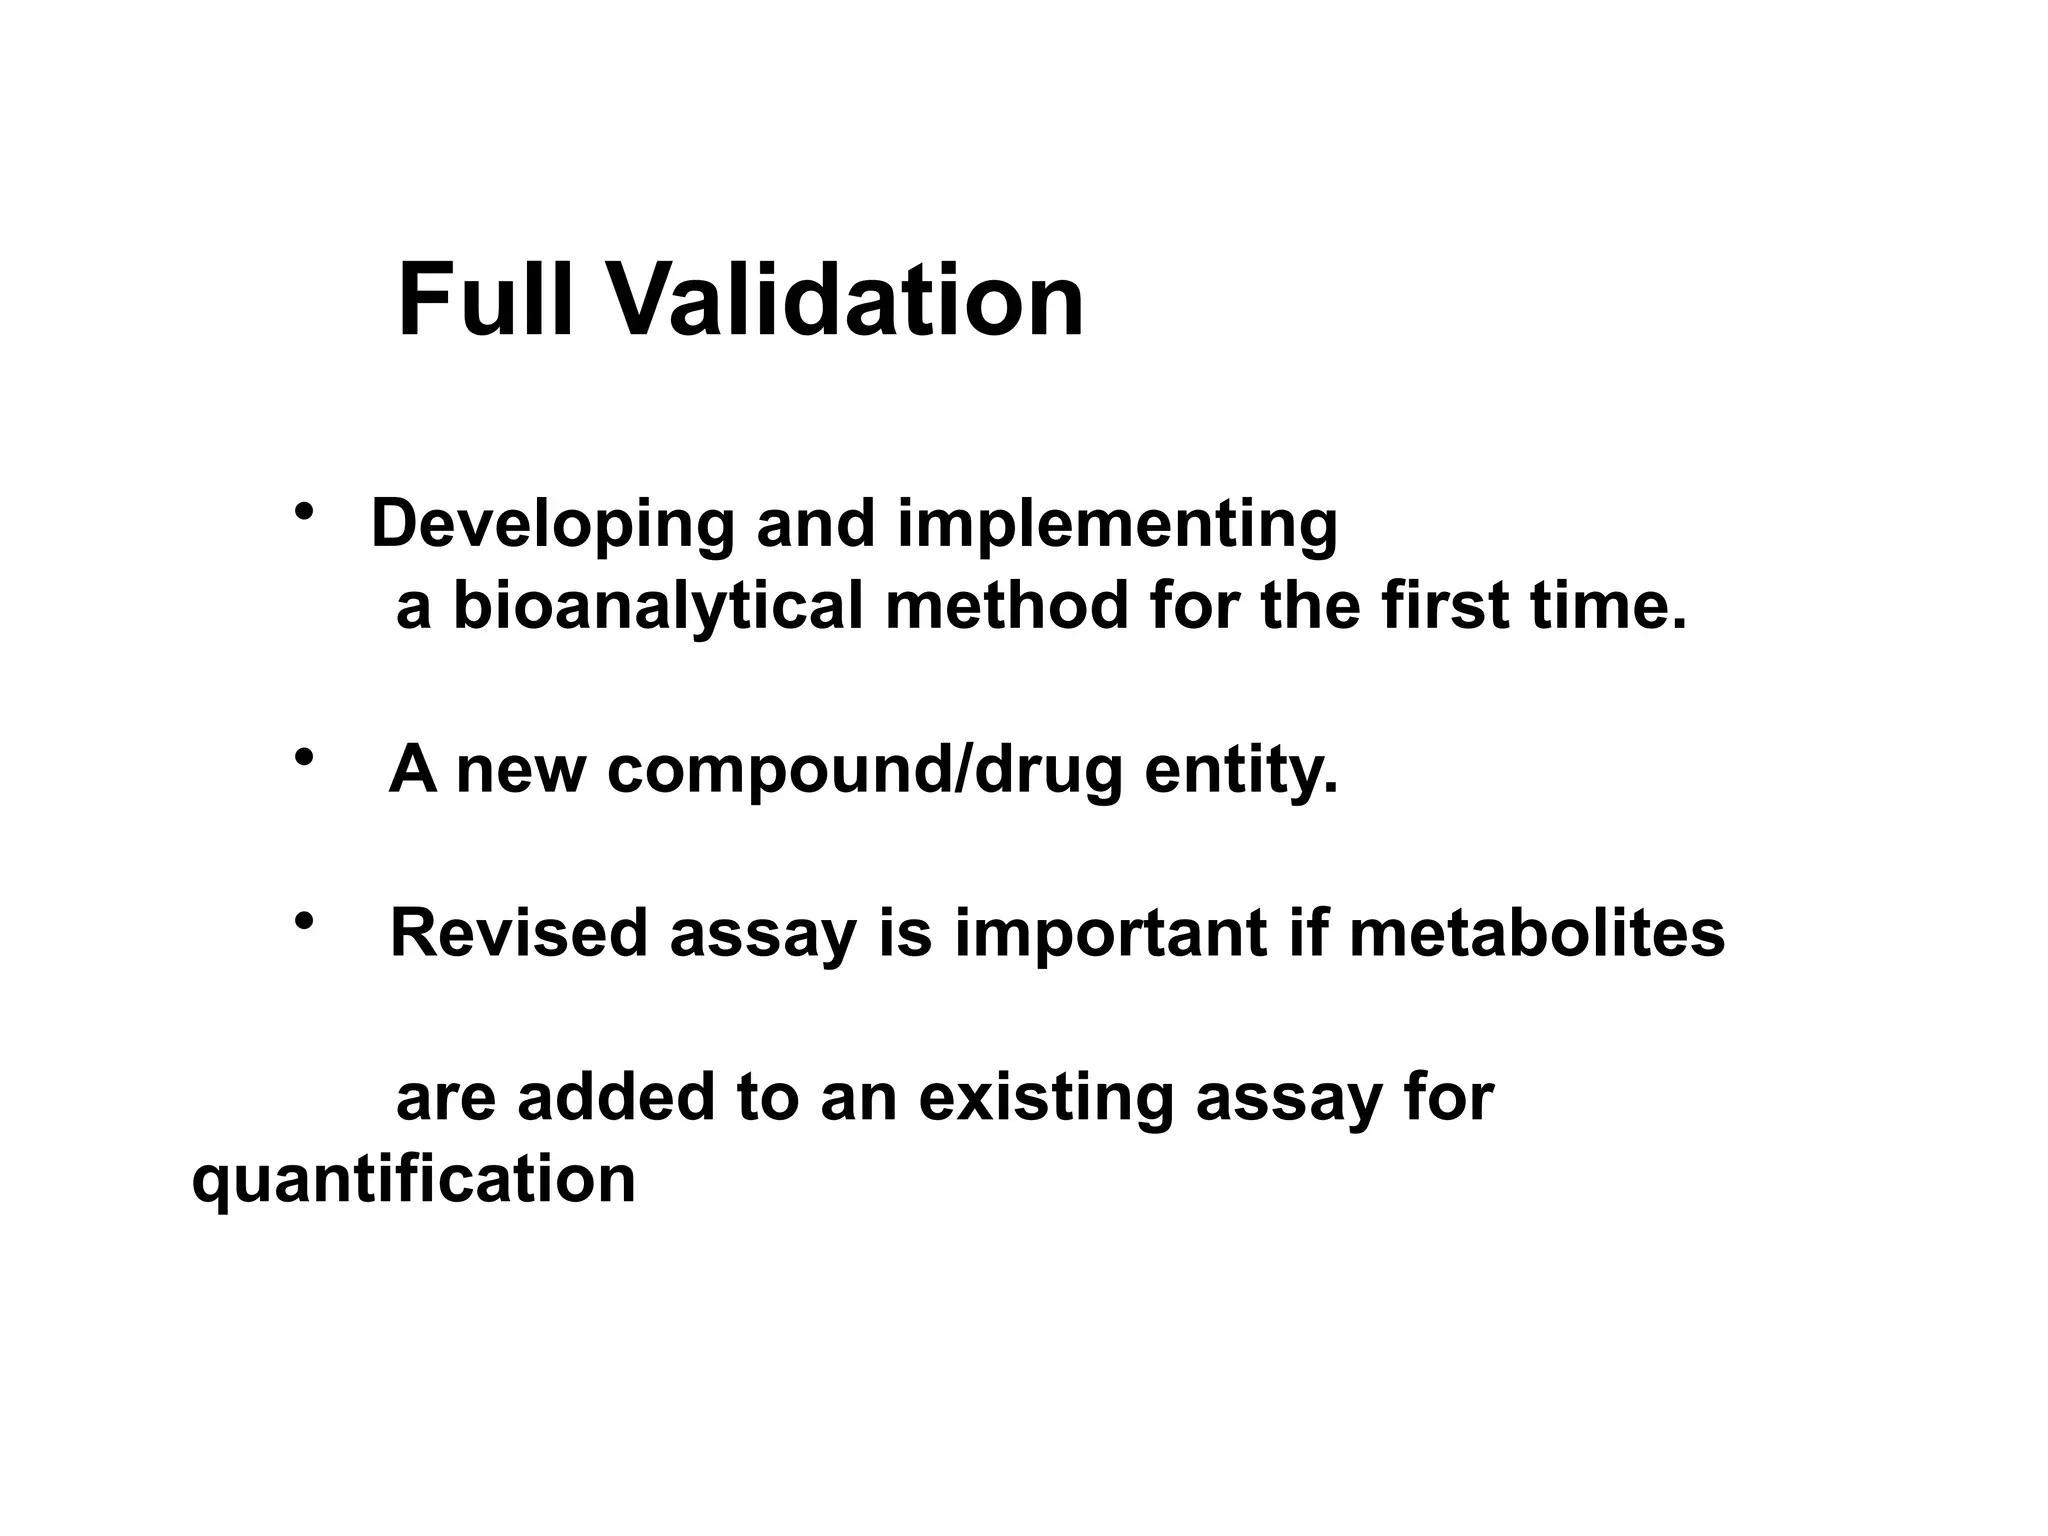
Full Validation
• Developingand implementing
a bioanalytical method for the first time.
• A new compound/drug entity.
• Revised assay is important if metabolites
are added to an existing assay for
quantification
7.
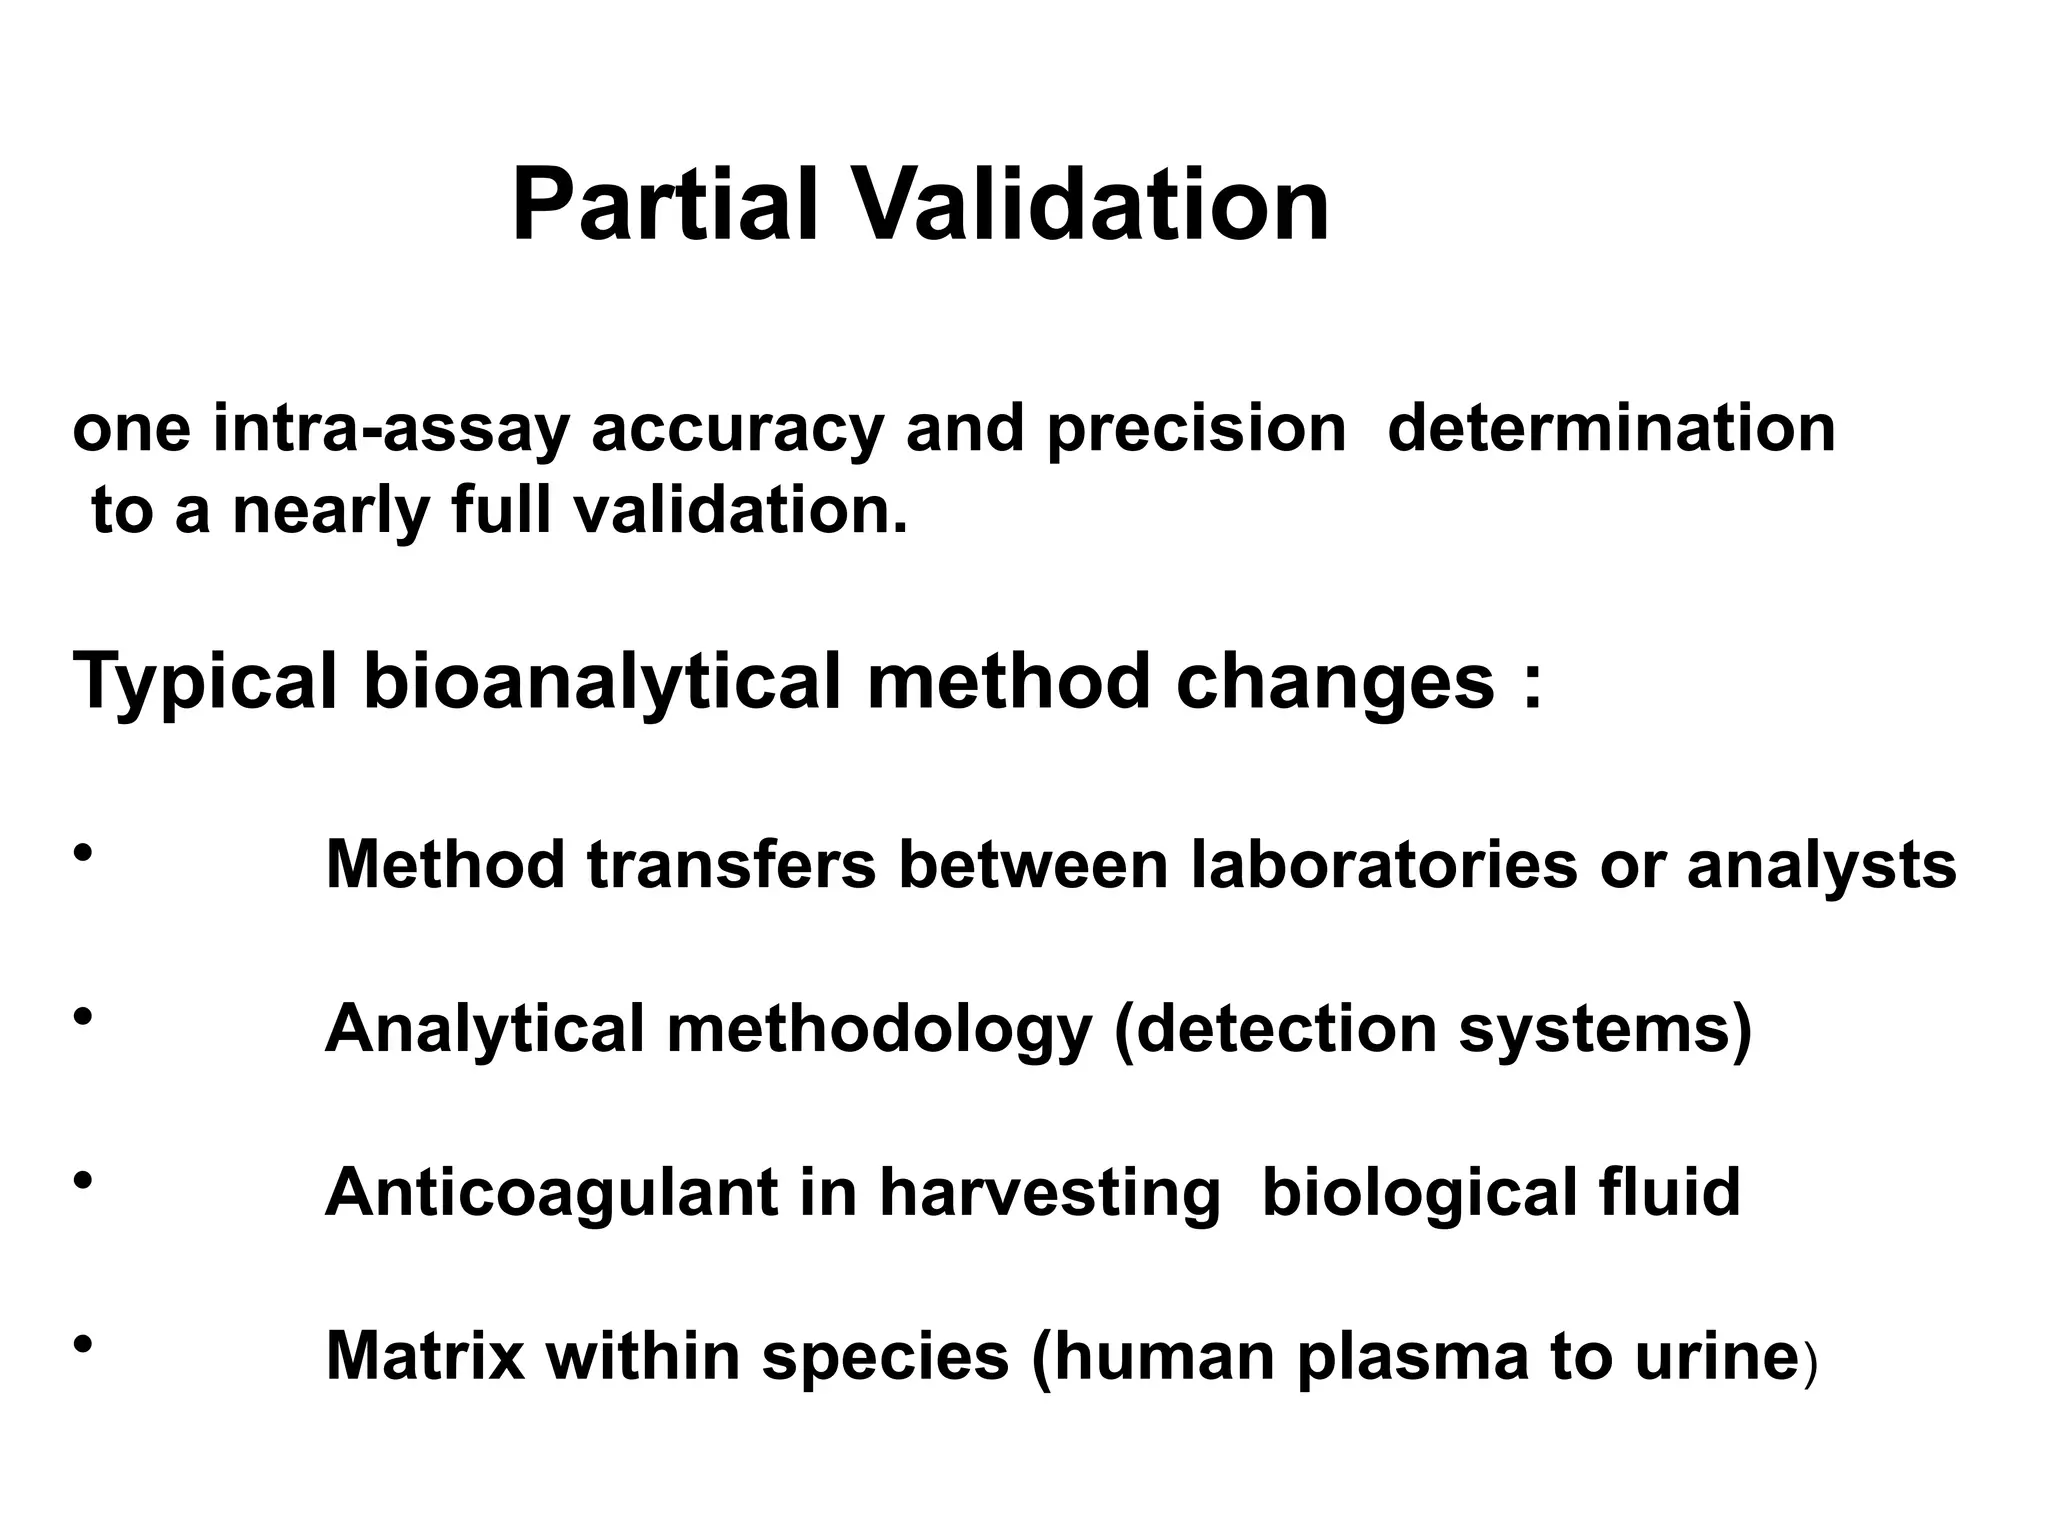
Partial Validation
one intra-assayaccuracy and precision determination
to a nearly full validation.
Typical bioanalytical method changes :
• Method transfers between laboratories or analysts
• Analytical methodology (detection systems)
• Anticoagulant in harvesting biological fluid
• Matrix within species (human plasma to urine)
8.
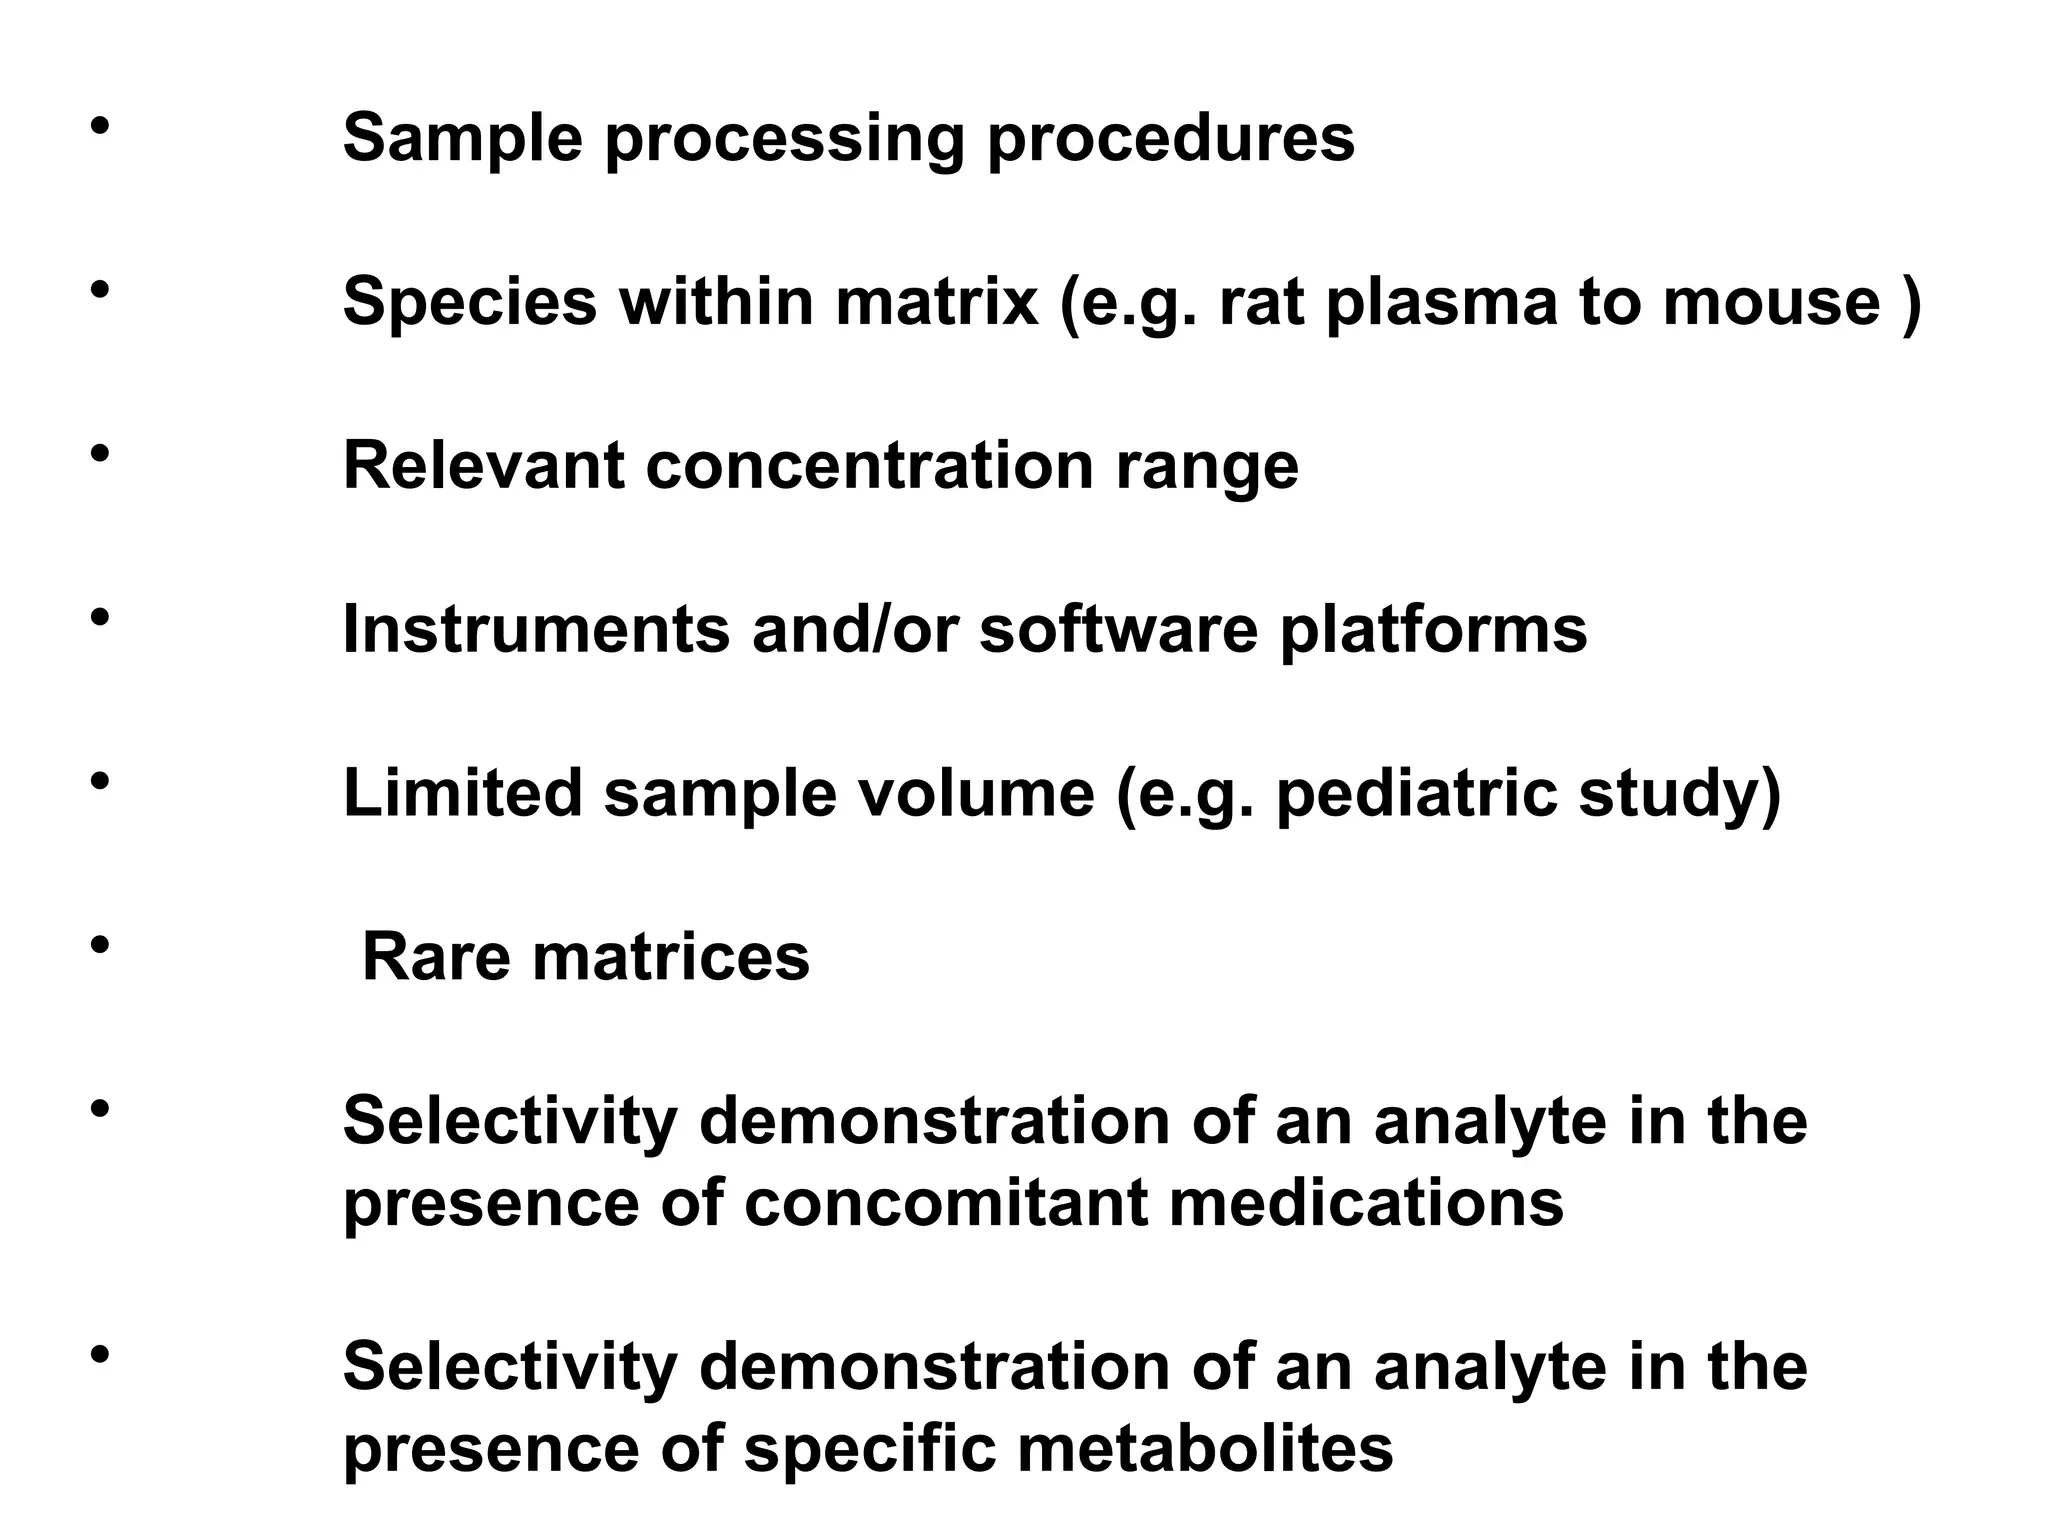
• Sample processingprocedures
• Species within matrix (e.g. rat plasma to mouse )
• Relevant concentration range
• Instruments and/or software platforms
• Limited sample volume (e.g. pediatric study)
• Rare matrices
• Selectivity demonstration of an analyte in the
presence of concomitant medications
• Selectivity demonstration of an analyte in the
presence of specific metabolites
9.
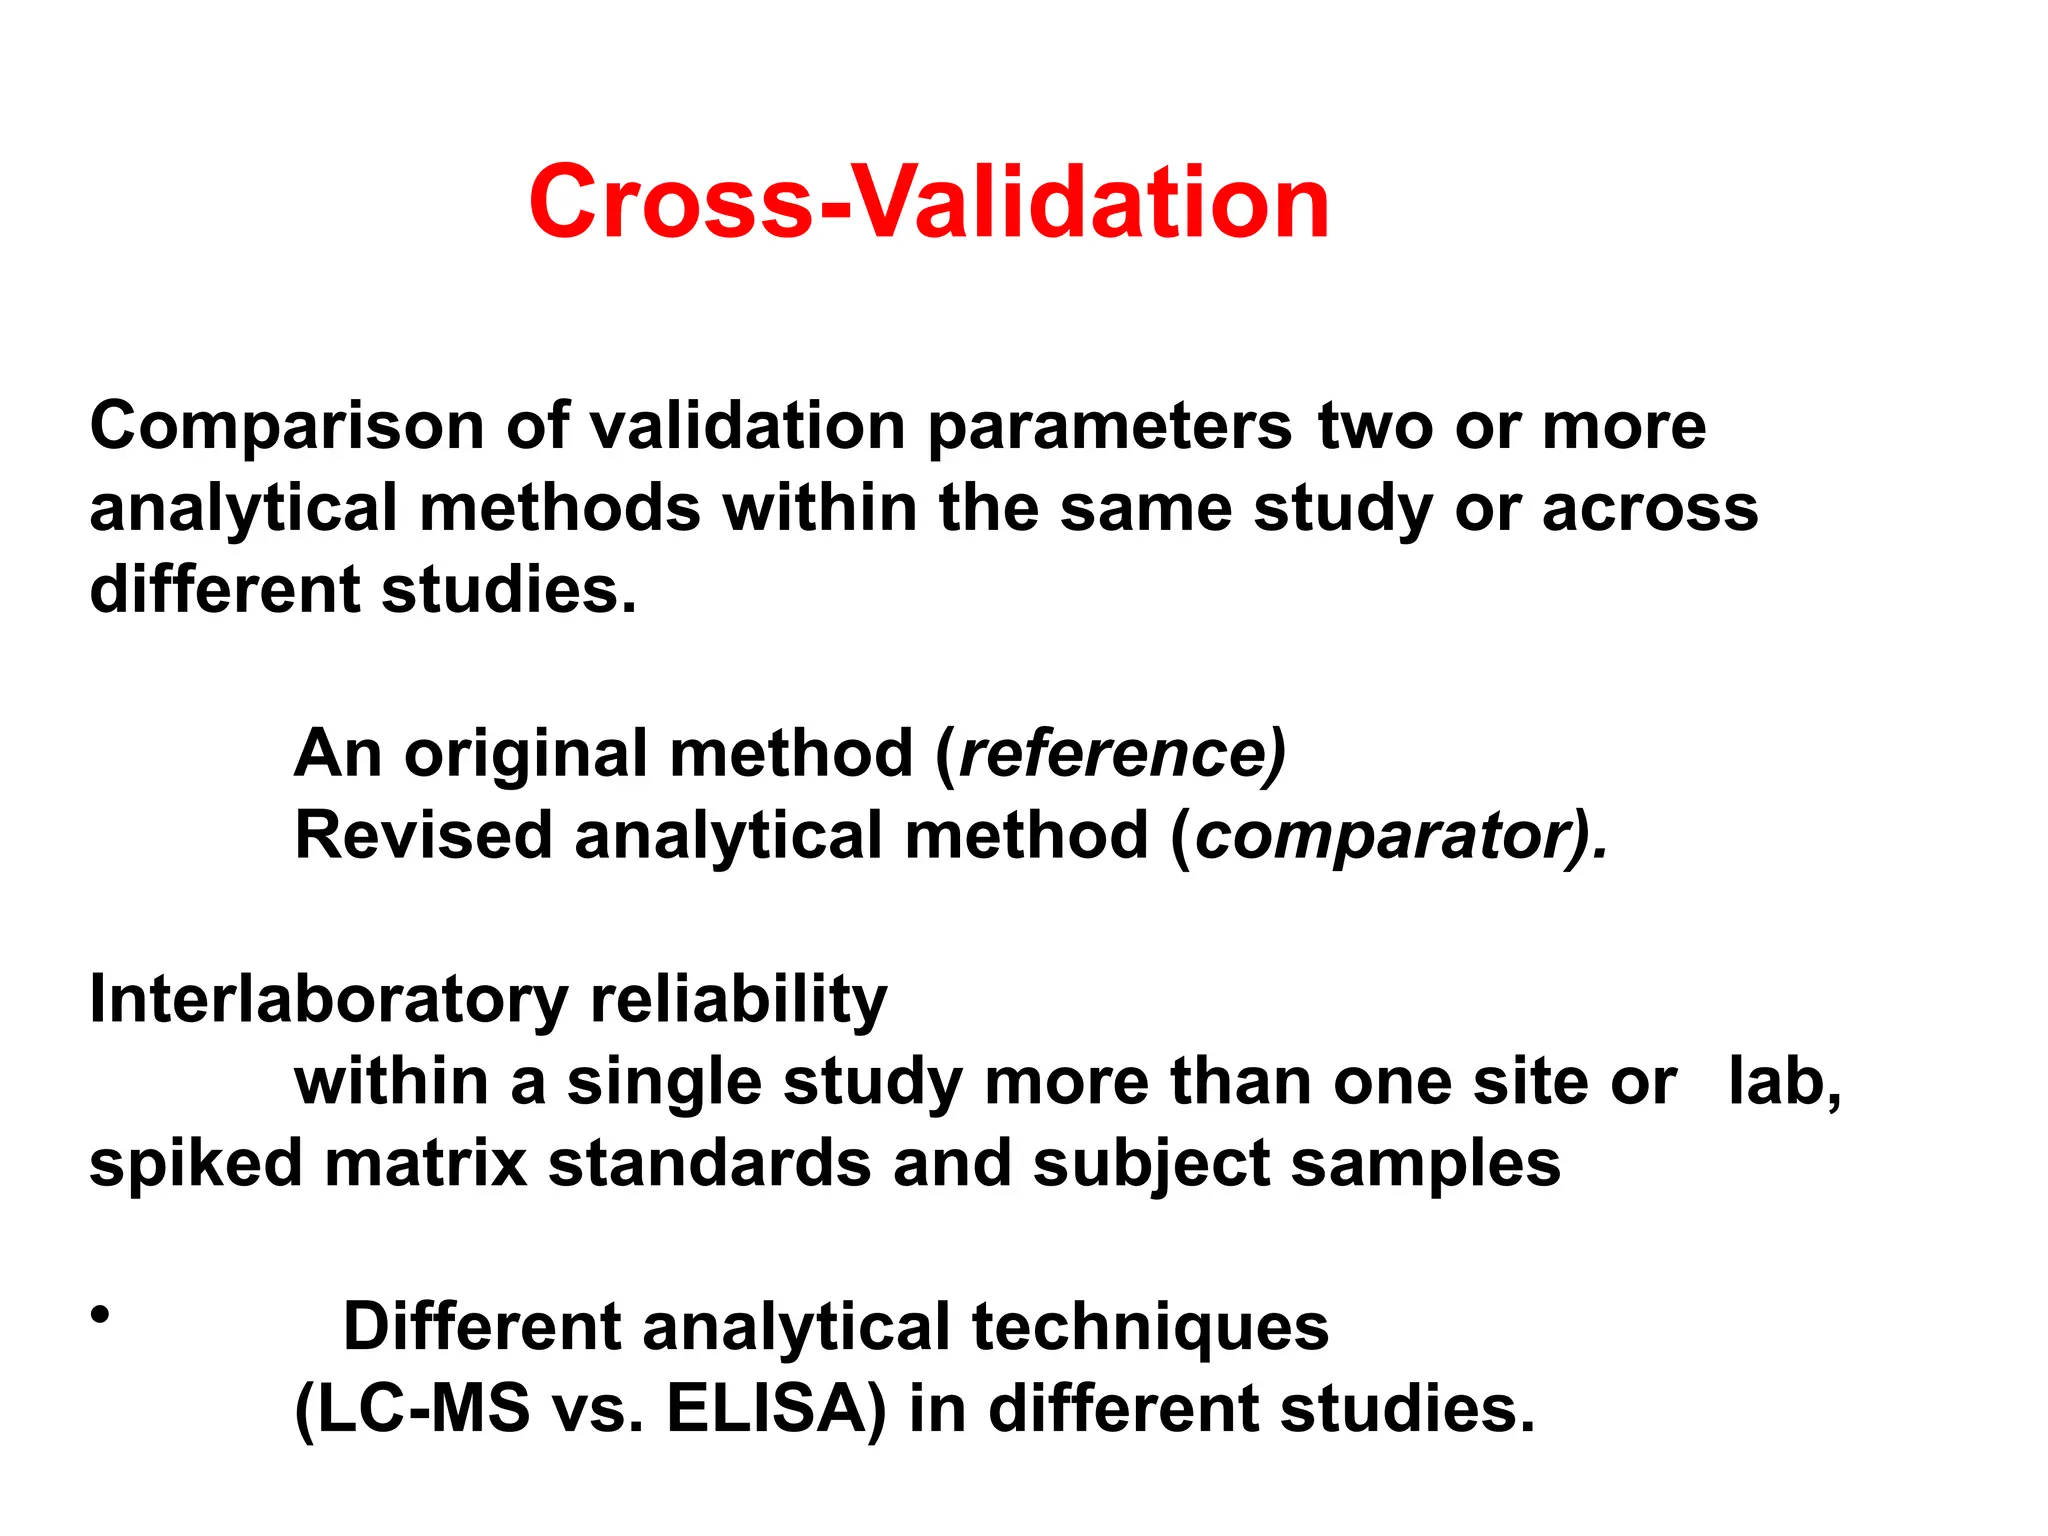
Cross-Validation
Comparison of validationparameters two or more
analytical methods within the same study or across
different studies.
An original method (reference)
Revised analytical method (comparator).
Interlaboratory reliability
within a single study more than one site or lab,
spiked matrix standards and subject samples
• Different analytical techniques
(LC-MS vs. ELISA) in different studies.
10.
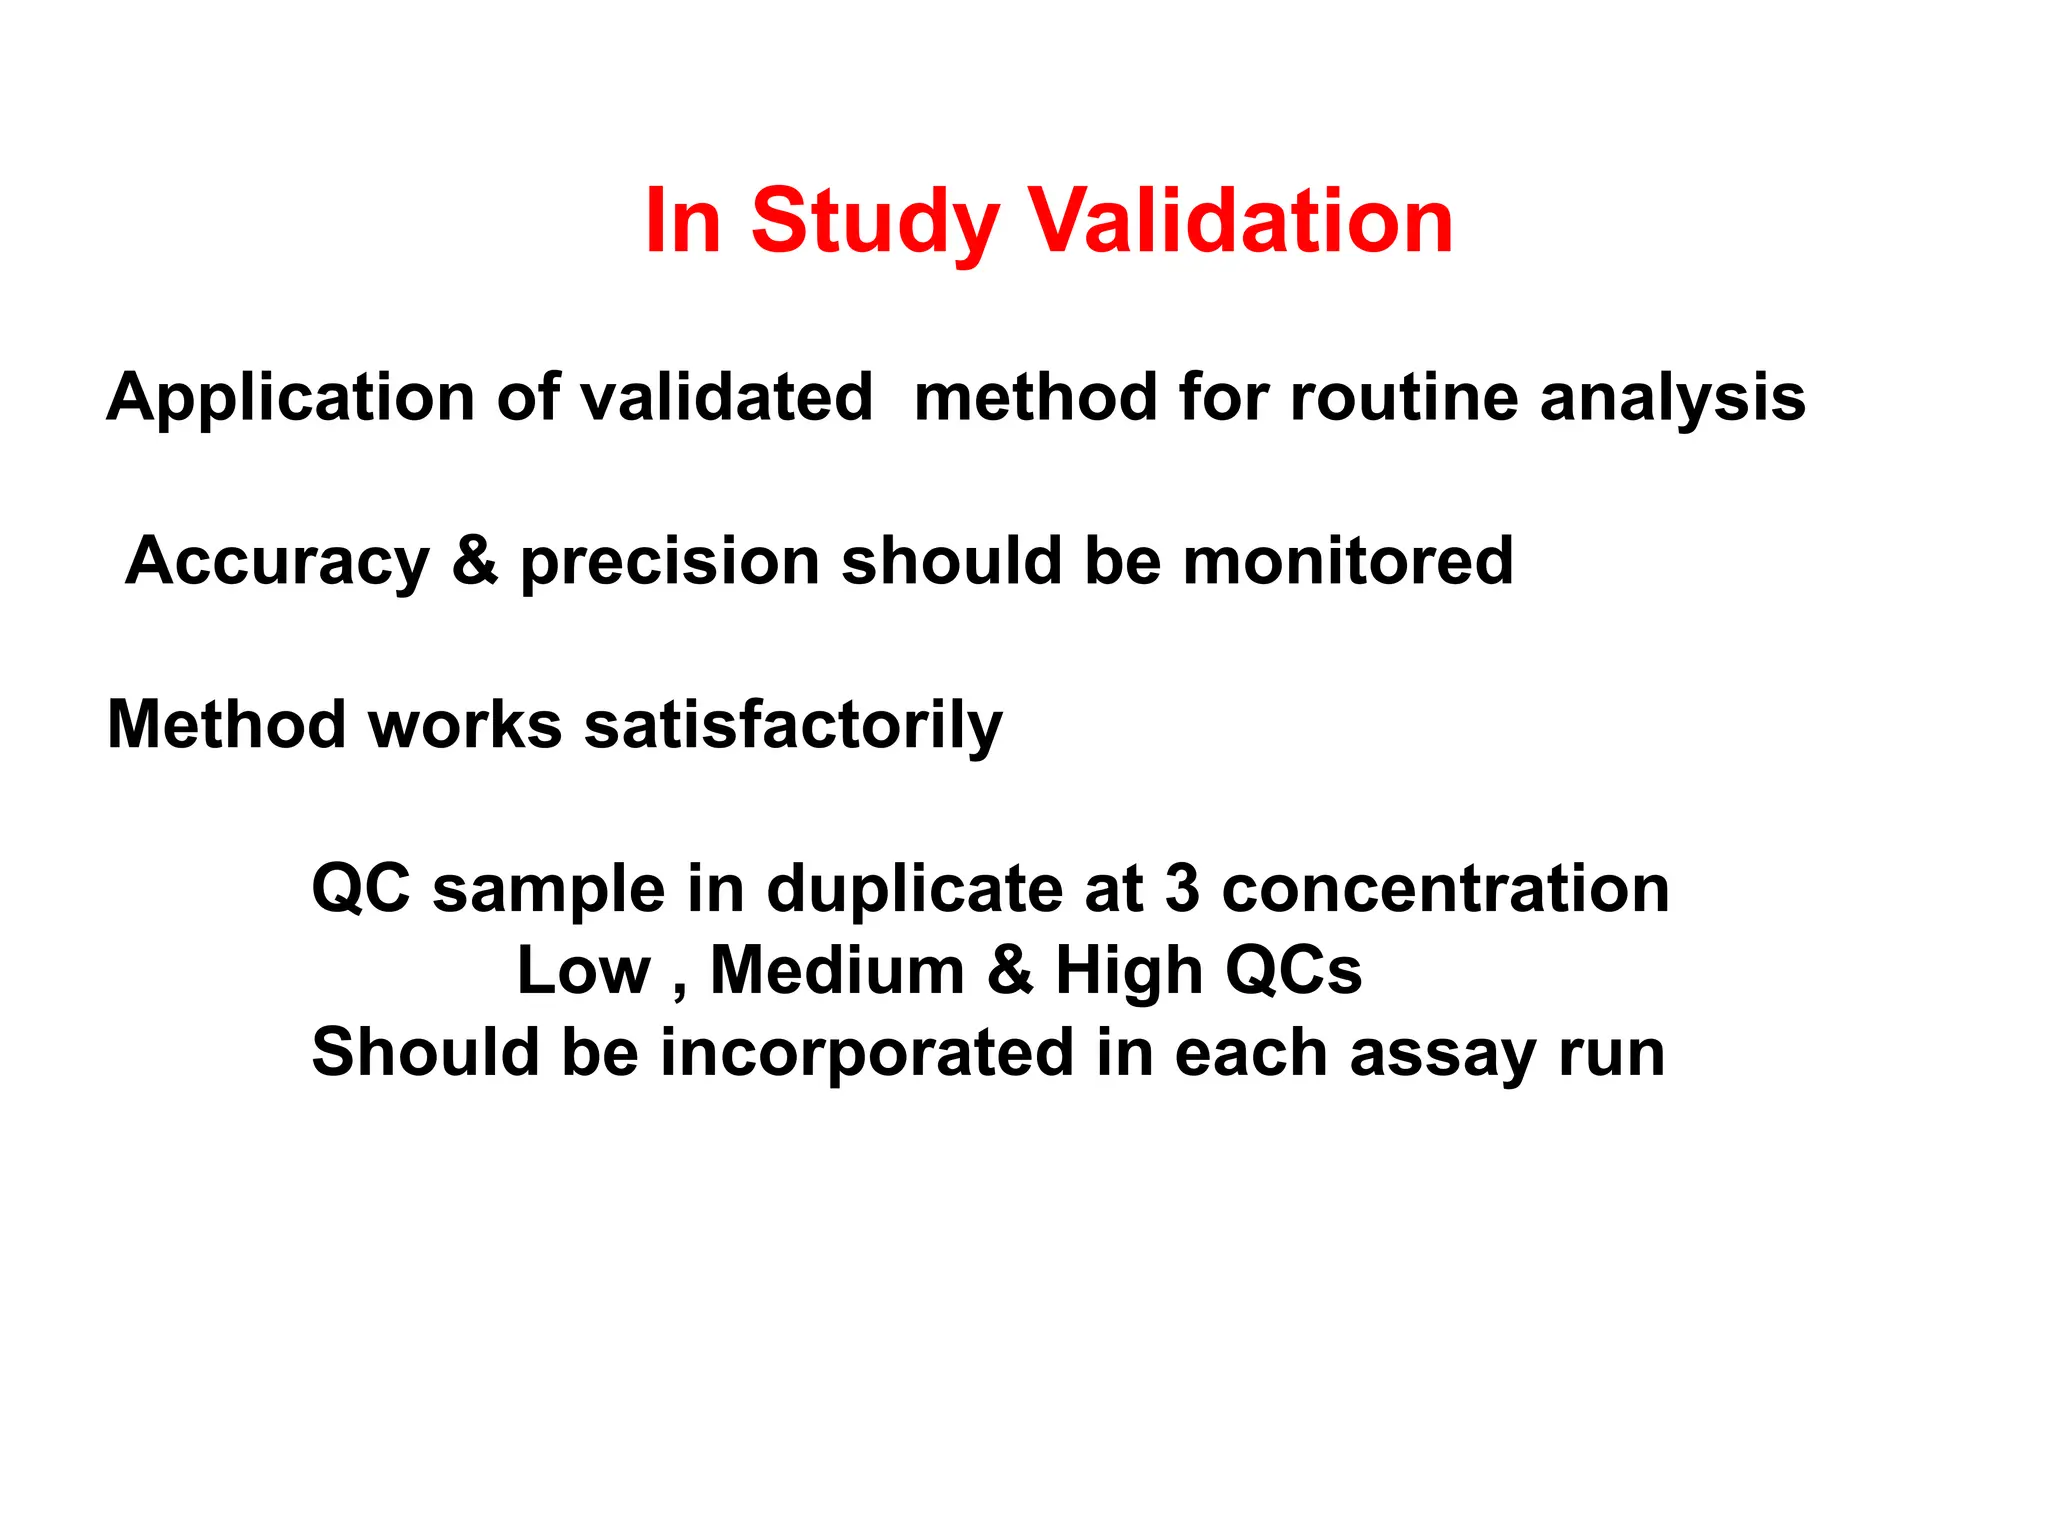
In Study Validation
Applicationof validated method for routine analysis
Accuracy & precision should be monitored
Method works satisfactorily
QC sample in duplicate at 3 concentration
Low , Medium & High QCs
Should be incorporated in each assay run
11.
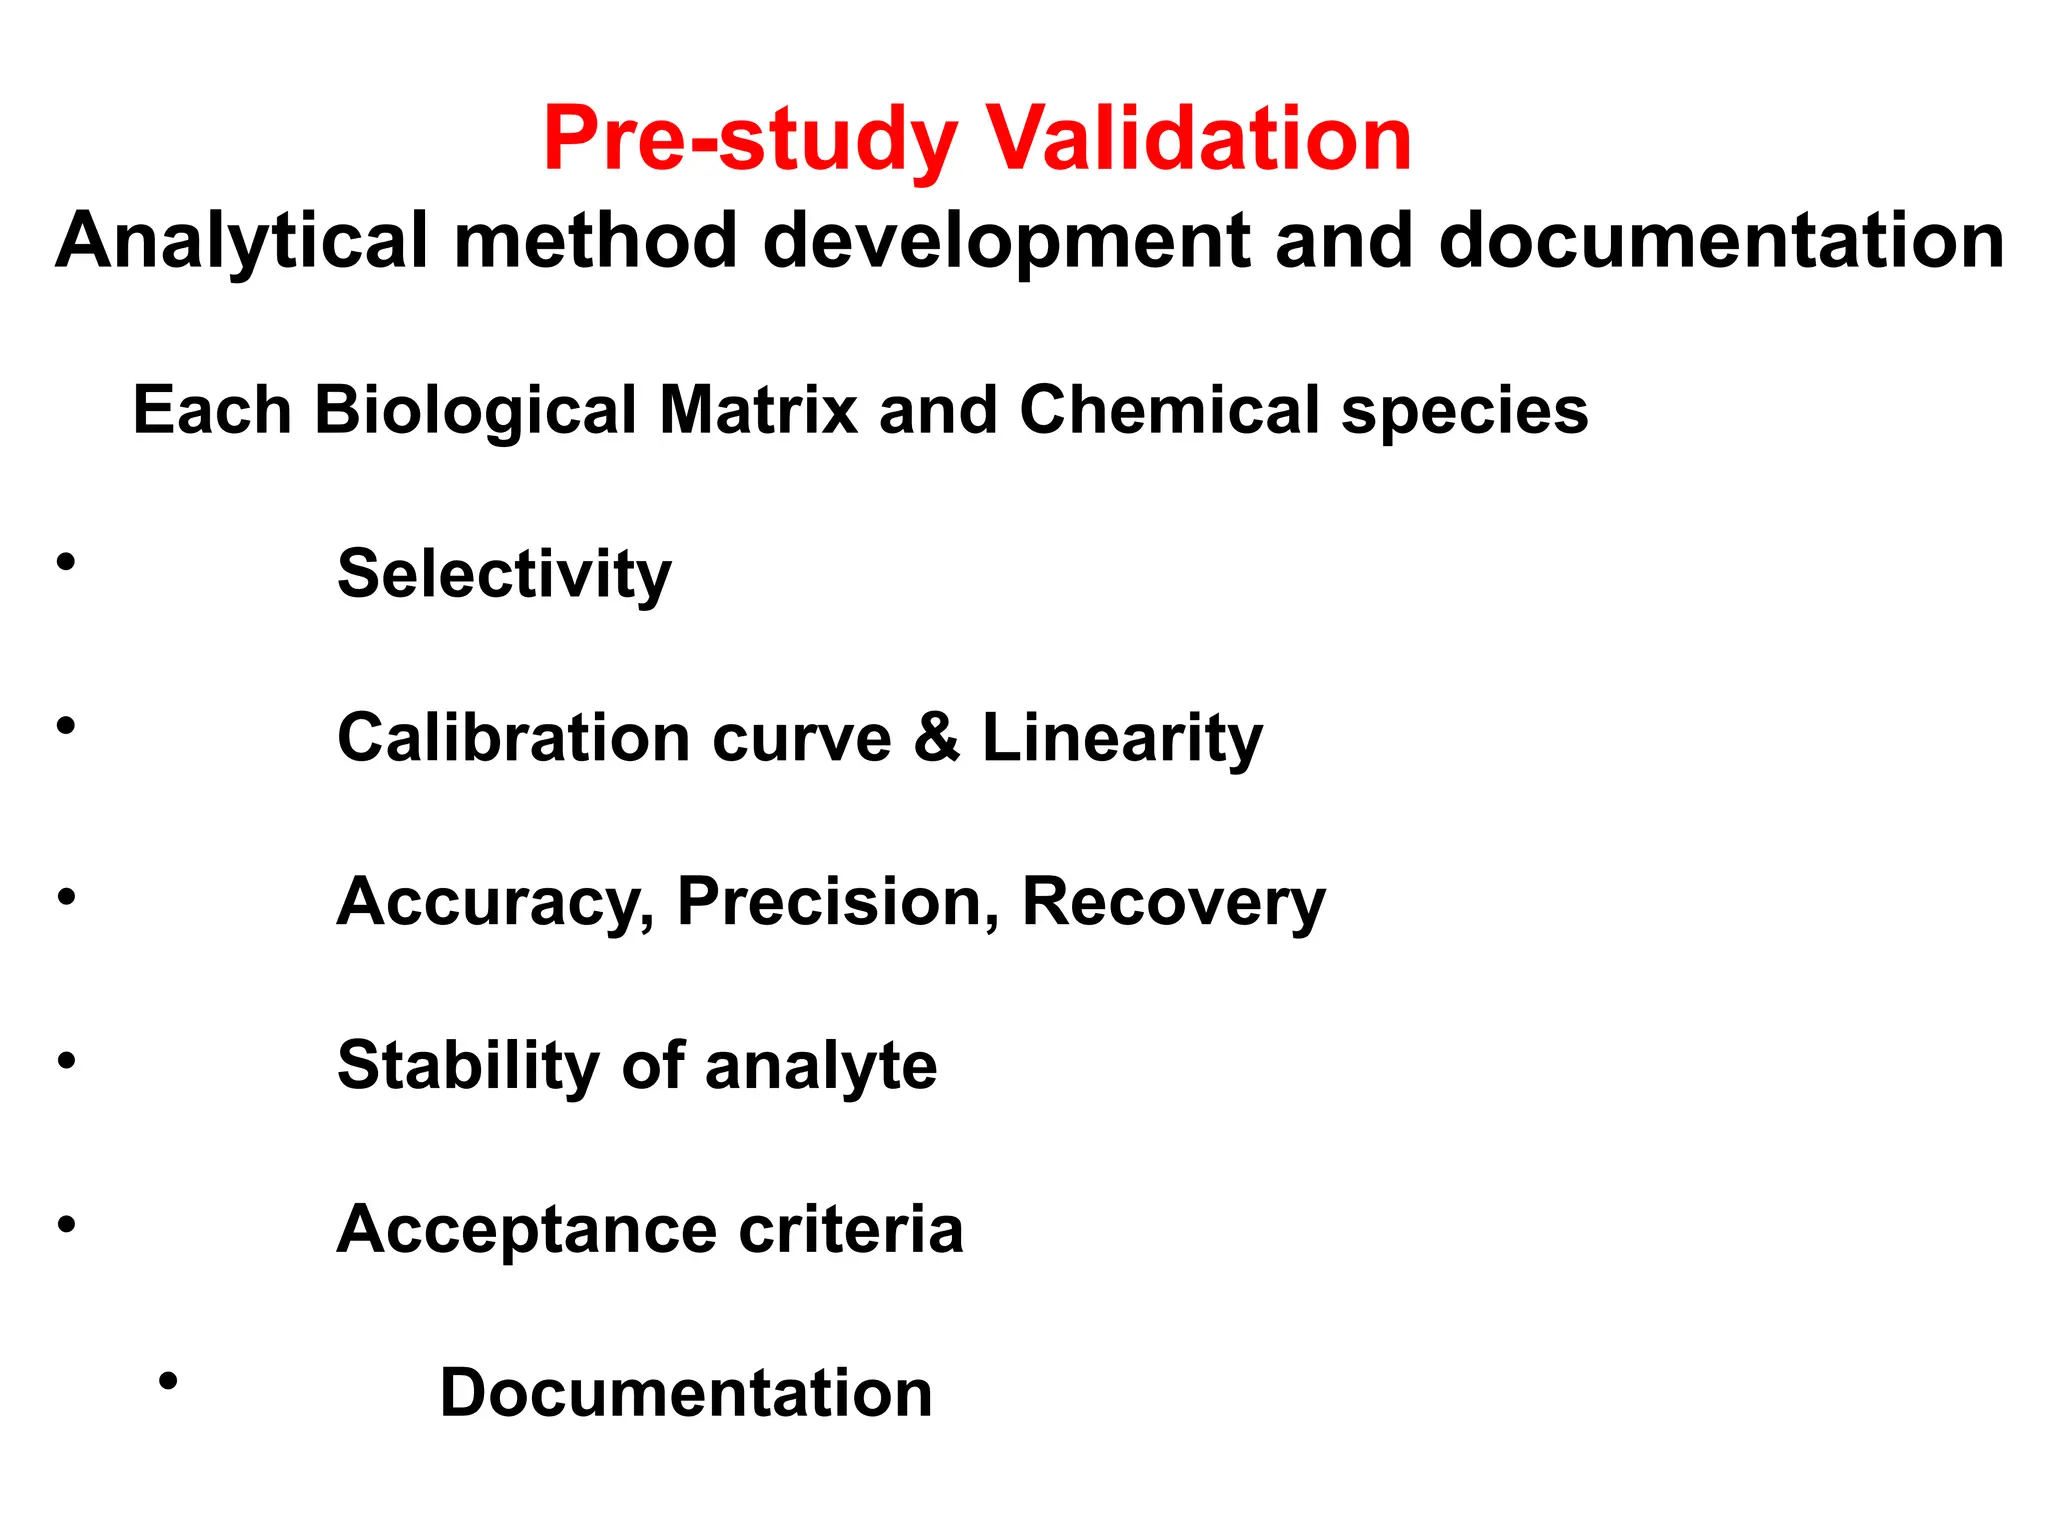
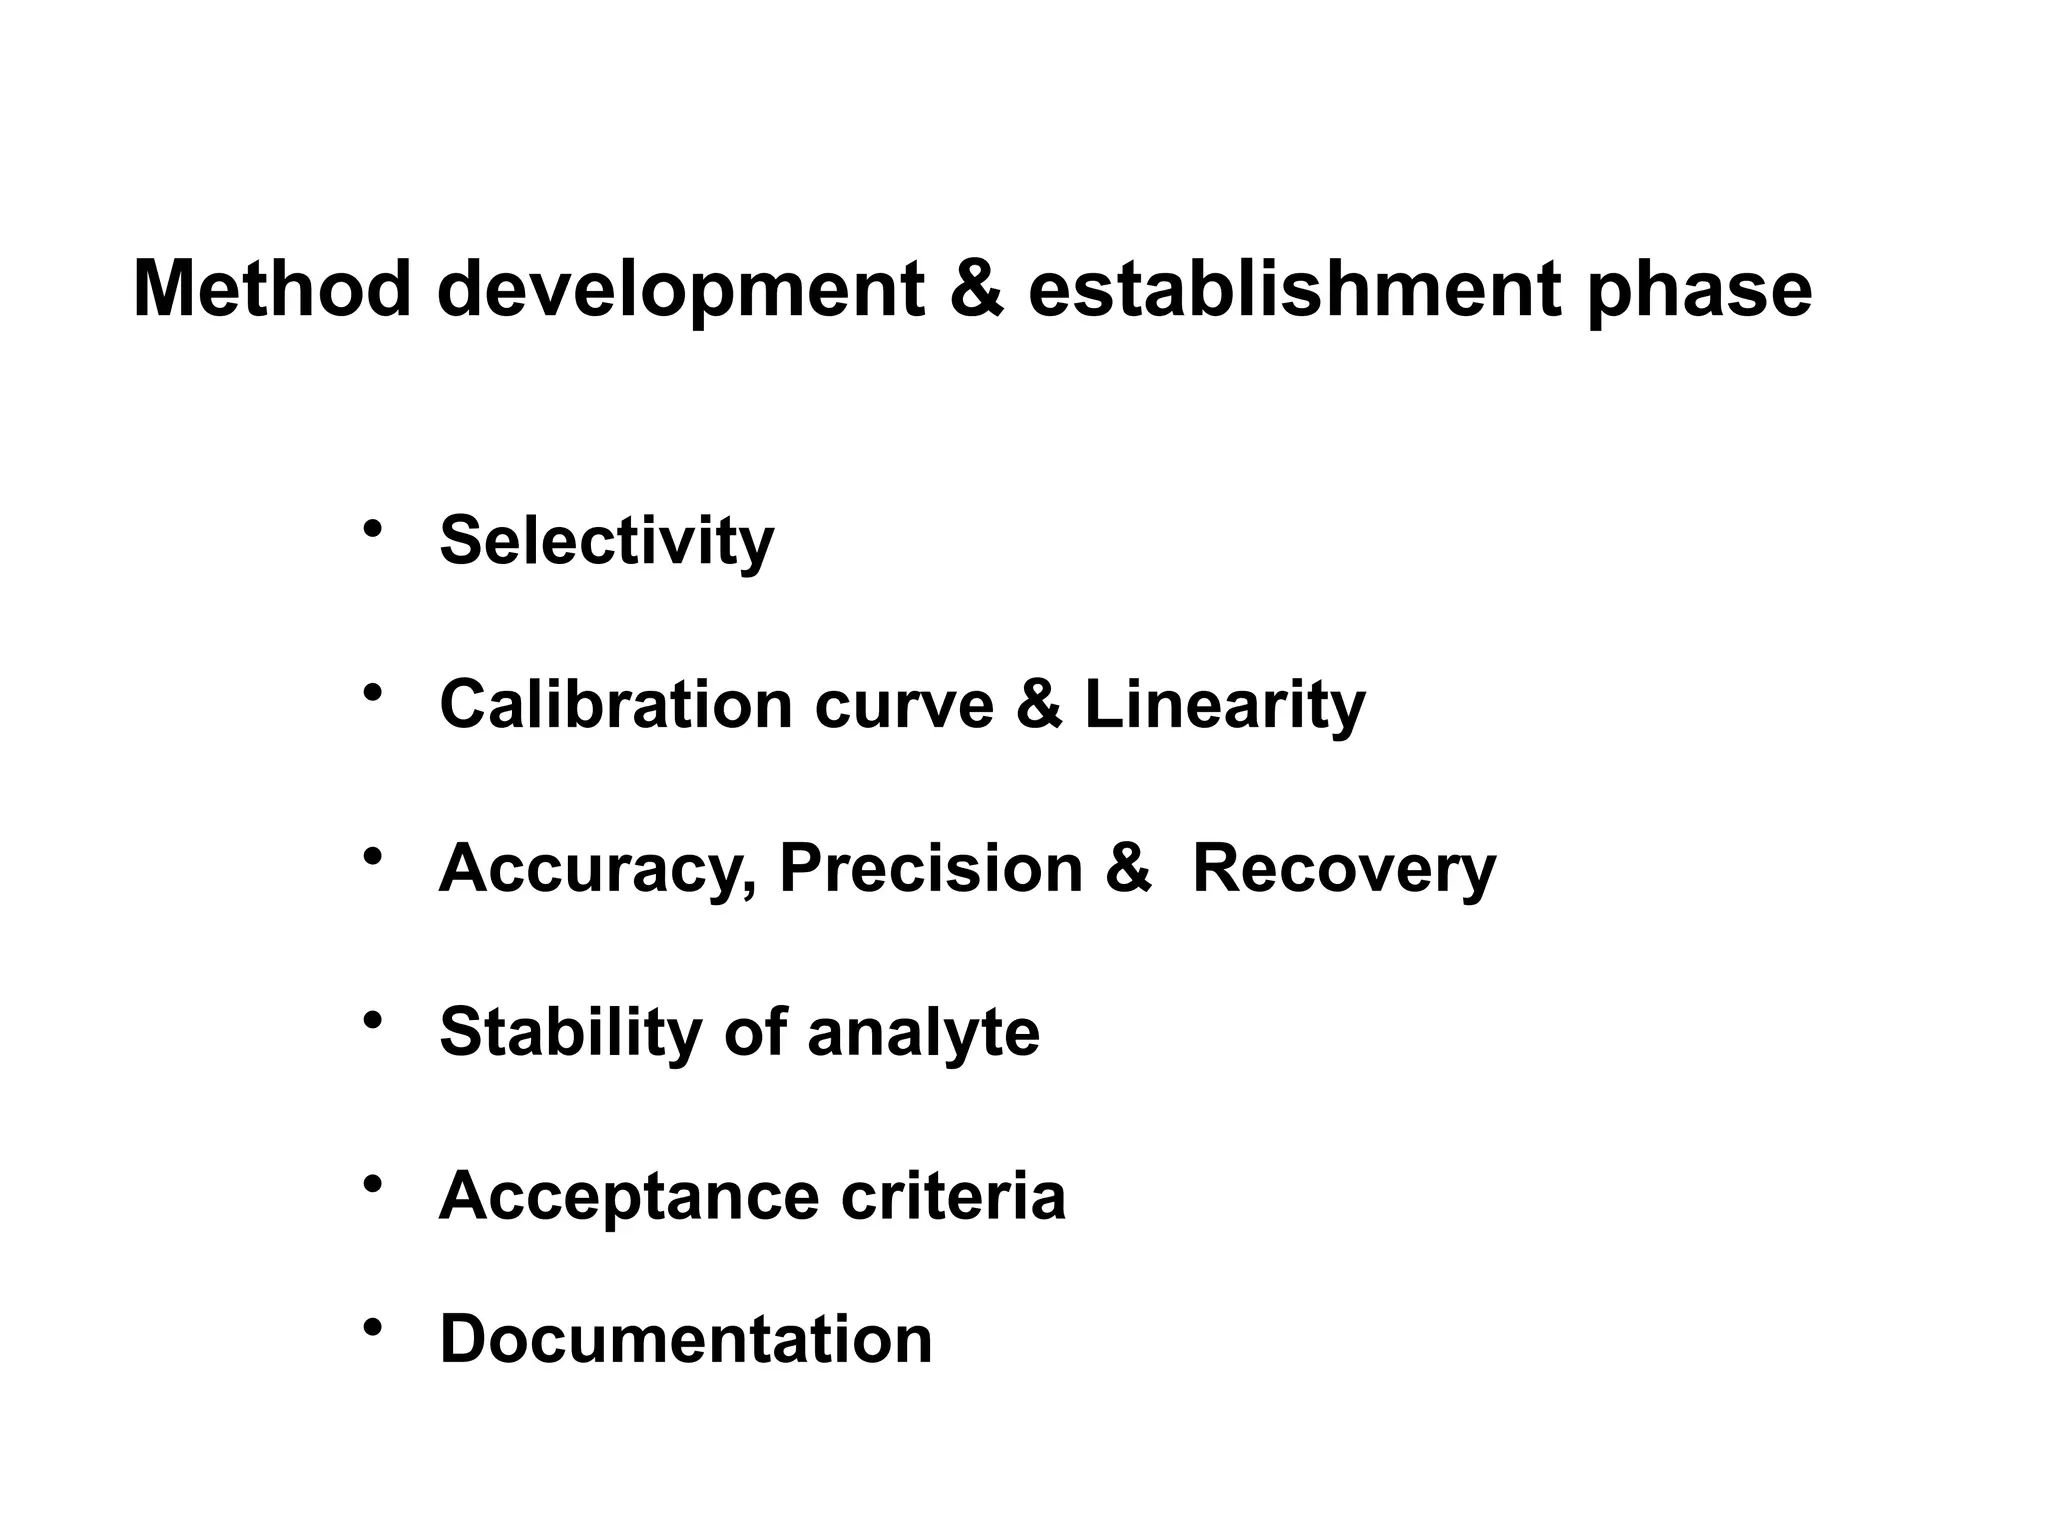
Pre-study Validation
Analytical methoddevelopment and documentation
Each Biological Matrix and Chemical species
• Selectivity
• Calibration curve & Linearity
• Accuracy, Precision, Recovery
• Stability of analyte
• Acceptance criteria
• Documentation
12.
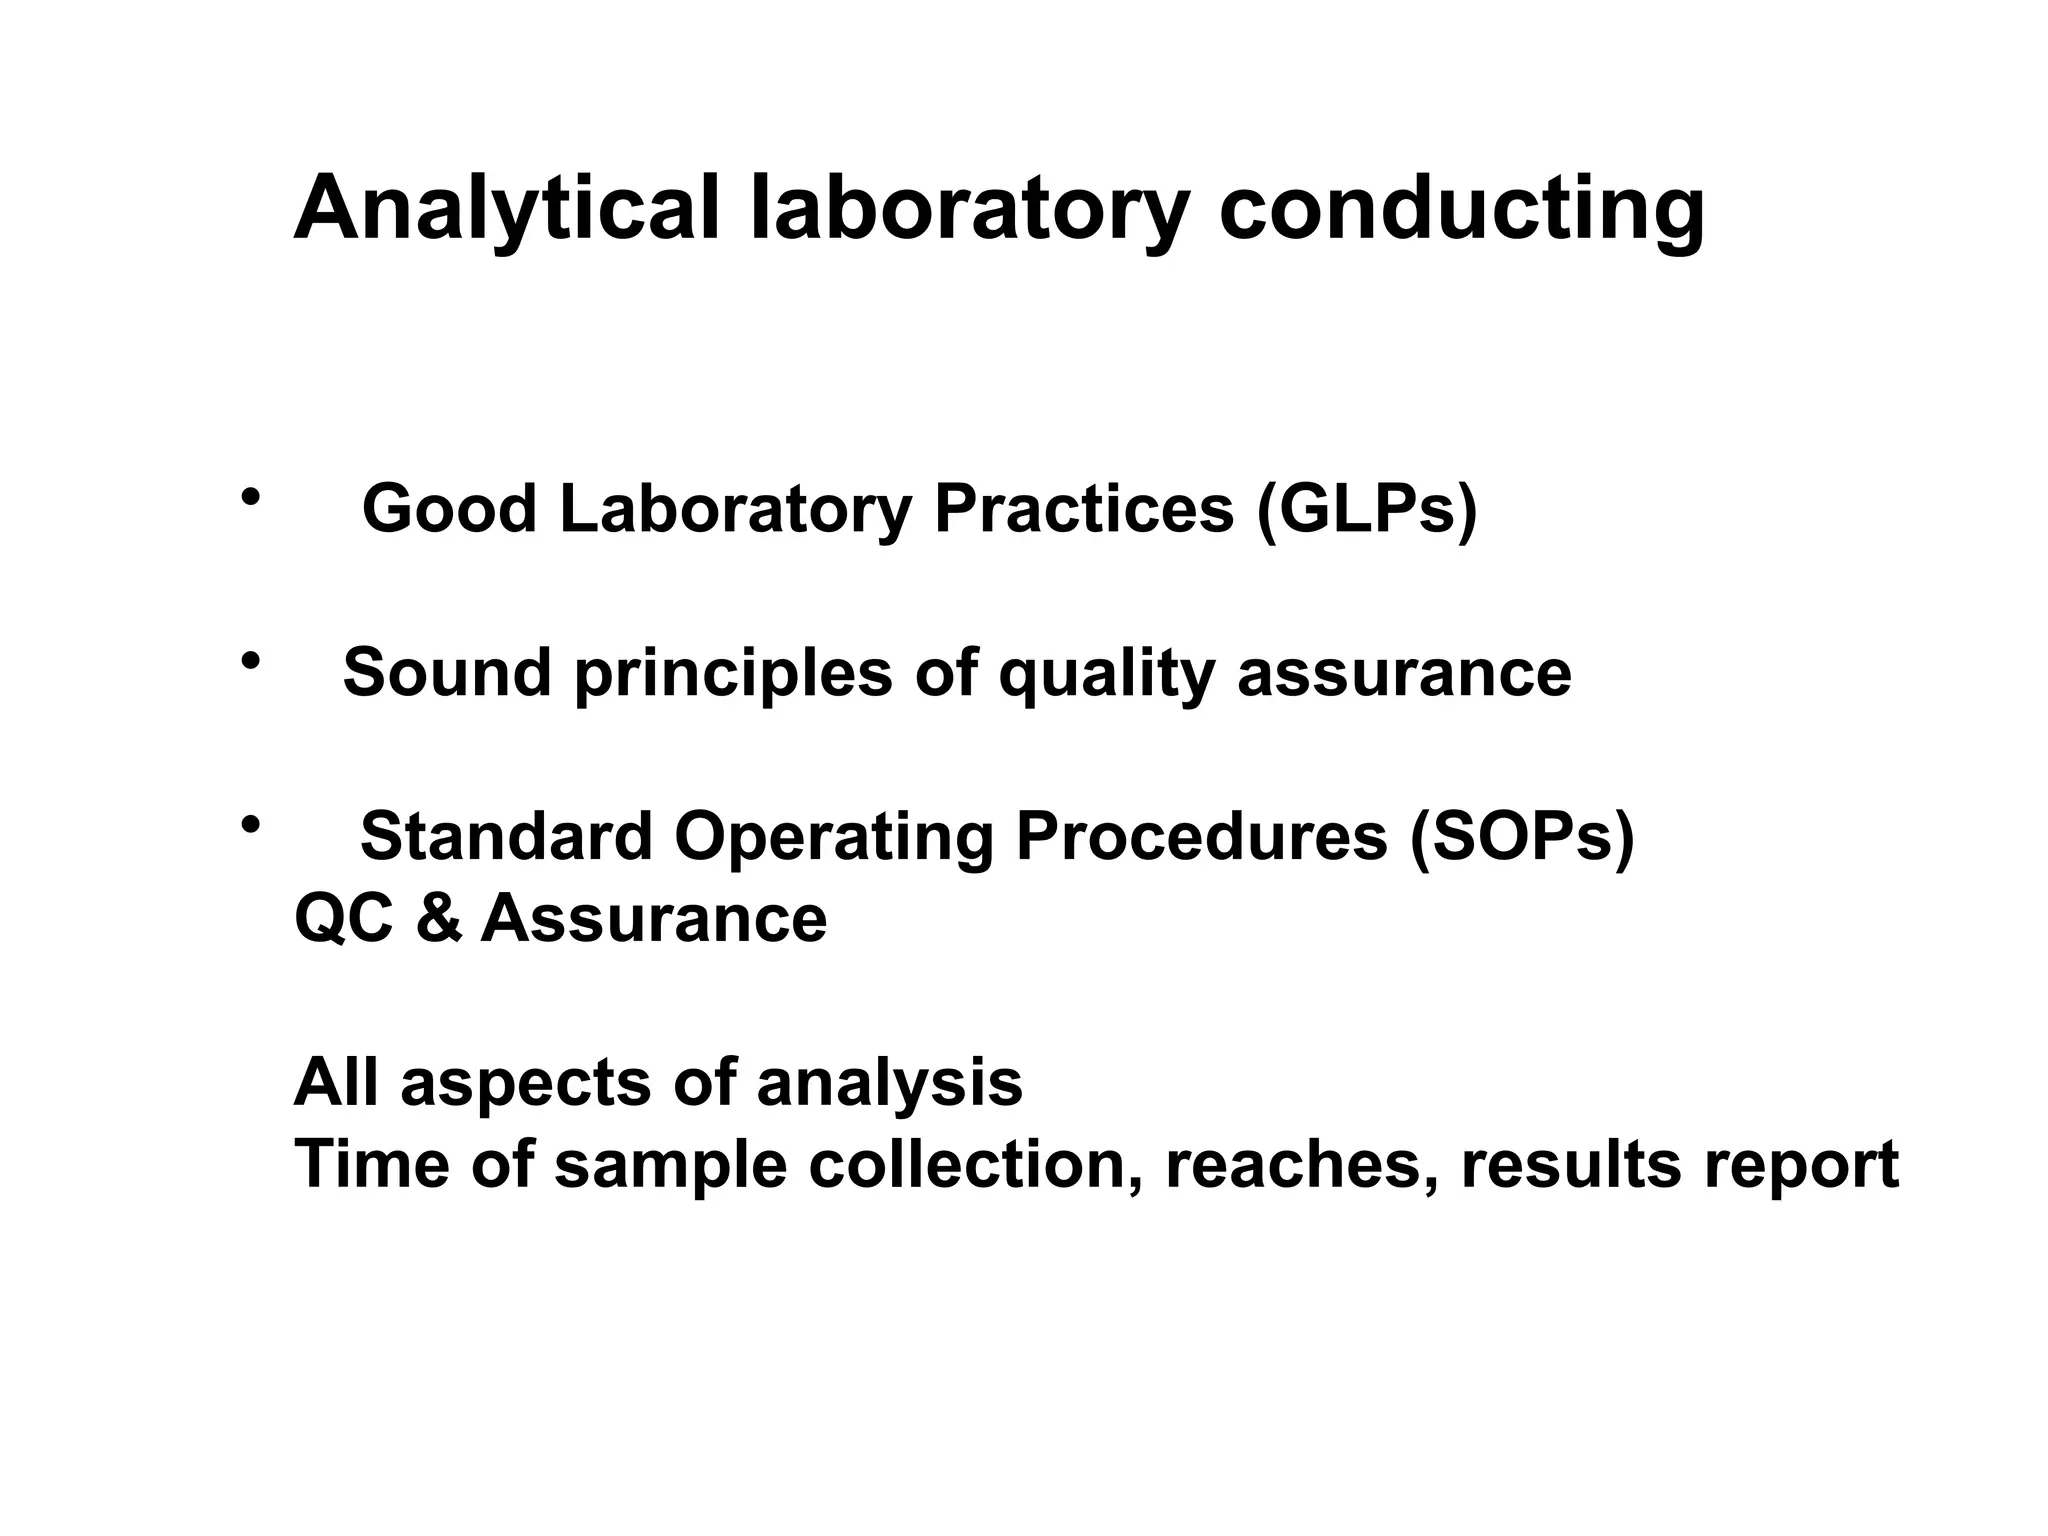
Analytical laboratory conducting
•Good Laboratory Practices (GLPs)
• Sound principles of quality assurance
• Standard Operating Procedures (SOPs)
QC & Assurance
All aspects of analysis
Time of sample collection, reaches, results report
13.
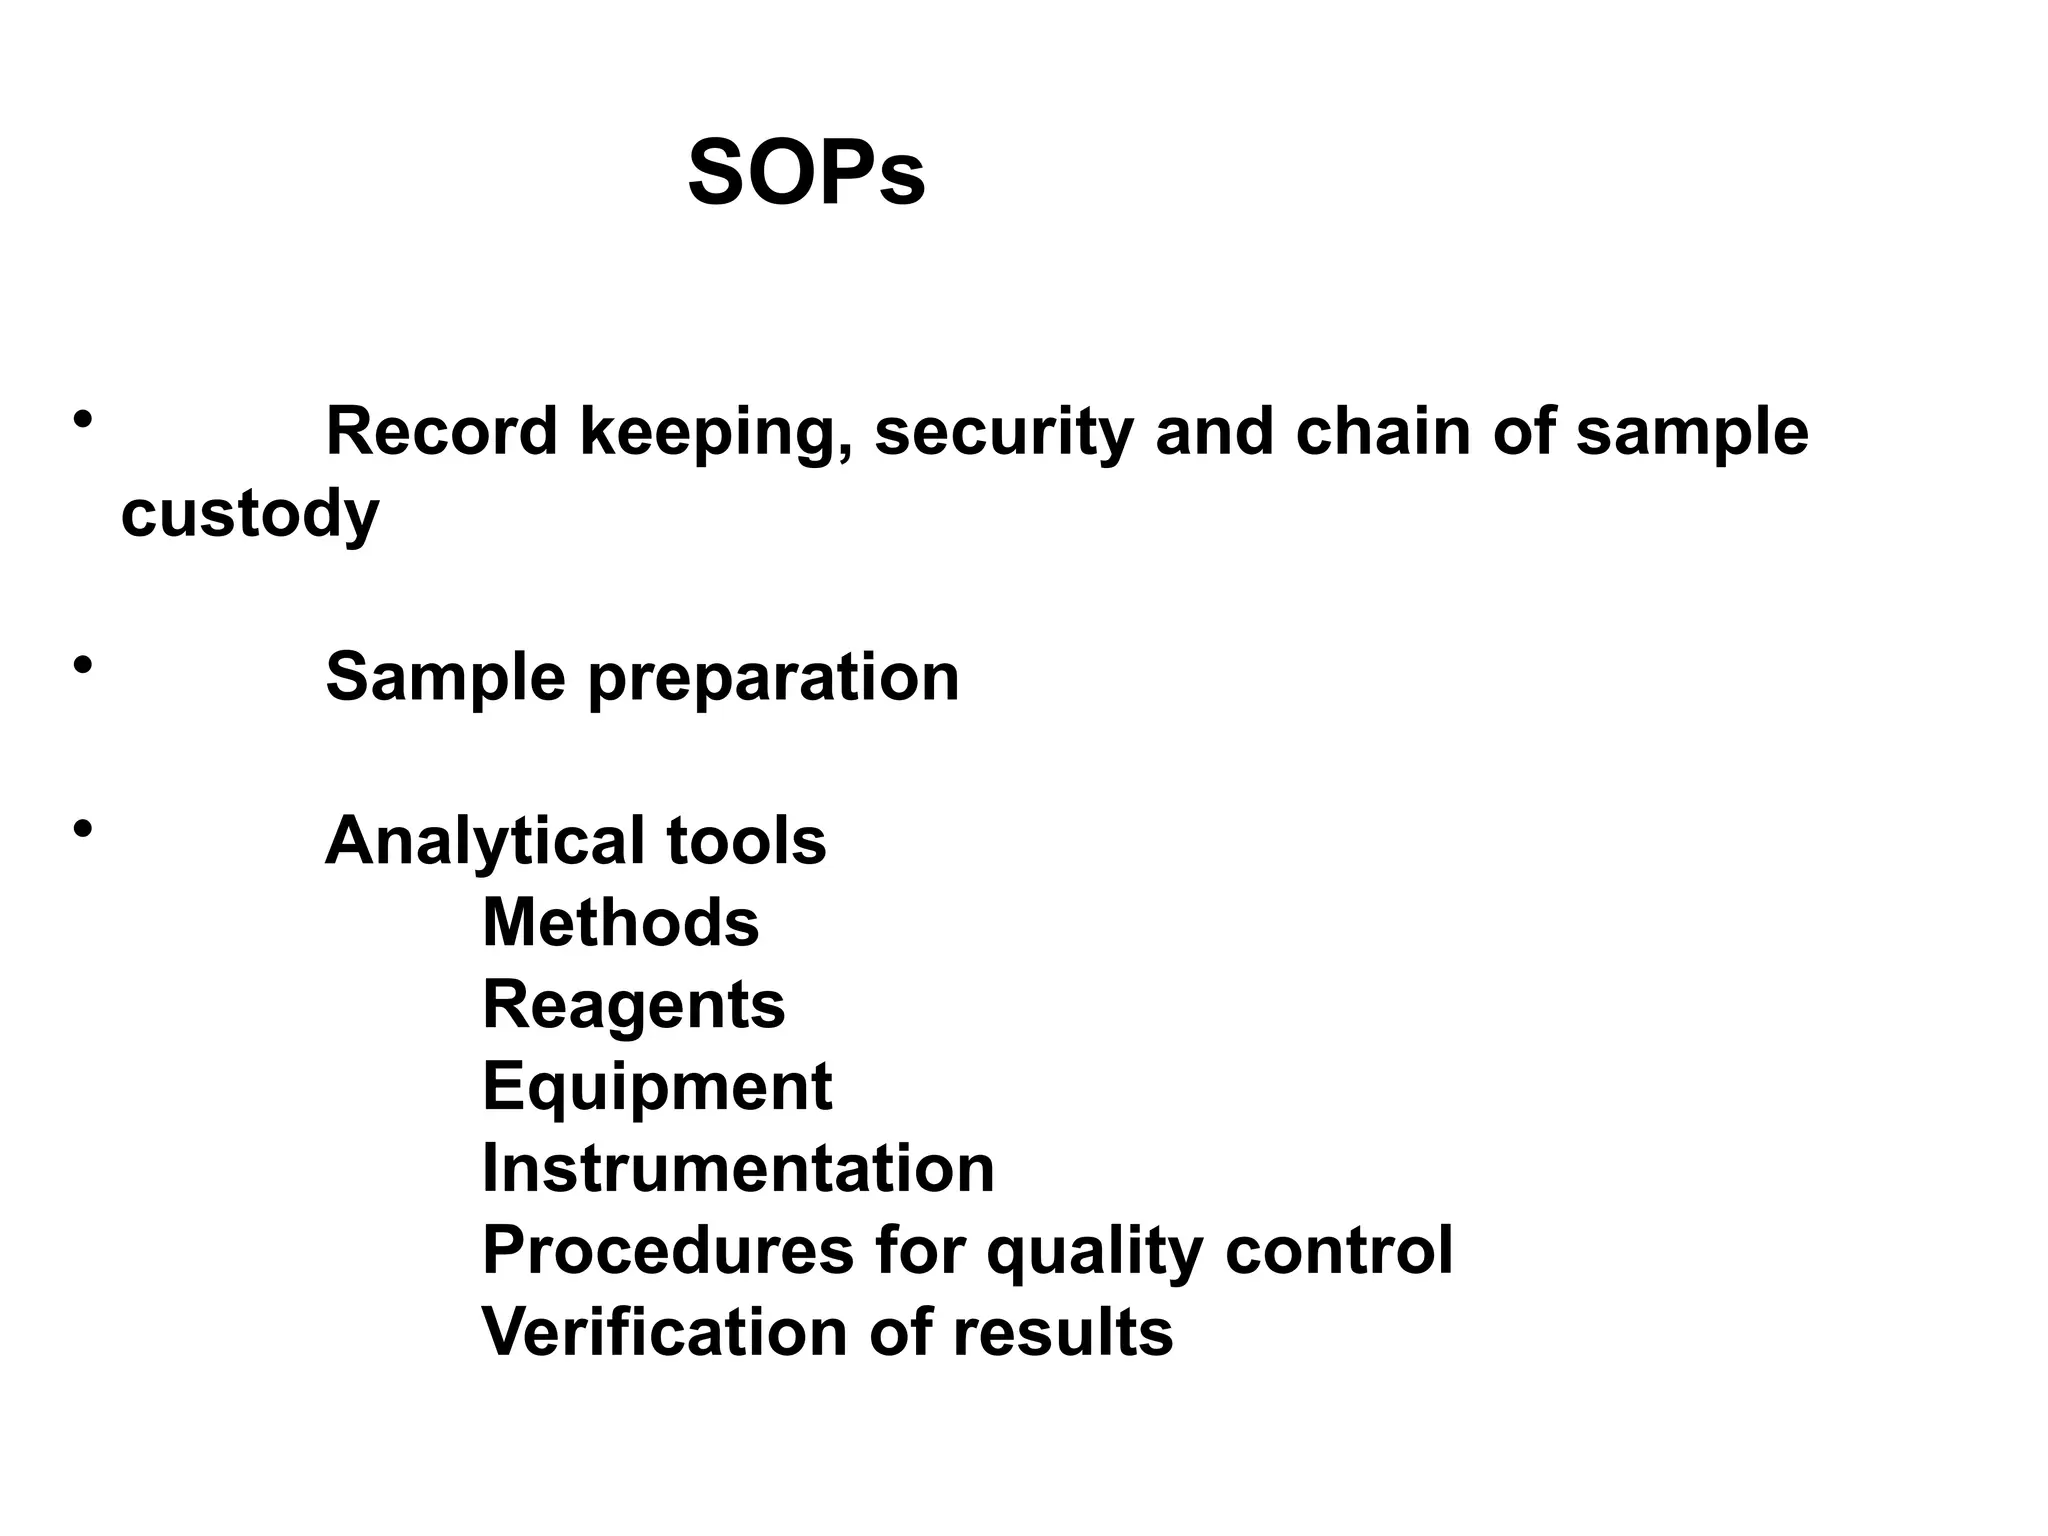
SOPs
• Record keeping,security and chain of sample
custody
• Sample preparation
• Analytical tools
Methods
Reagents
Equipment
Instrumentation
Procedures for quality control
Verification of results
14.
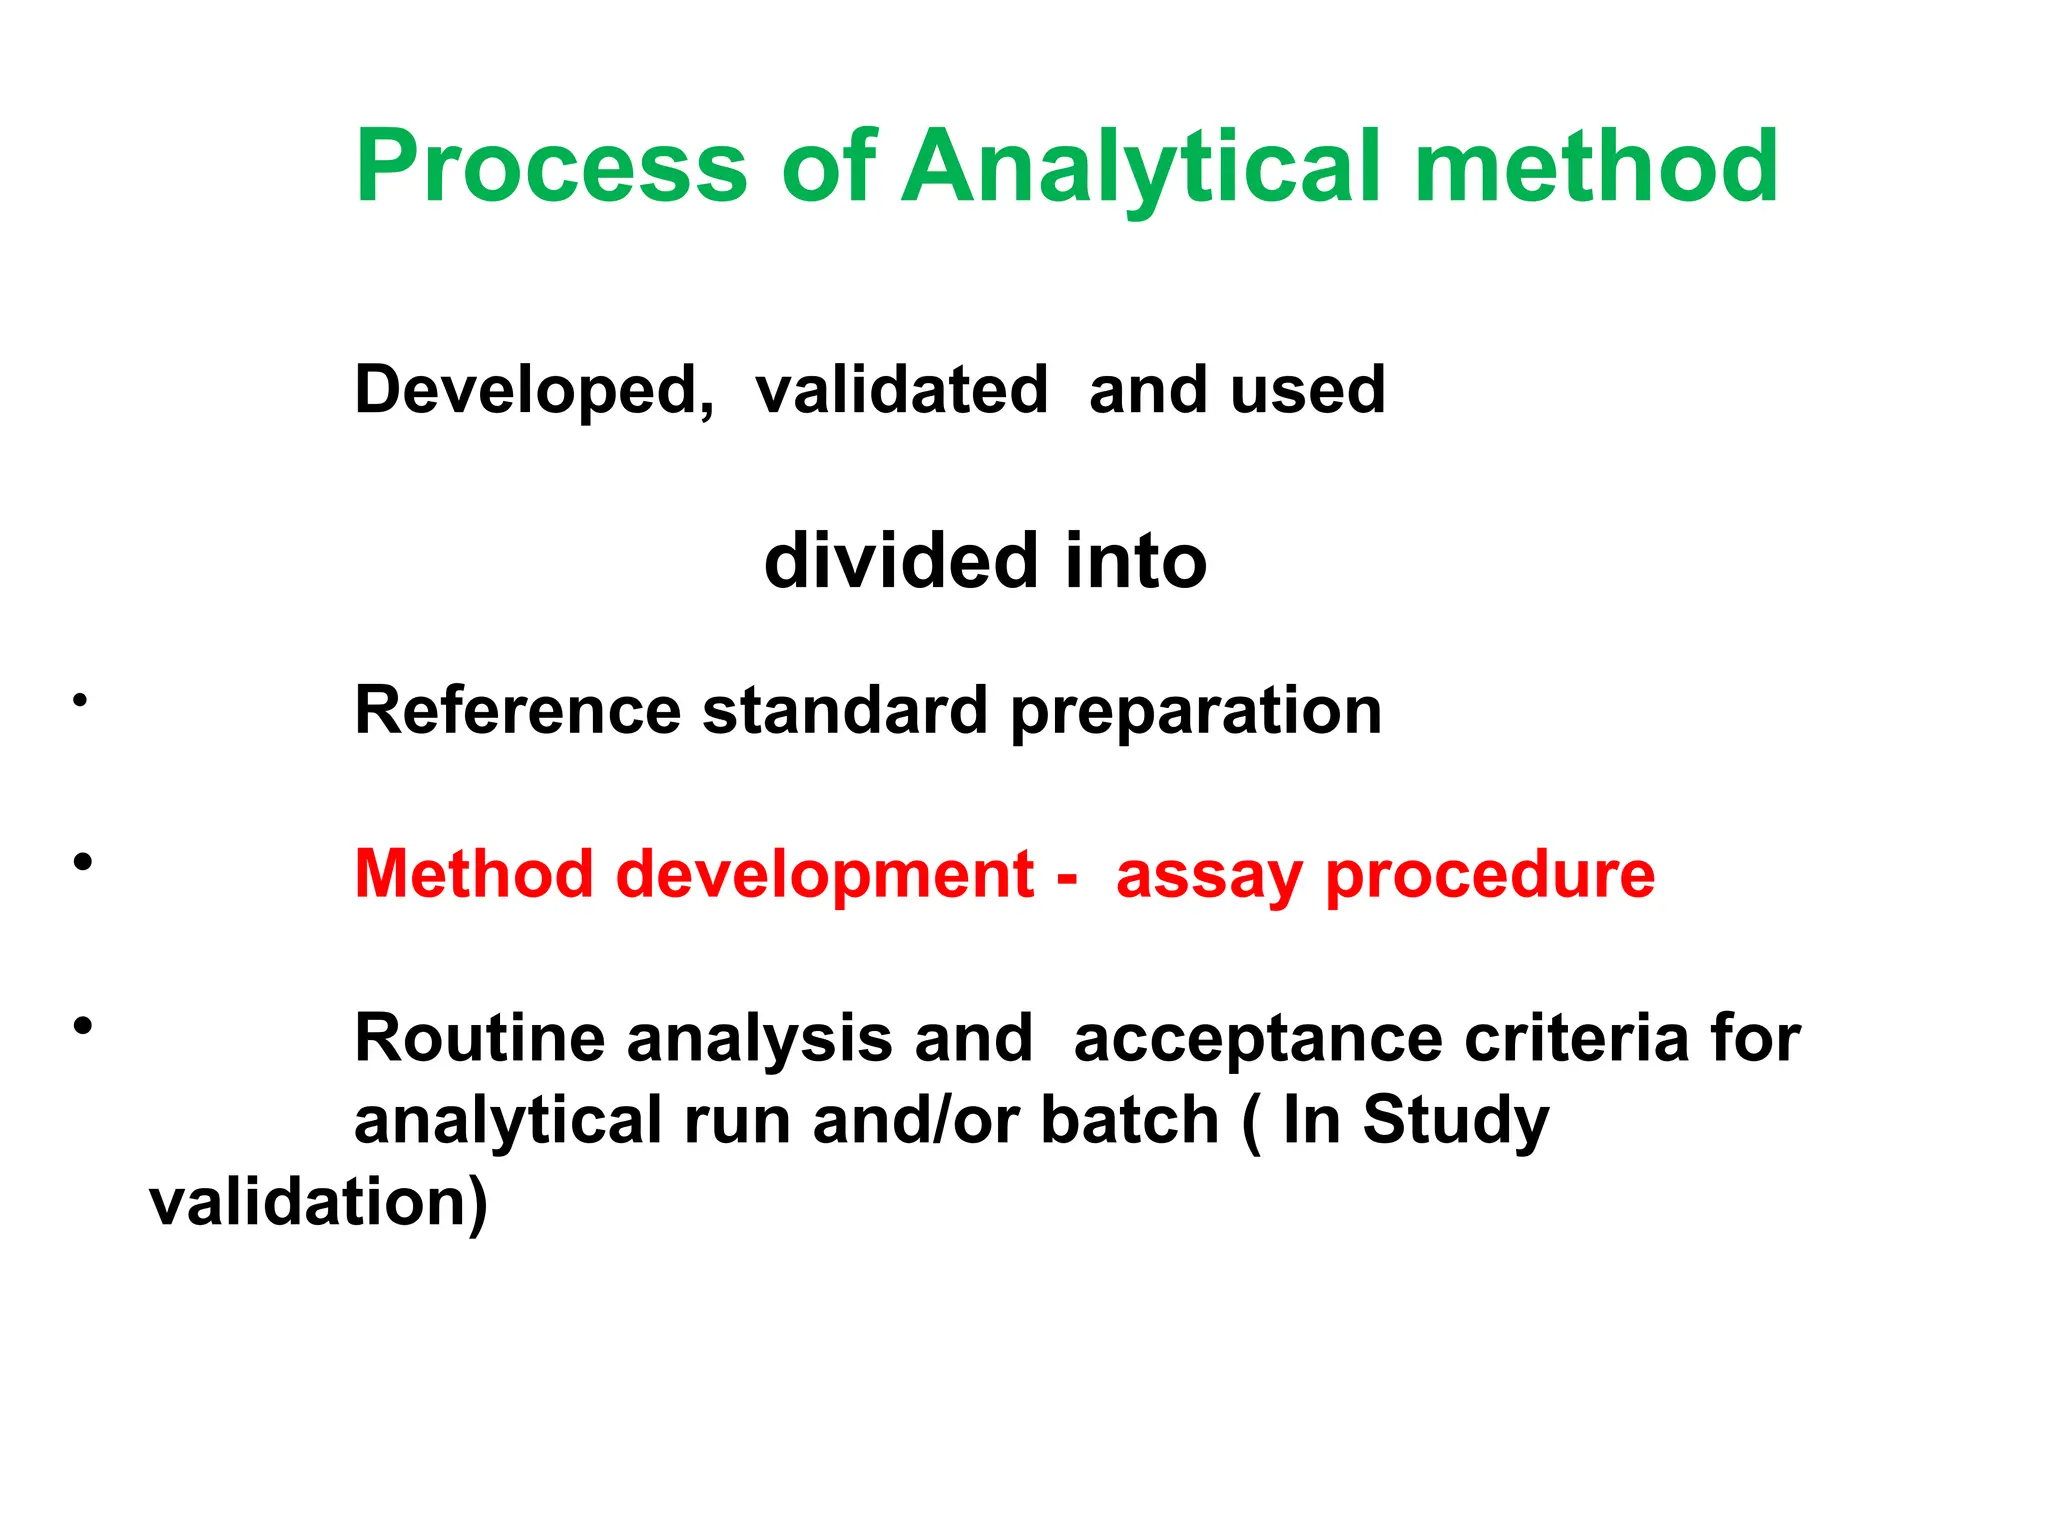
Process of Analyticalmethod
Developed, validated and used
divided into
• Reference standard preparation
• Method development - assay procedure
• Routine analysis and acceptance criteria for
analytical run and/or batch ( In Study
validation)
15.
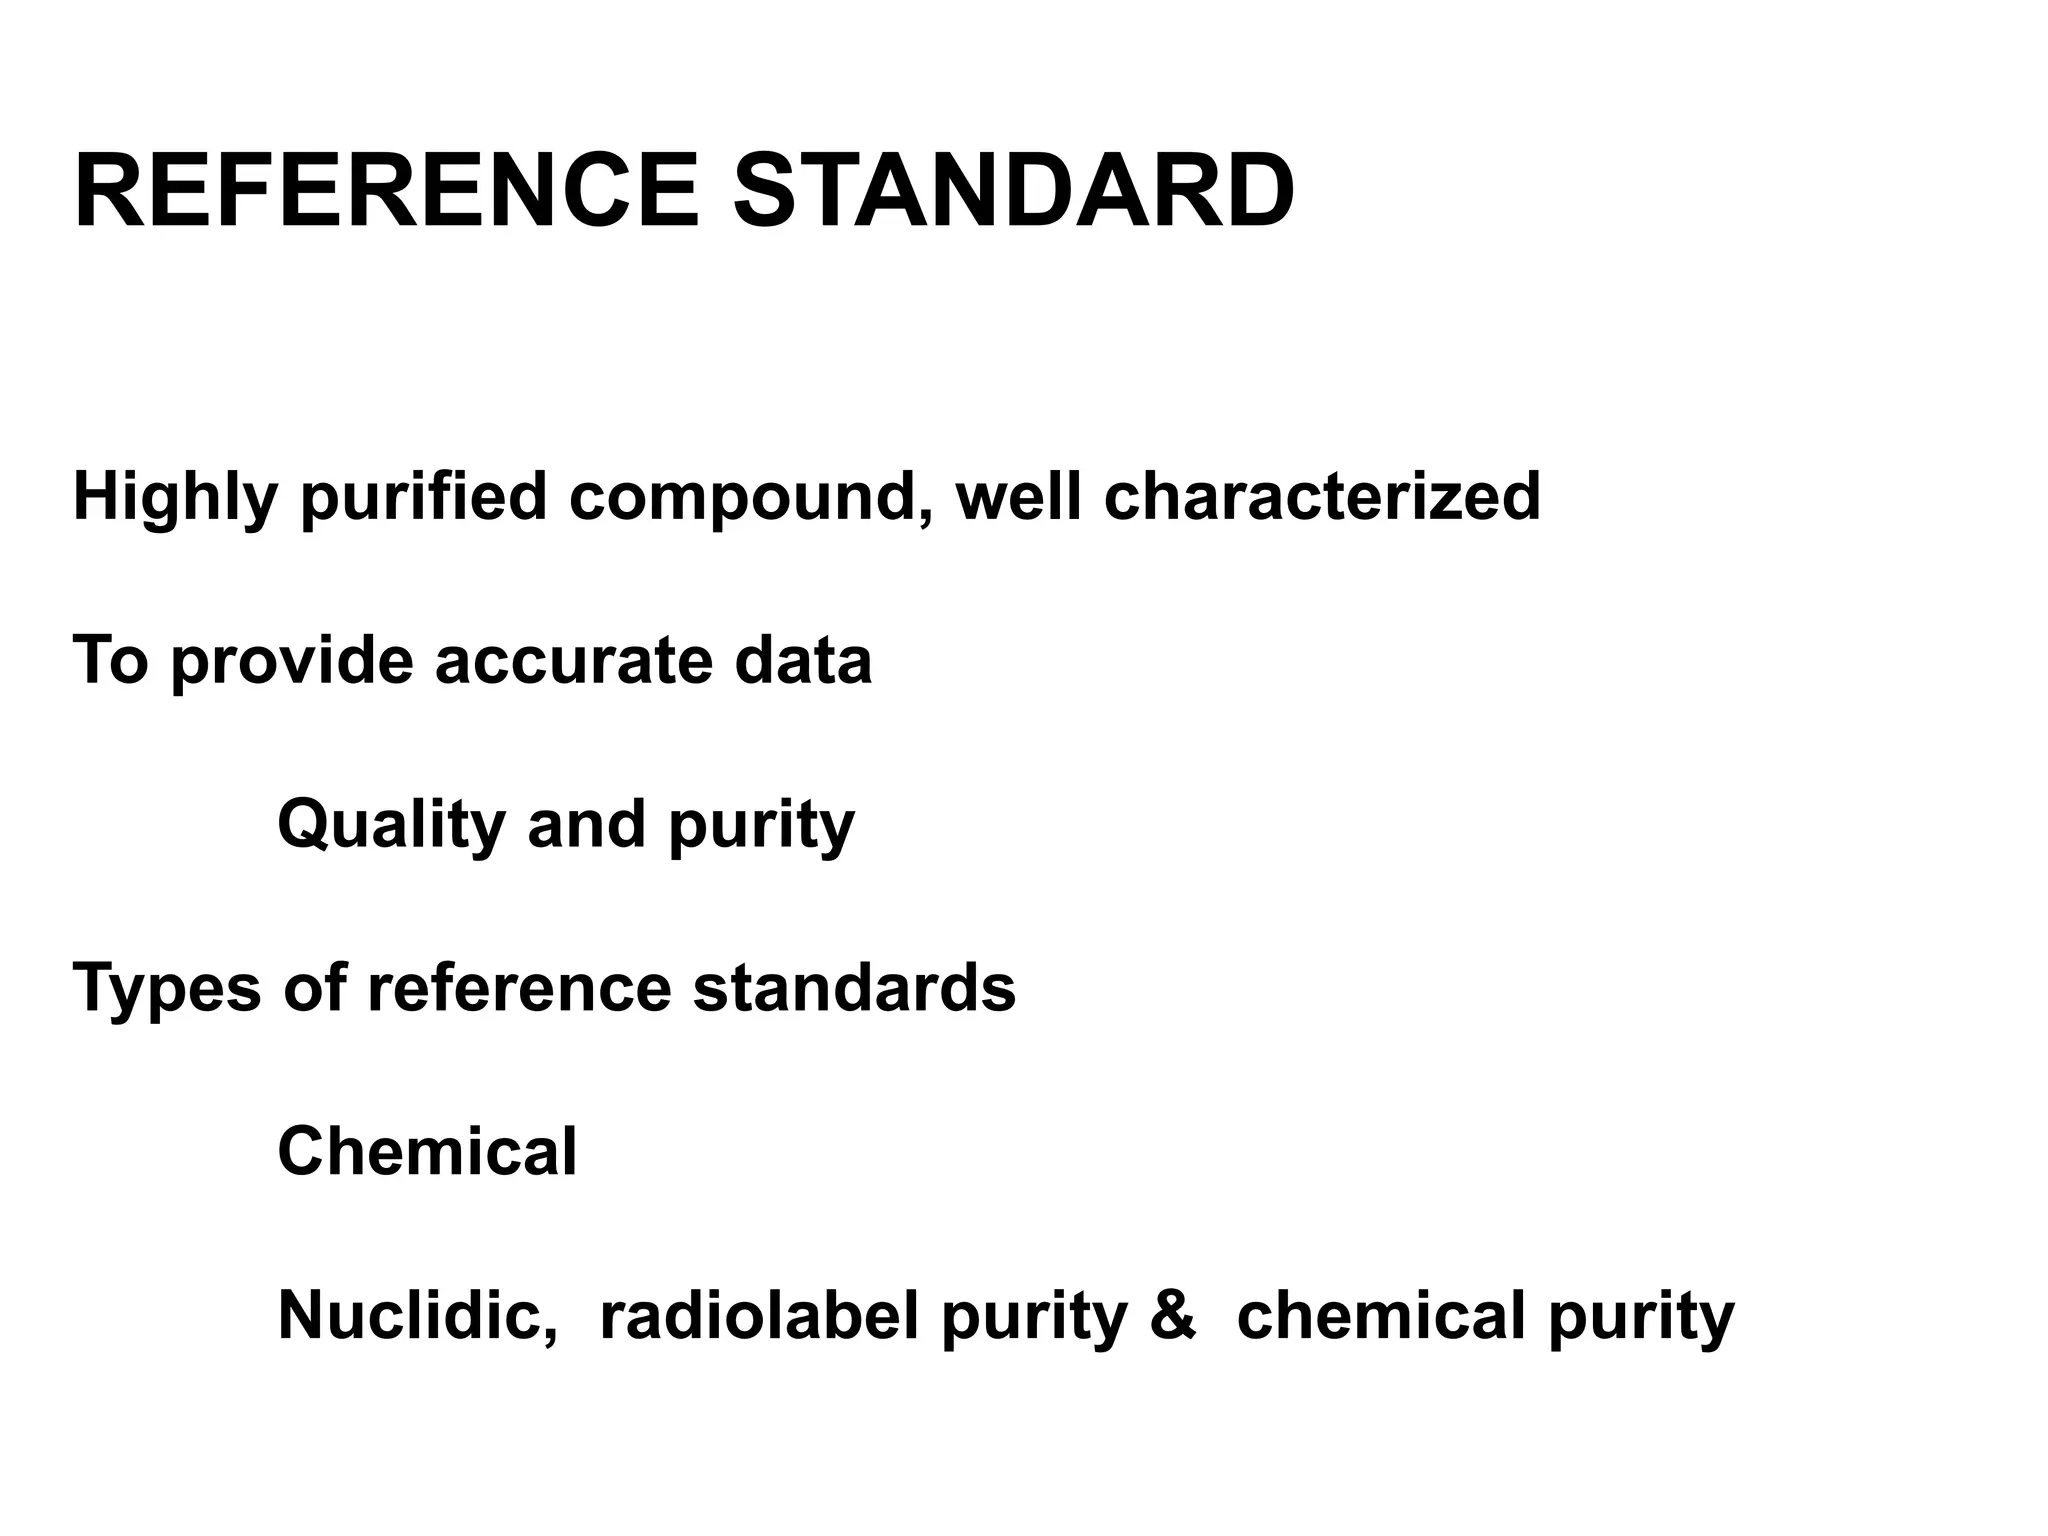
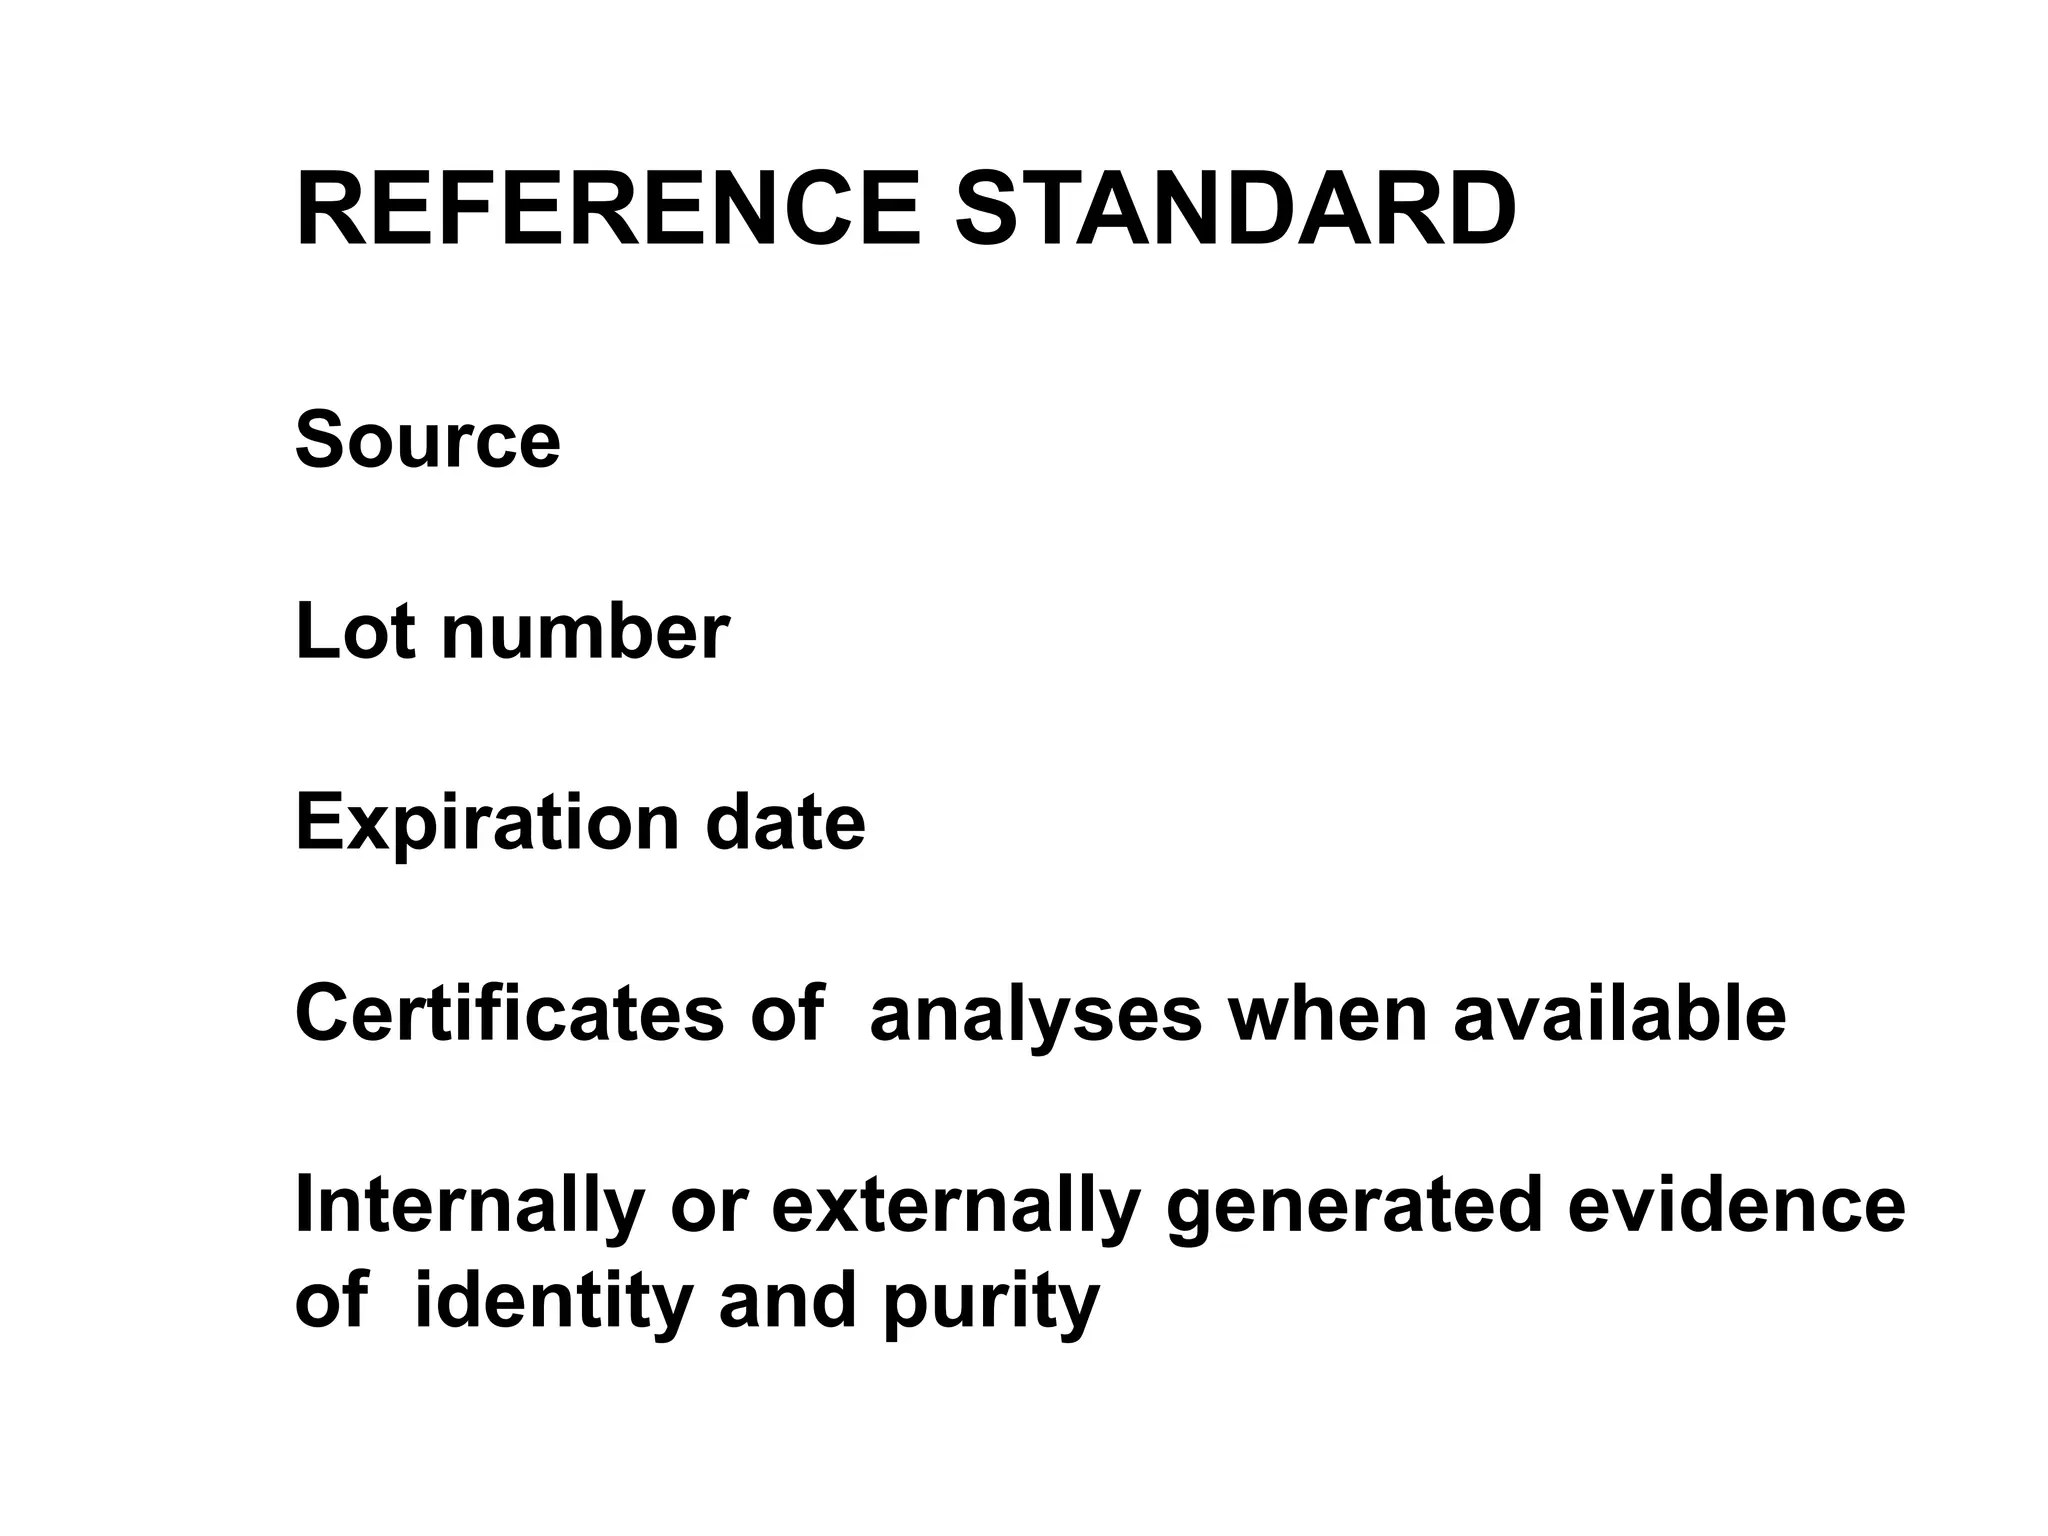
REFERENCE STANDARD
Highly purifiedcompound, well characterized
To provide accurate data
Quality and purity
Types of reference standards
Chemical
Nuclidic, radiolabel purity & chemical purity
16.
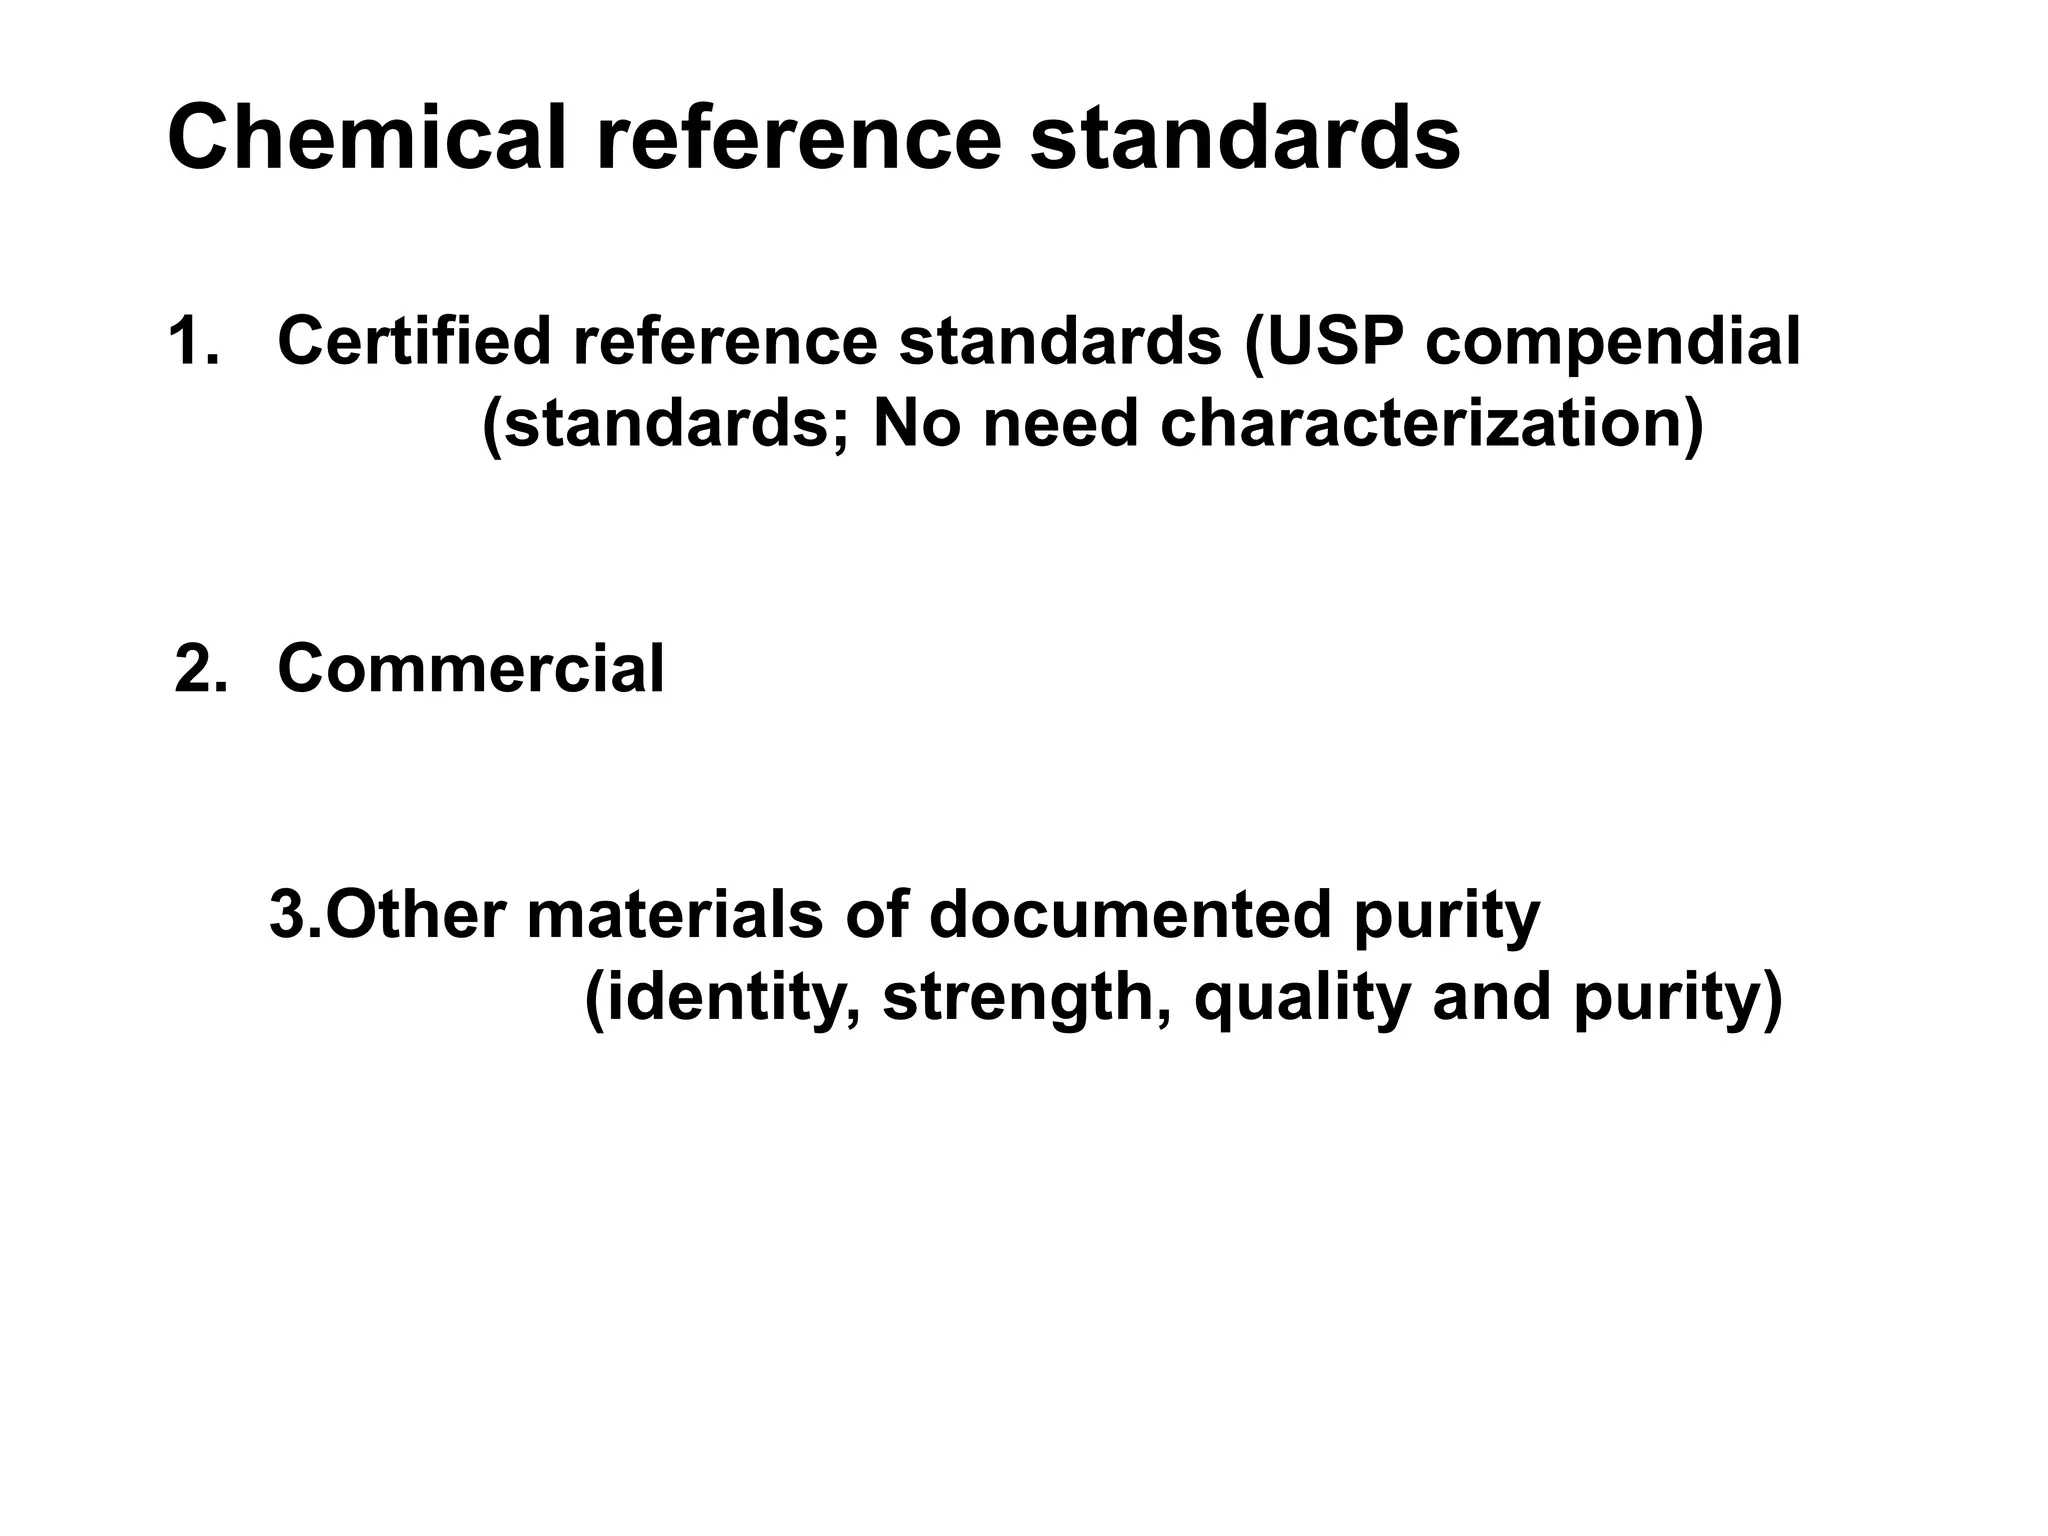
Chemical reference standards
1.Certified reference standards (USP compendial
(standards; No need characterization)
2. Commercial
3.Other materials of documented purity
(identity, strength, quality and purity)
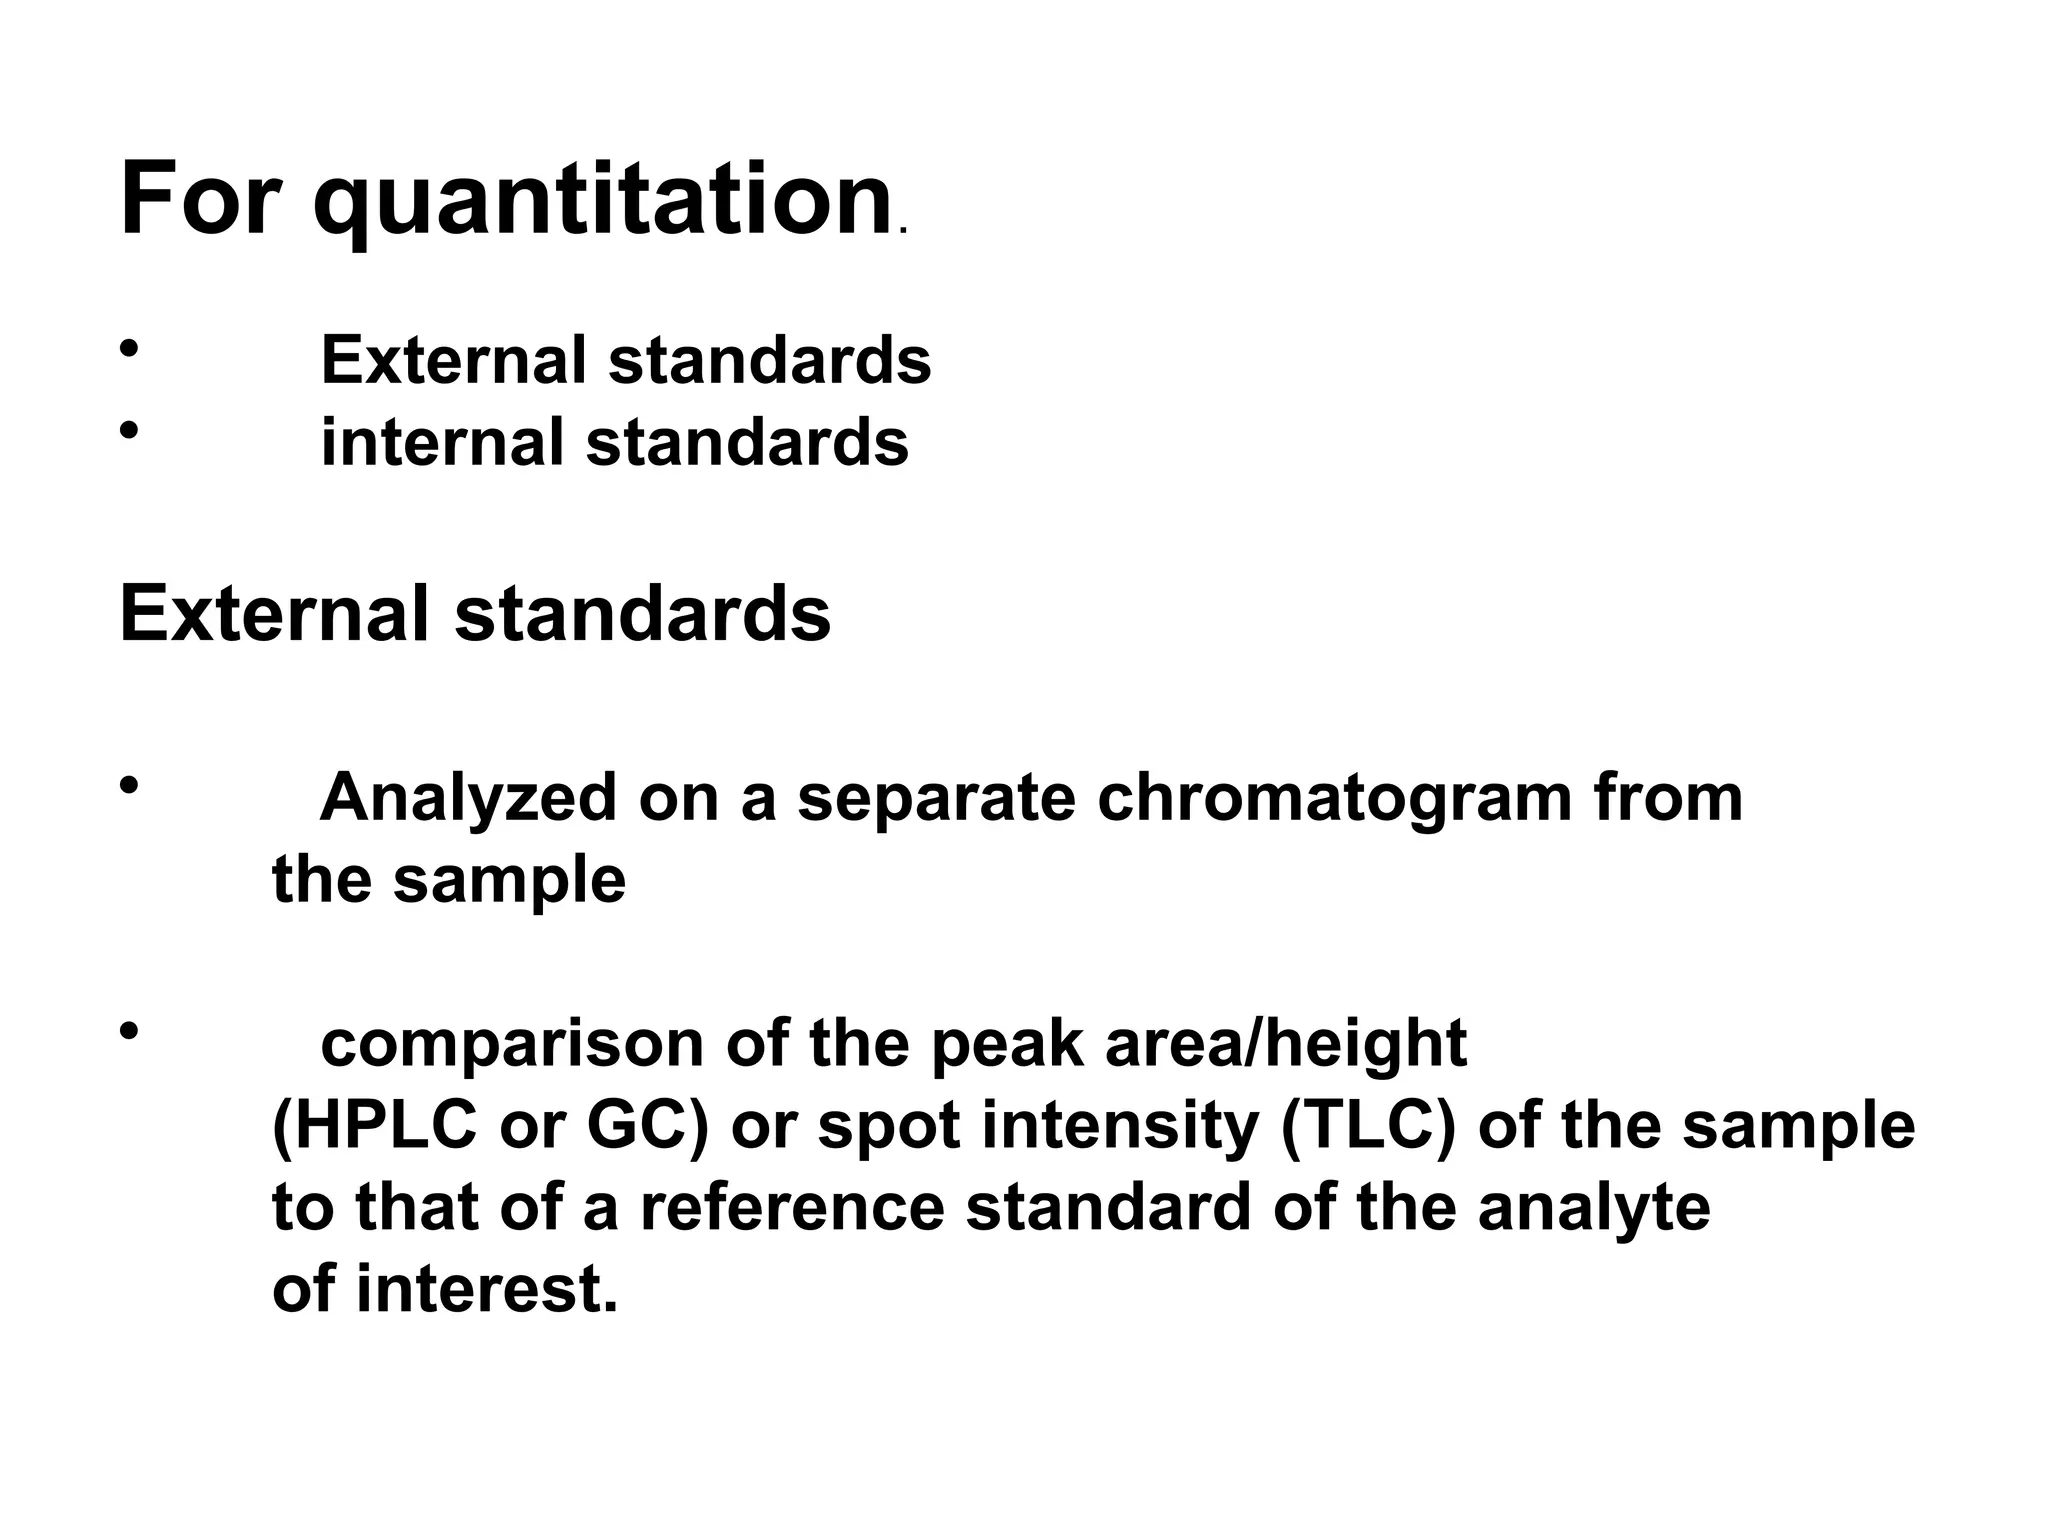
For quantitation.
• Externalstandards
• internal standards
External standards
• Analyzed on a separate chromatogram from
the sample
• comparison of the peak area/height
(HPLC or GC) or spot intensity (TLC) of the sample
to that of a reference standard of the analyte
of interest.
19.
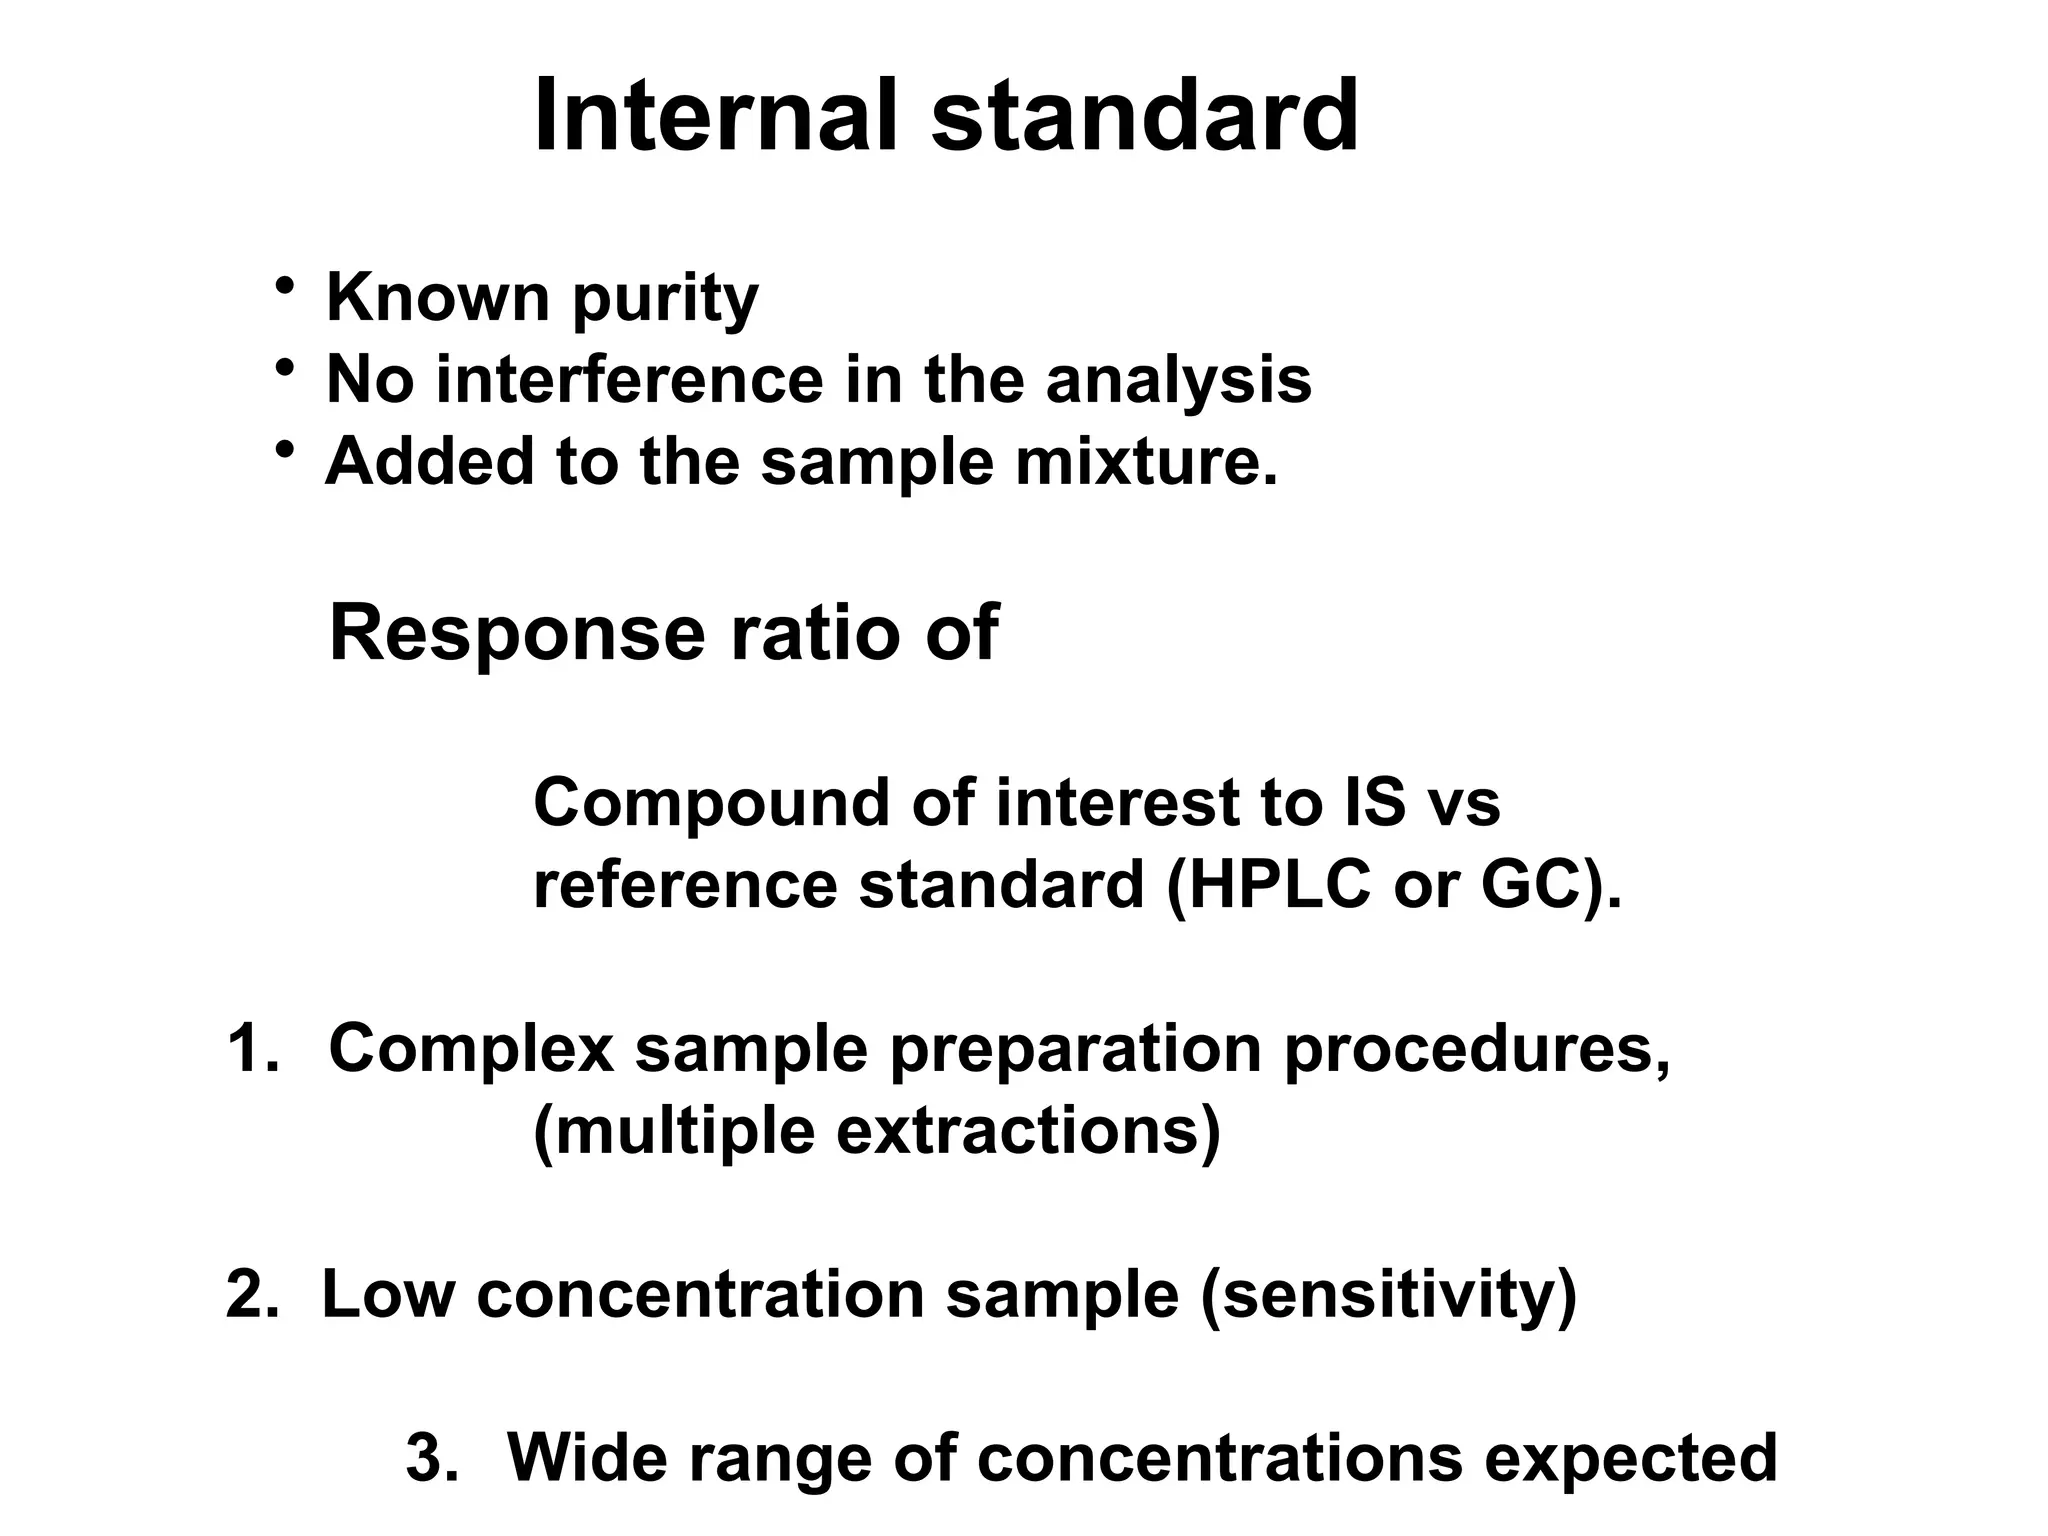
Internal standard
• Knownpurity
• No interference in the analysis
• Added to the sample mixture.
Response ratio of
Compound of interest to IS vs
reference standard (HPLC or GC).
1. Complex sample preparation procedures,
(multiple extractions)
2. Low concentration sample (sensitivity)
3. Wide range of concentrations expected
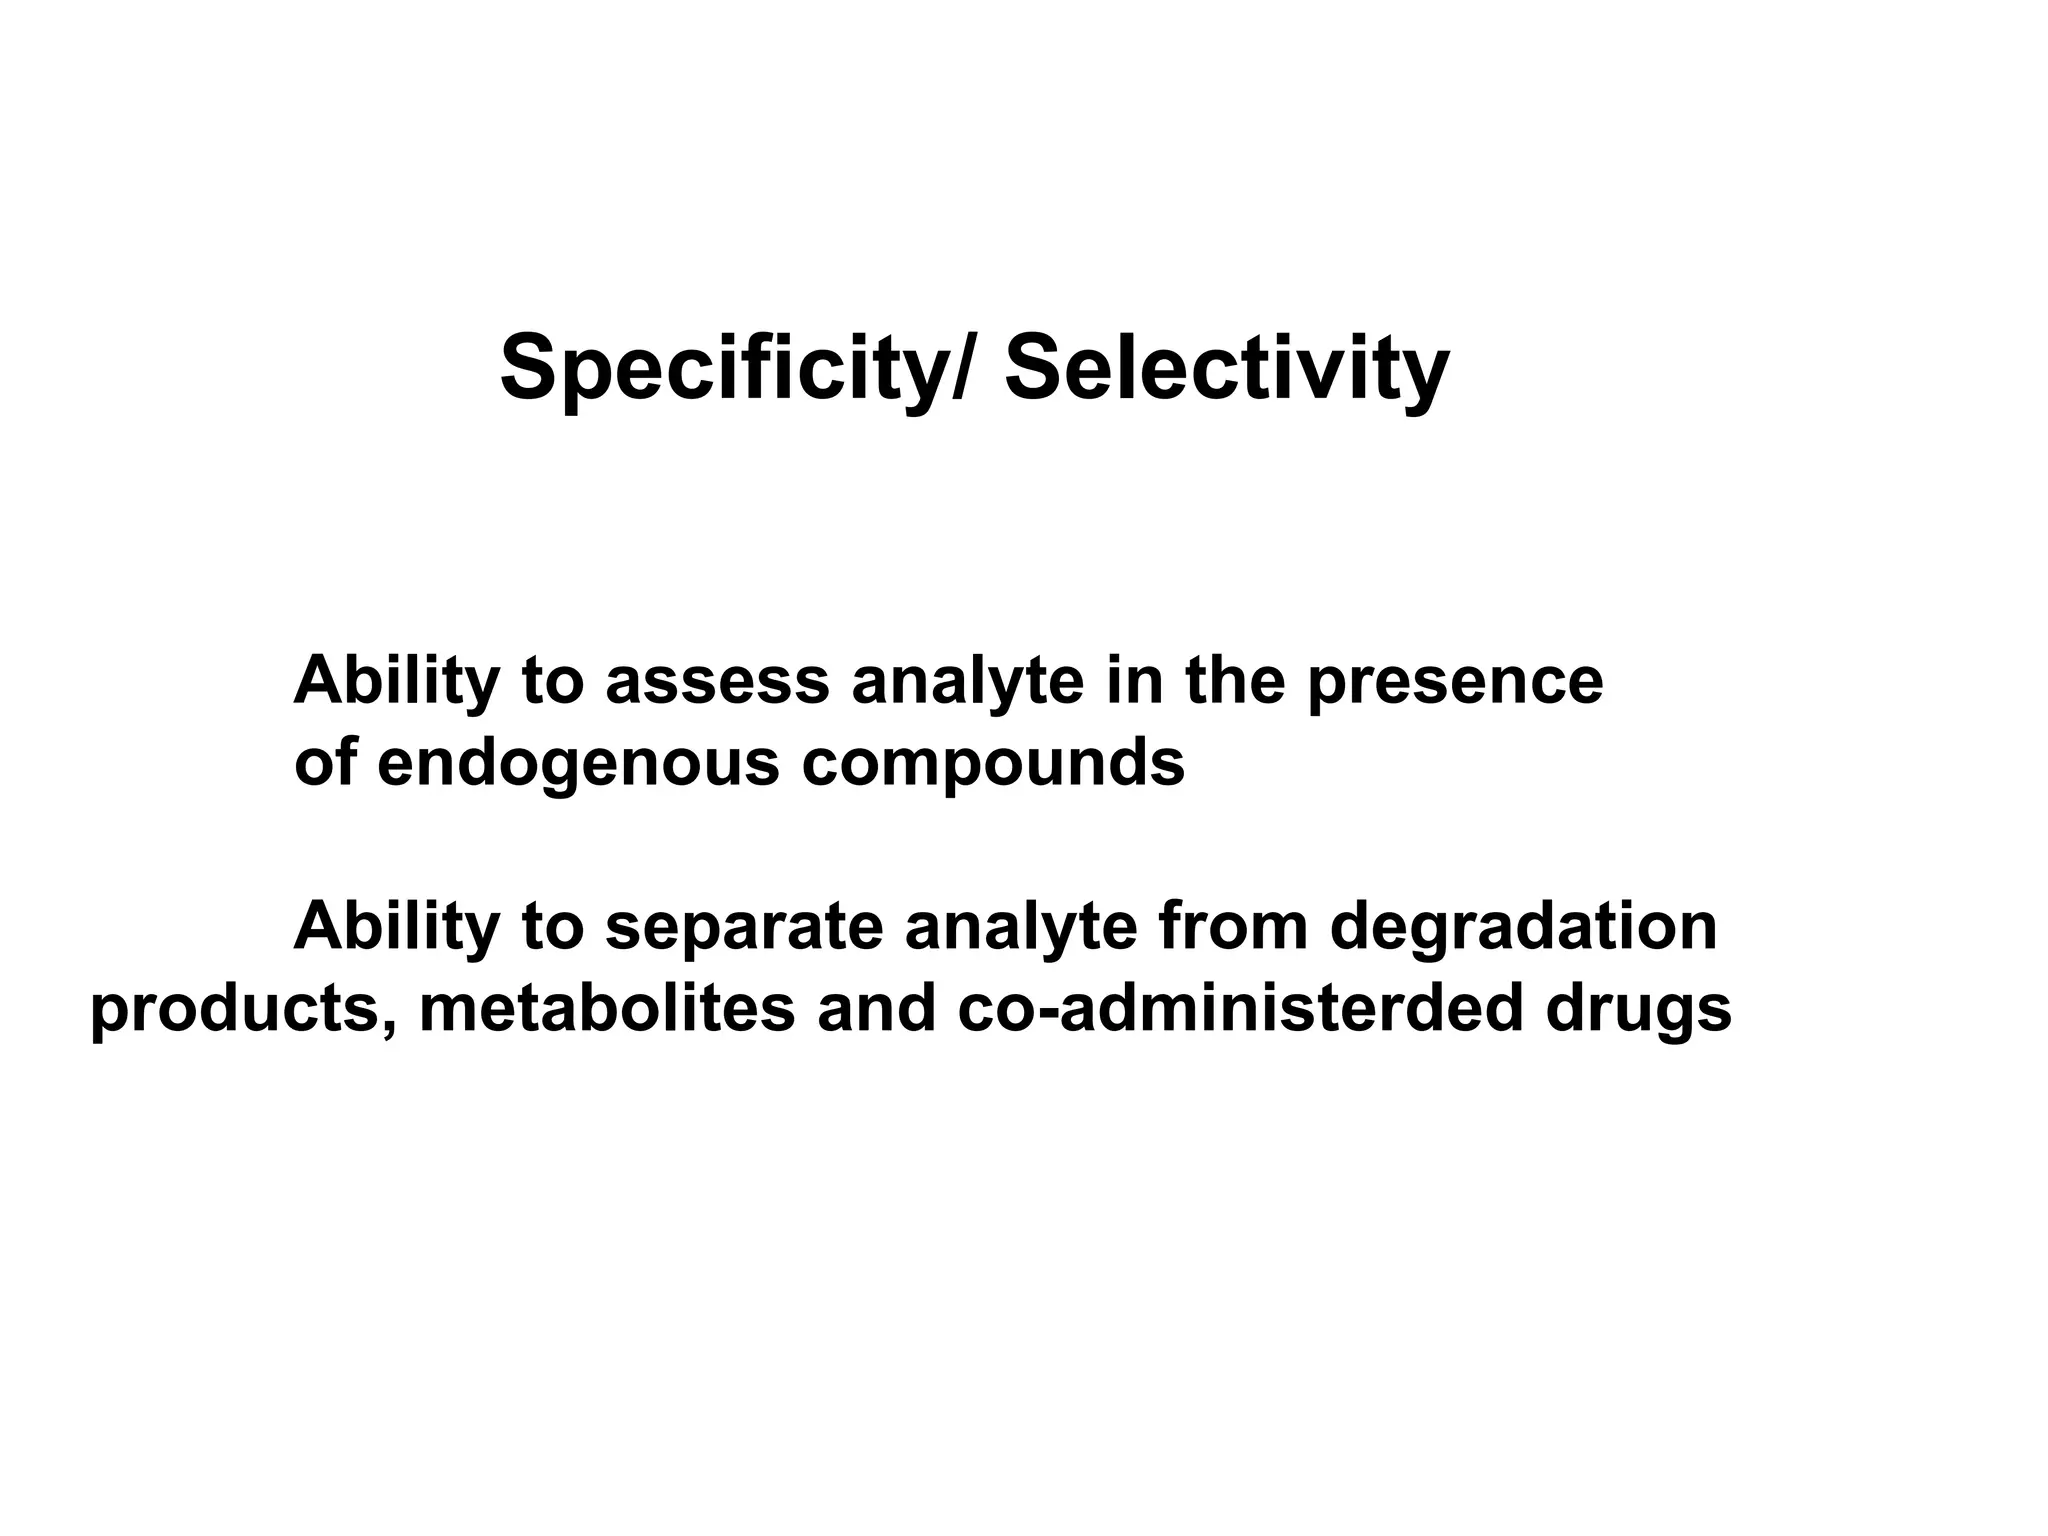
Specificity/ Selectivity
Ability toassess analyte in the presence
of endogenous compounds
Ability to separate analyte from degradation
products, metabolites and co-administerded drugs
22.
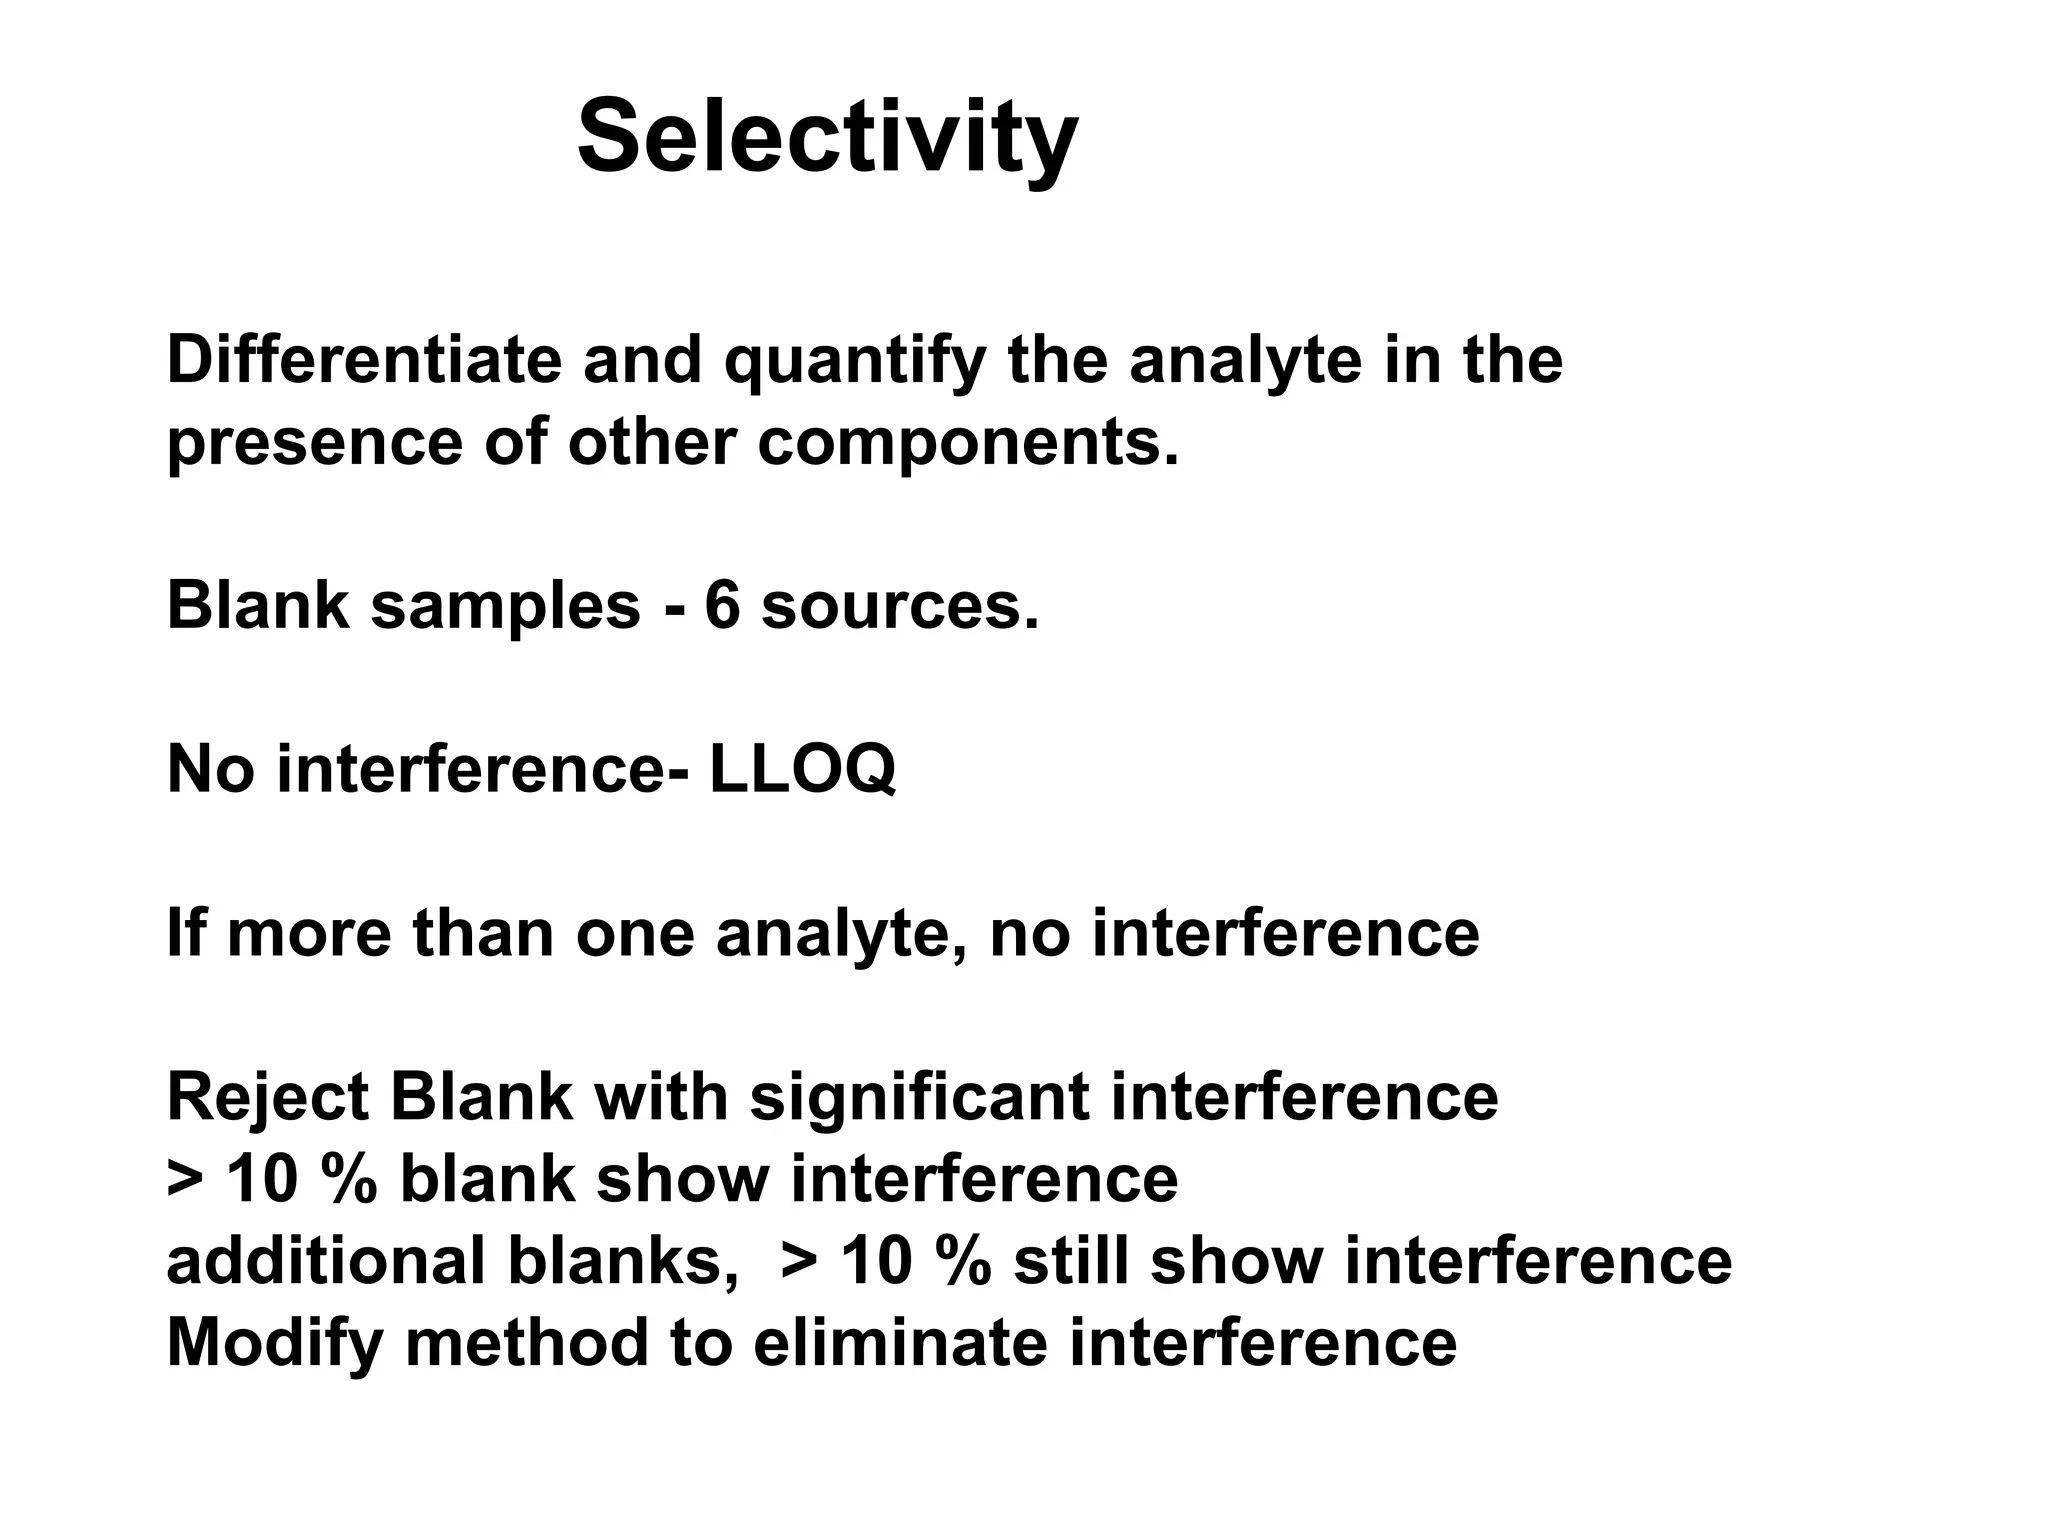
Selectivity
Differentiate and quantifythe analyte in the
presence of other components.
Blank samples - 6 sources.
No interference- LLOQ
If more than one analyte, no interference
Reject Blank with significant interference
> 10 % blank show interference
additional blanks, > 10 % still show interference
Modify method to eliminate interference
23.
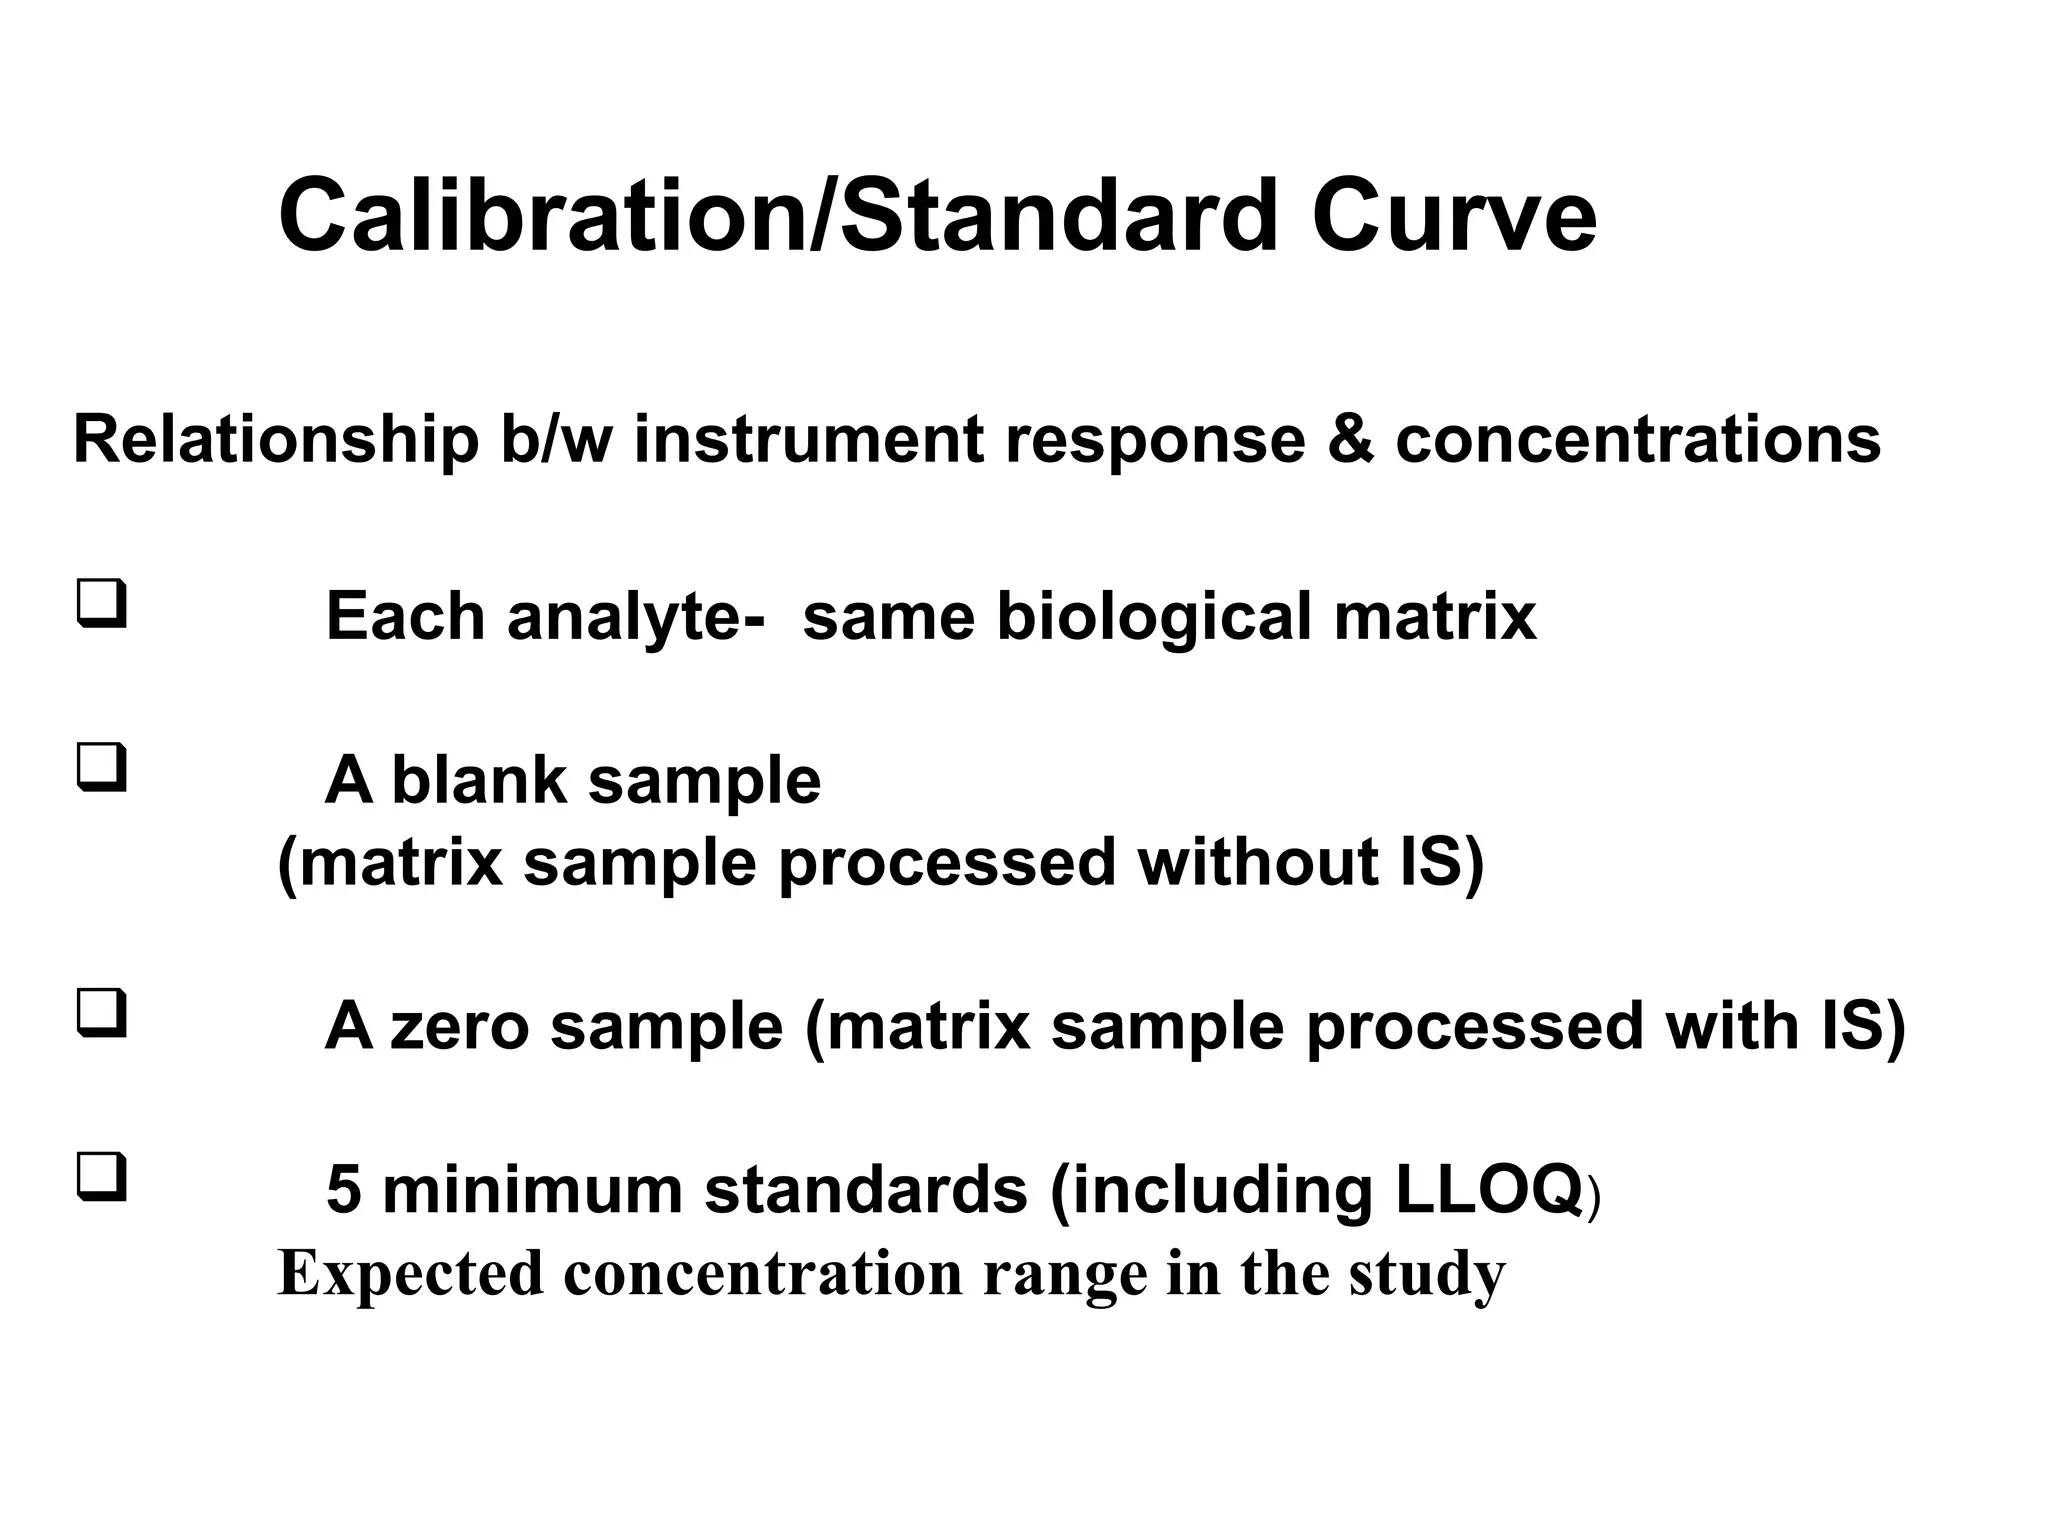
Calibration/Standard Curve
Relationship b/winstrument response & concentrations
Each analyte- same biological matrix
A blank sample
(matrix sample processed without IS)
A zero sample (matrix sample processed with IS)
5 minimum standards (including LLOQ)
Expected concentration range in the study
24.
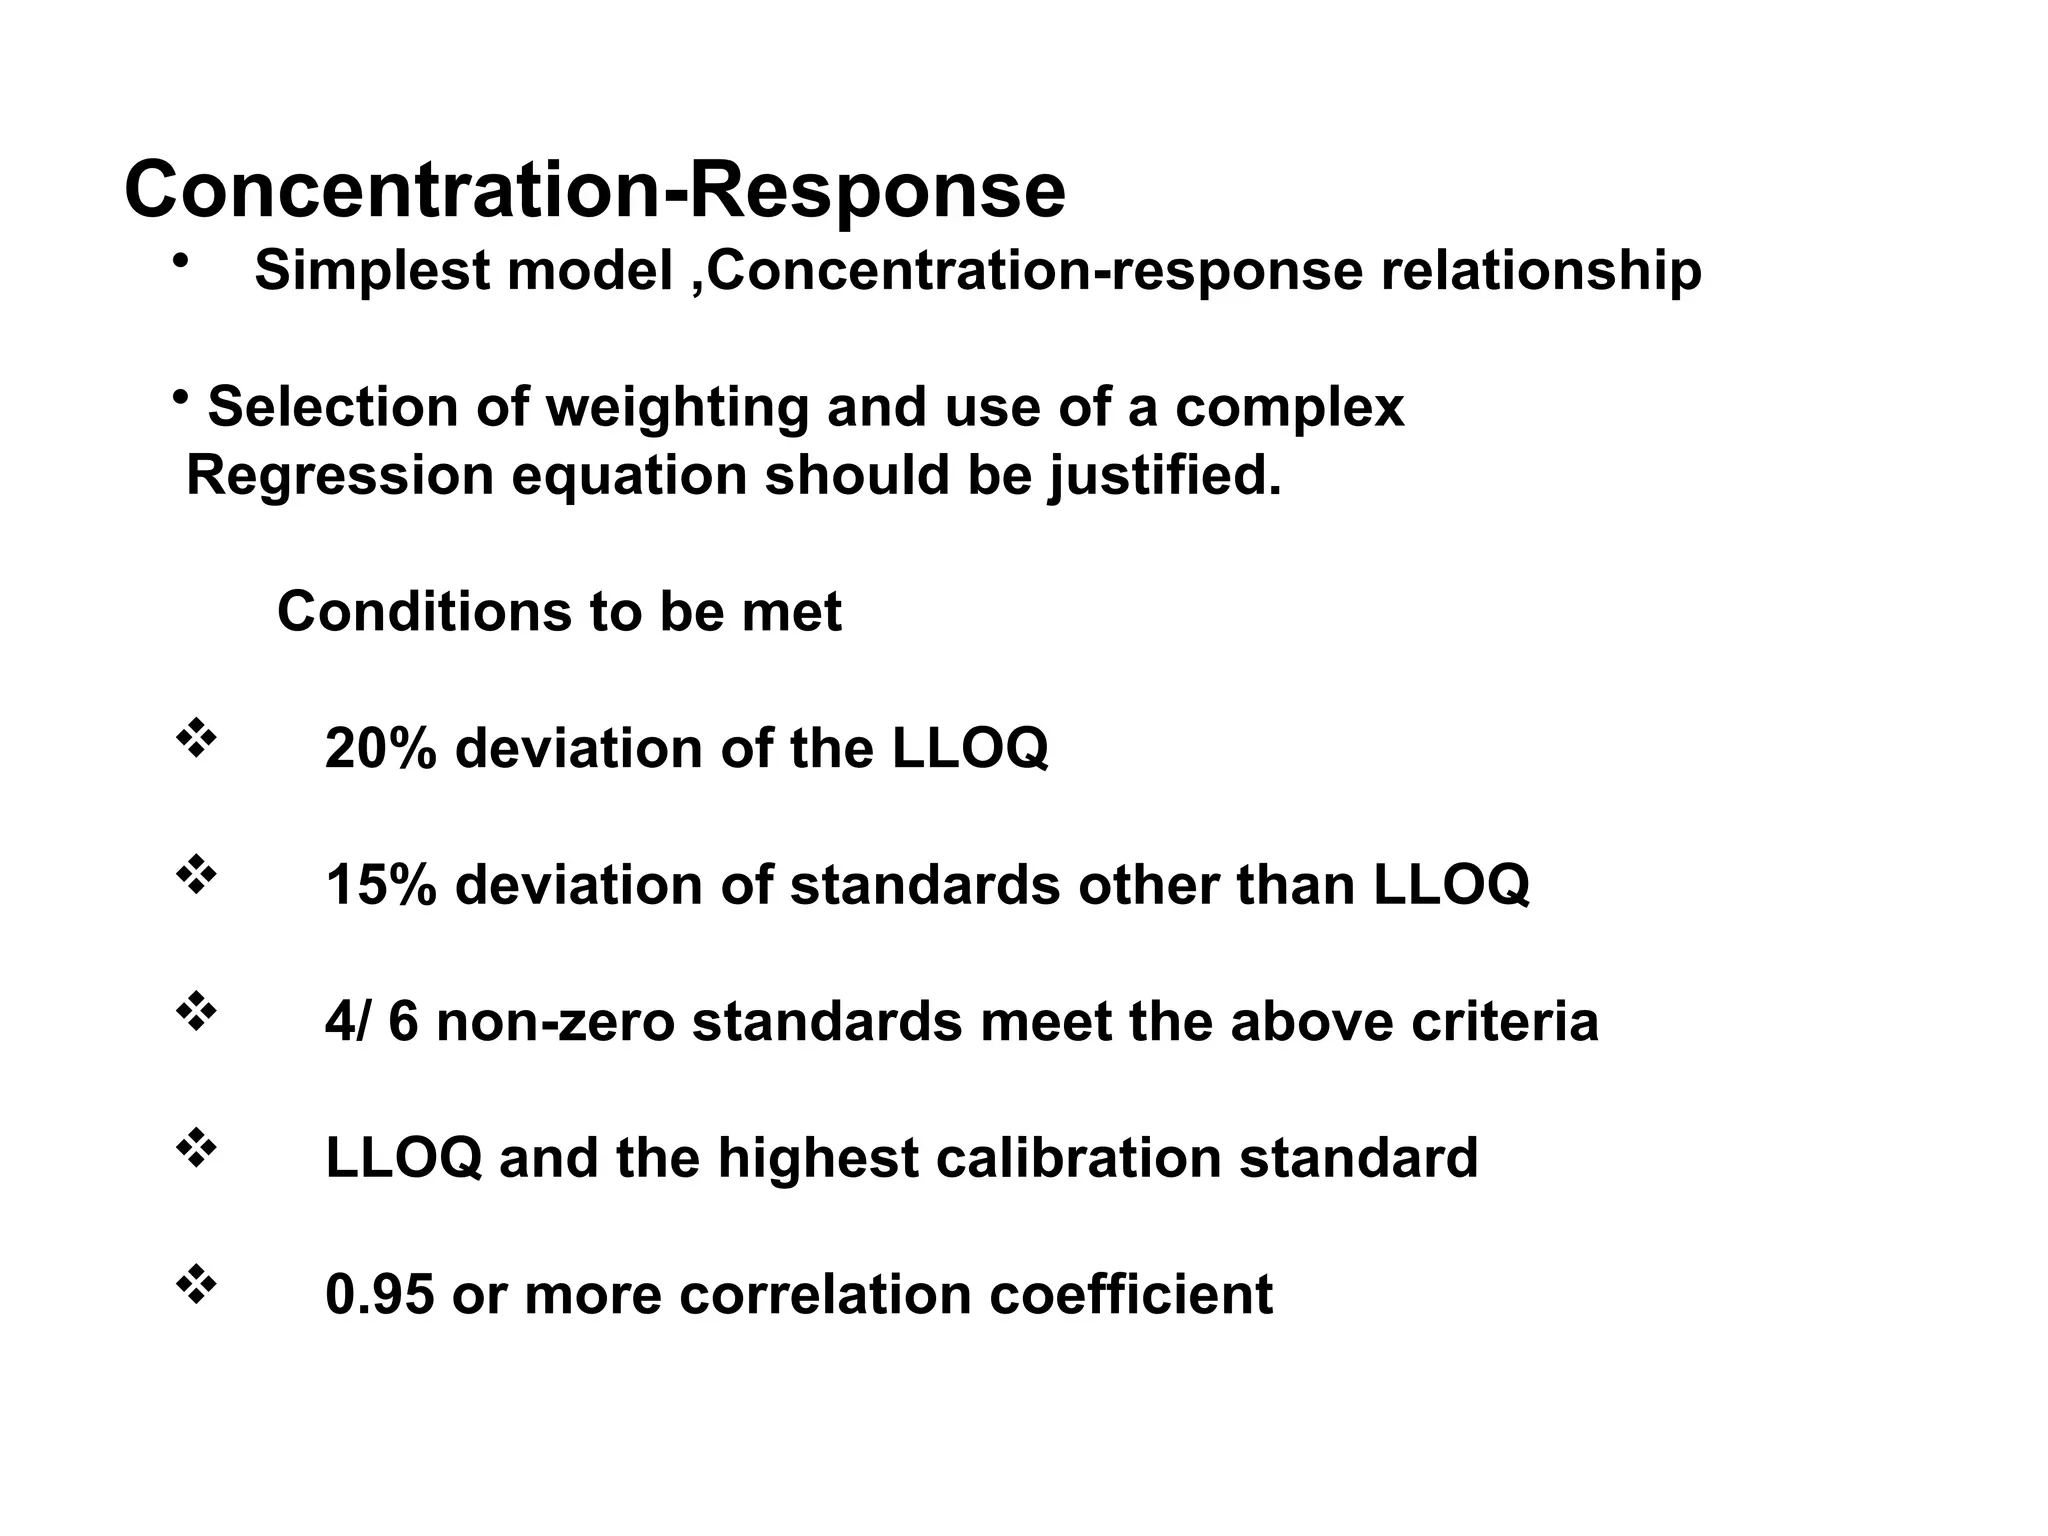
Concentration-Response
• Simplest model,Concentration-response relationship
• Selection of weighting and use of a complex
Regression equation should be justified.
Conditions to be met
20% deviation of the LLOQ
15% deviation of standards other than LLOQ
4/ 6 non-zero standards meet the above criteria
LLOQ and the highest calibration standard
0.95 or more correlation coefficient
25.
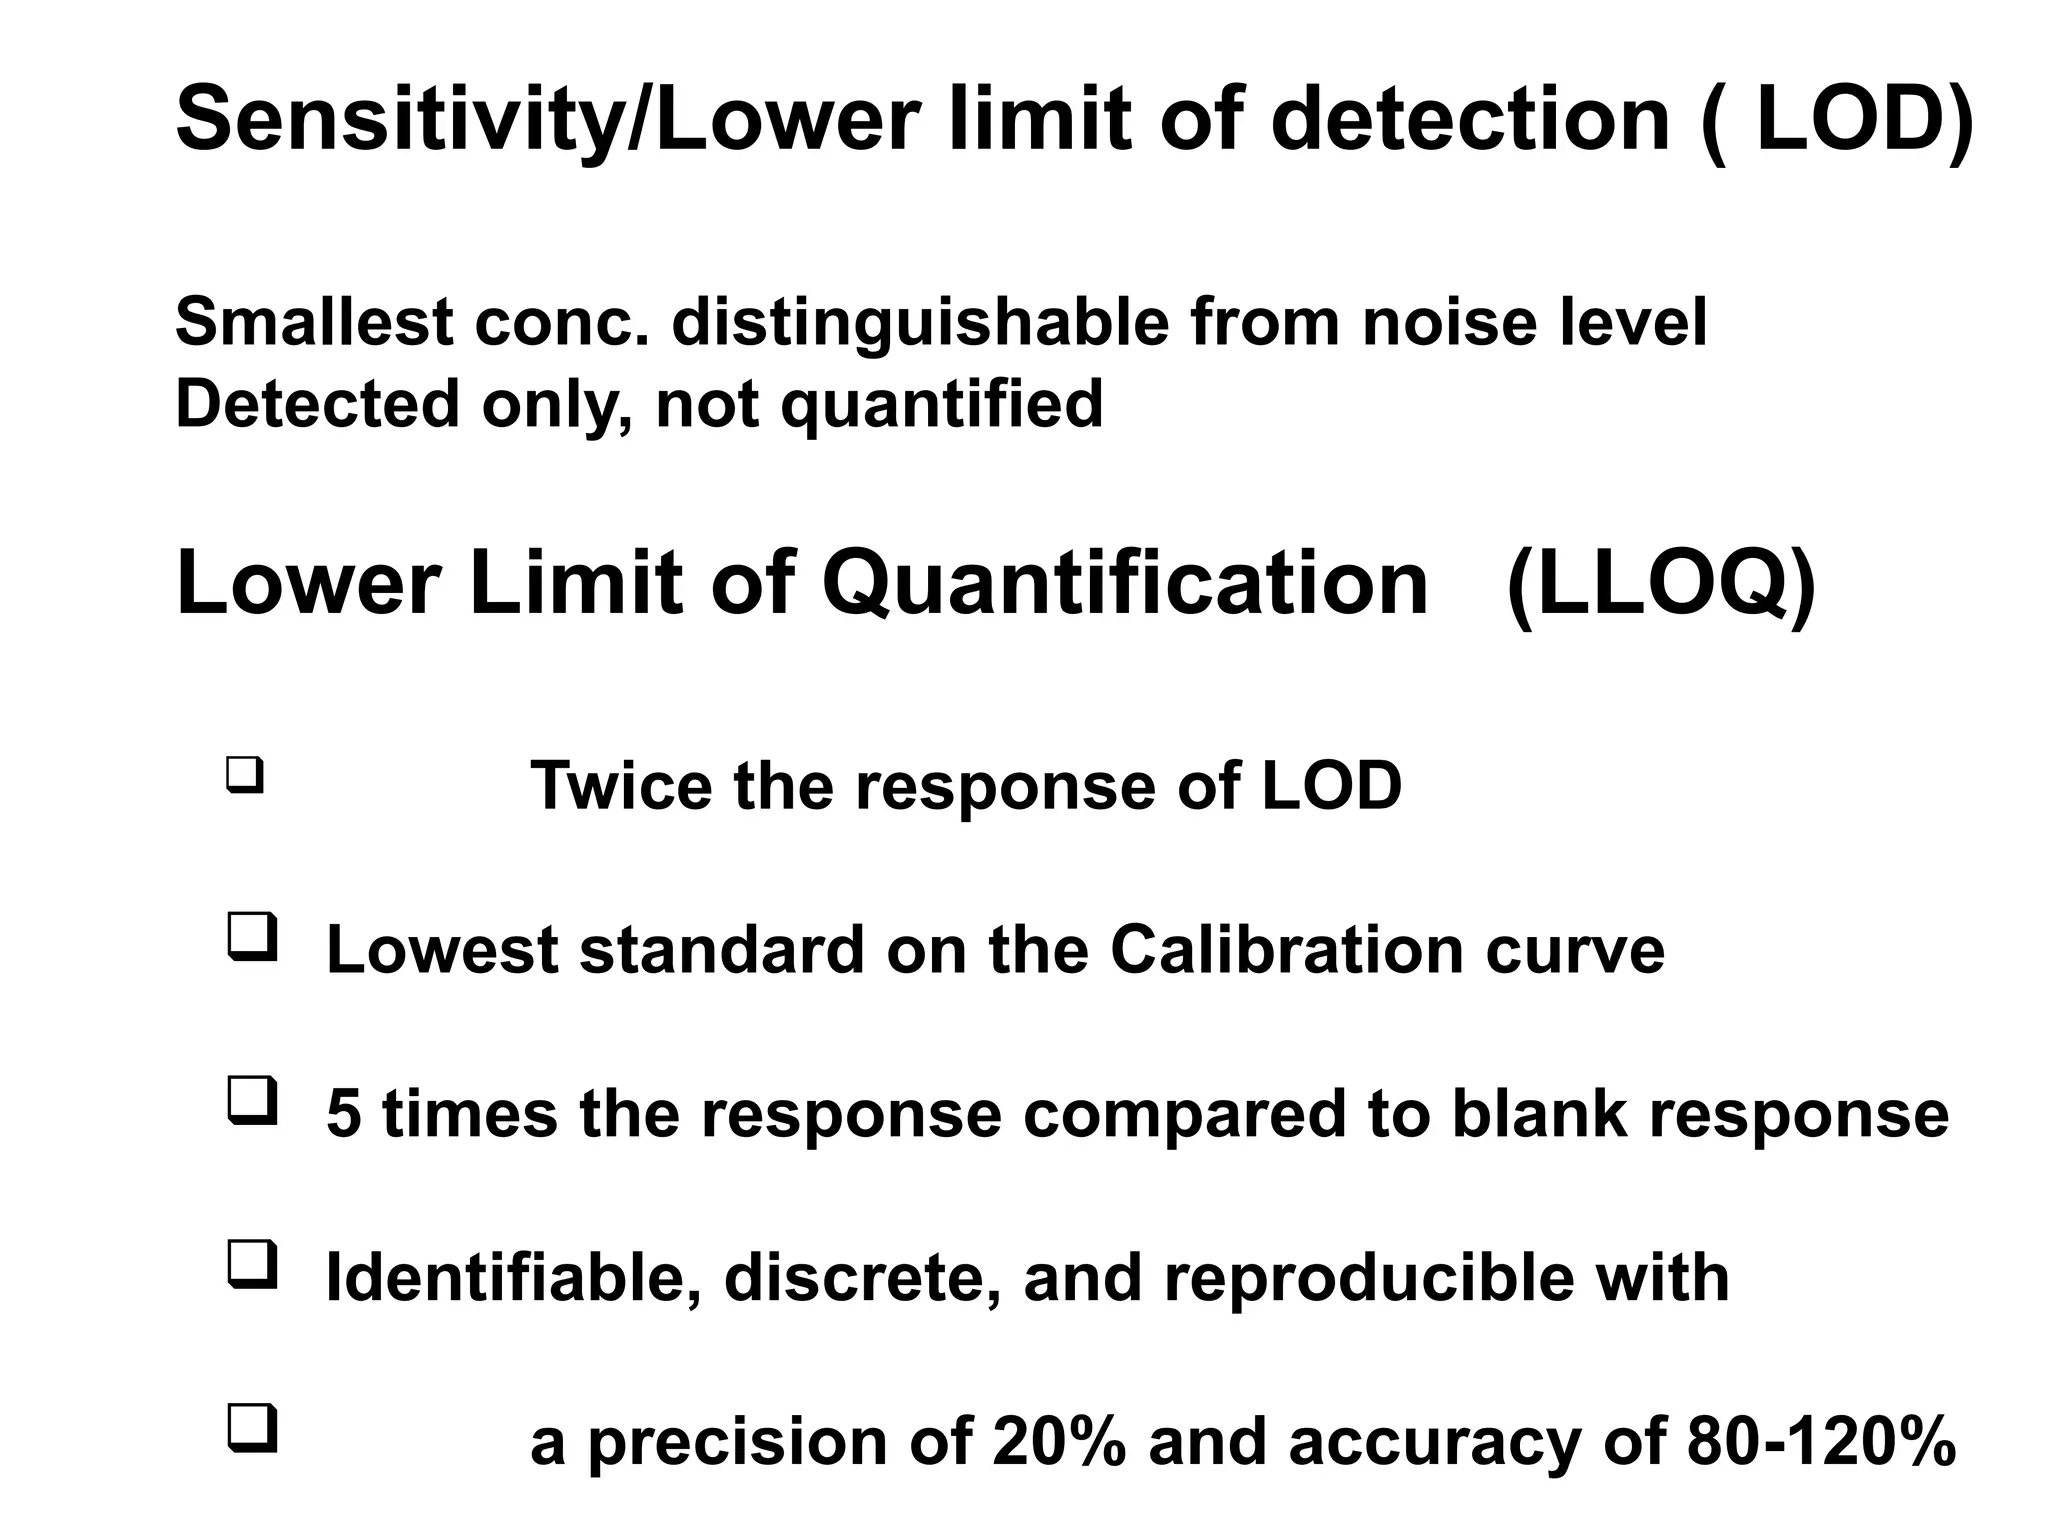
Sensitivity/Lower limit ofdetection ( LOD)
Smallest conc. distinguishable from noise level
Detected only, not quantified
Lower Limit of Quantification (LLOQ)
Twice the response of LOD
Lowest standard on the Calibration curve
5 times the response compared to blank response
Identifiable, discrete, and reproducible with
a precision of 20% and accuracy of 80-120%
26.
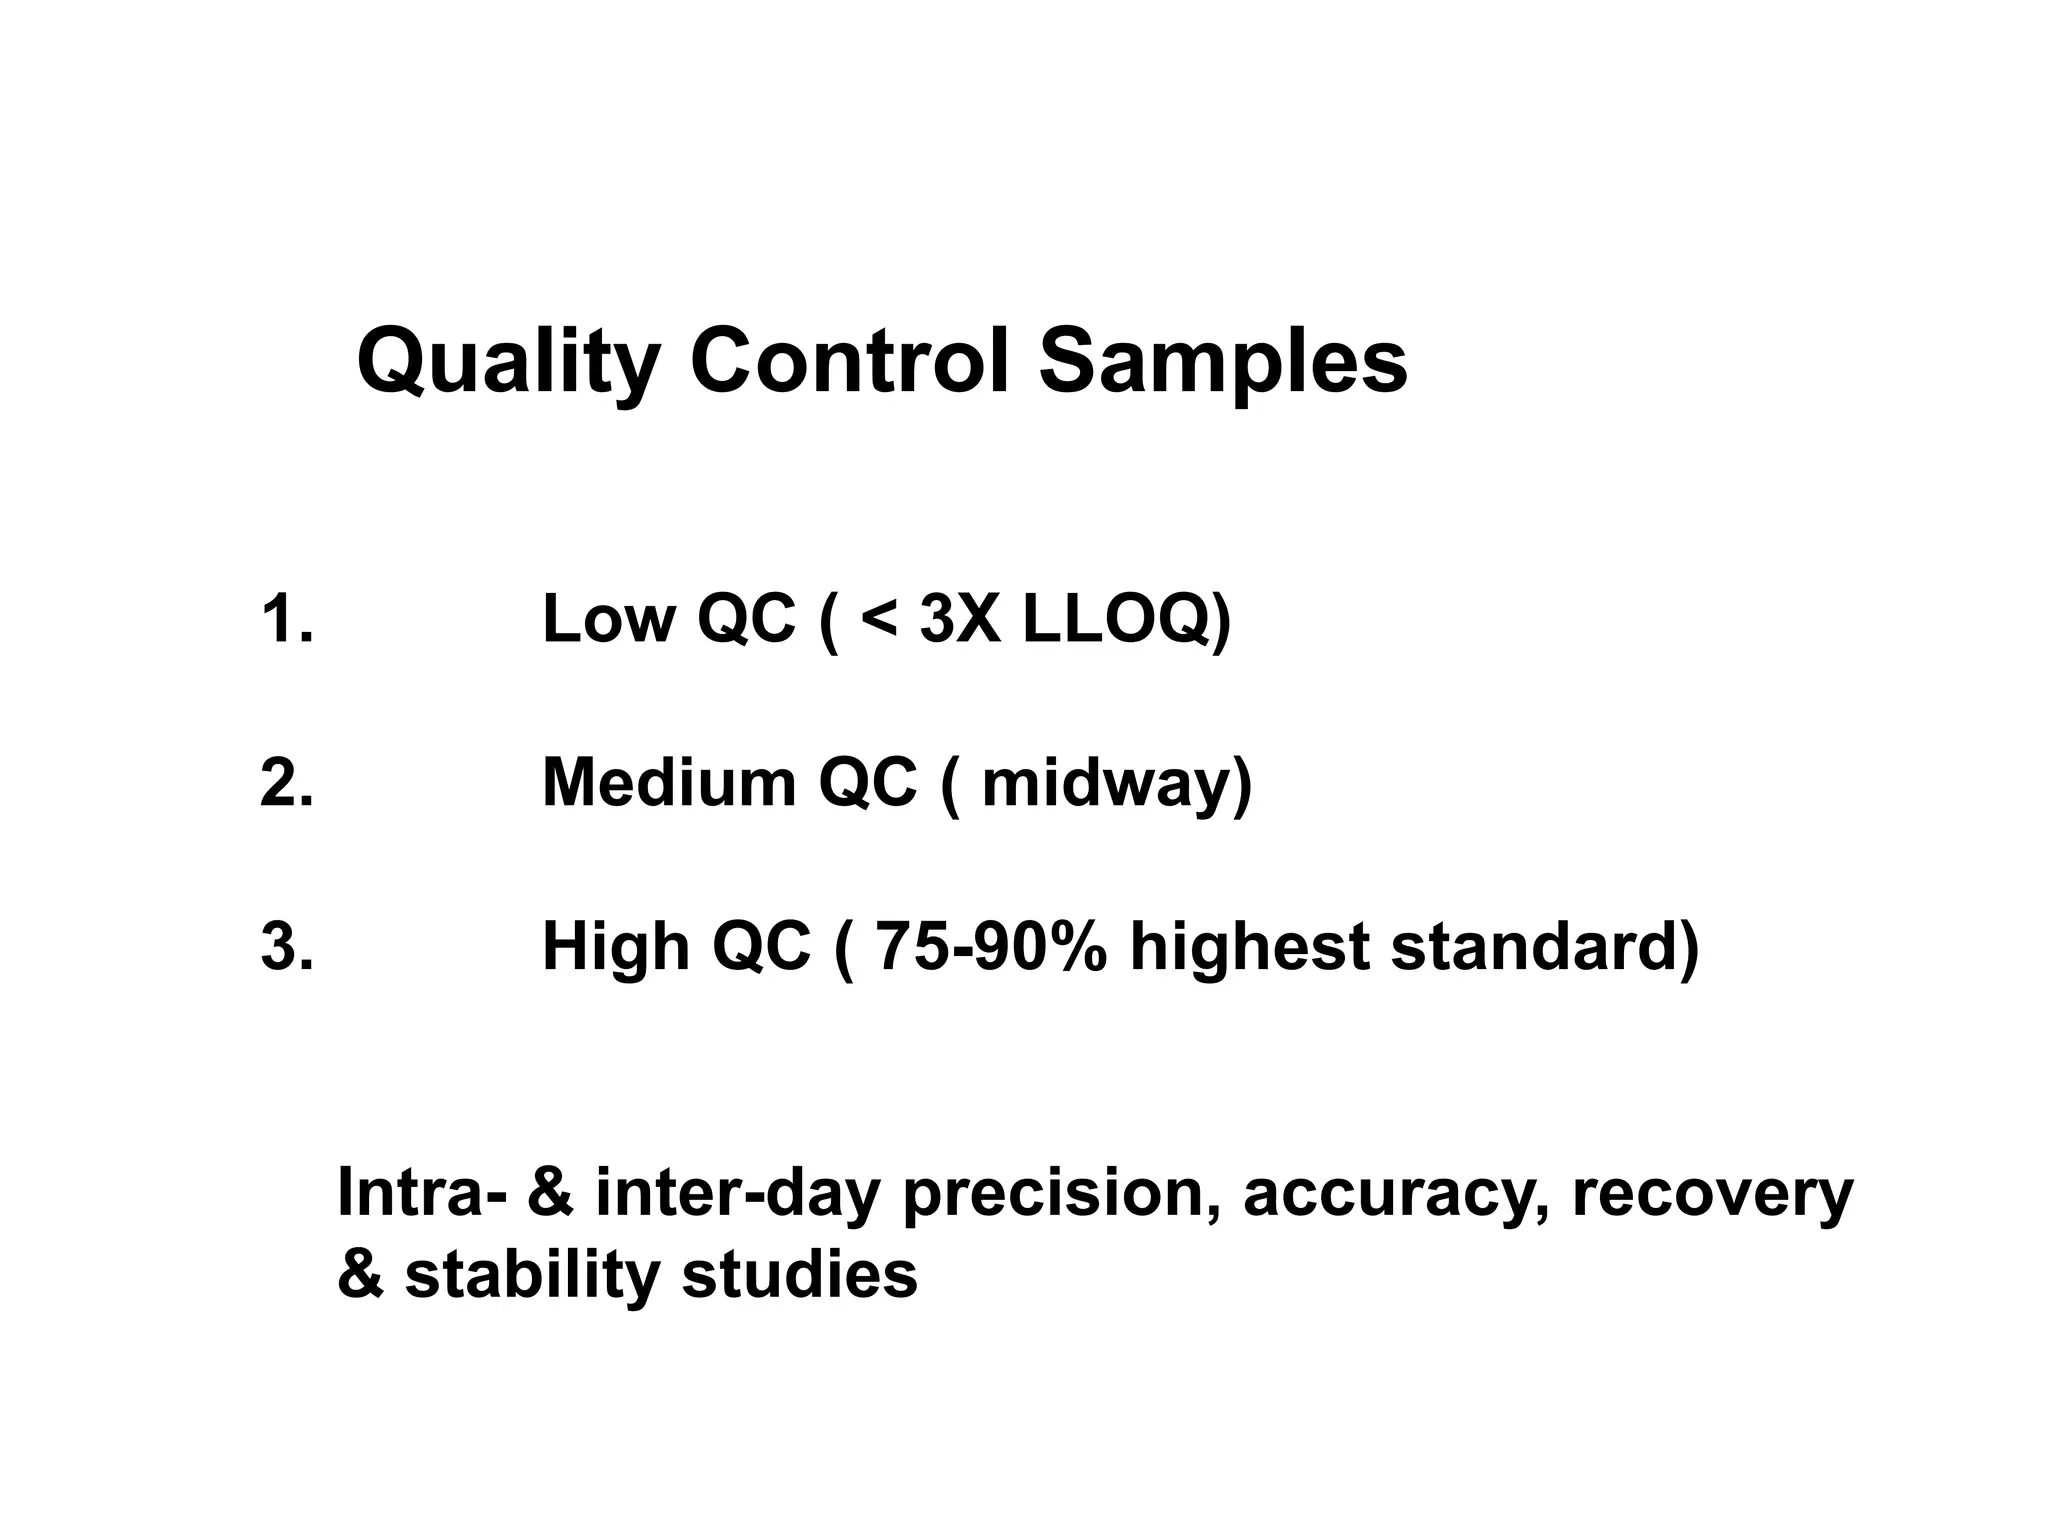
Quality Control Samples
1.Low QC ( < 3X LLOQ)
2. Medium QC ( midway)
3. High QC ( 75-90% highest standard)
Intra- & inter-day precision, accuracy, recovery
& stability studies
27.
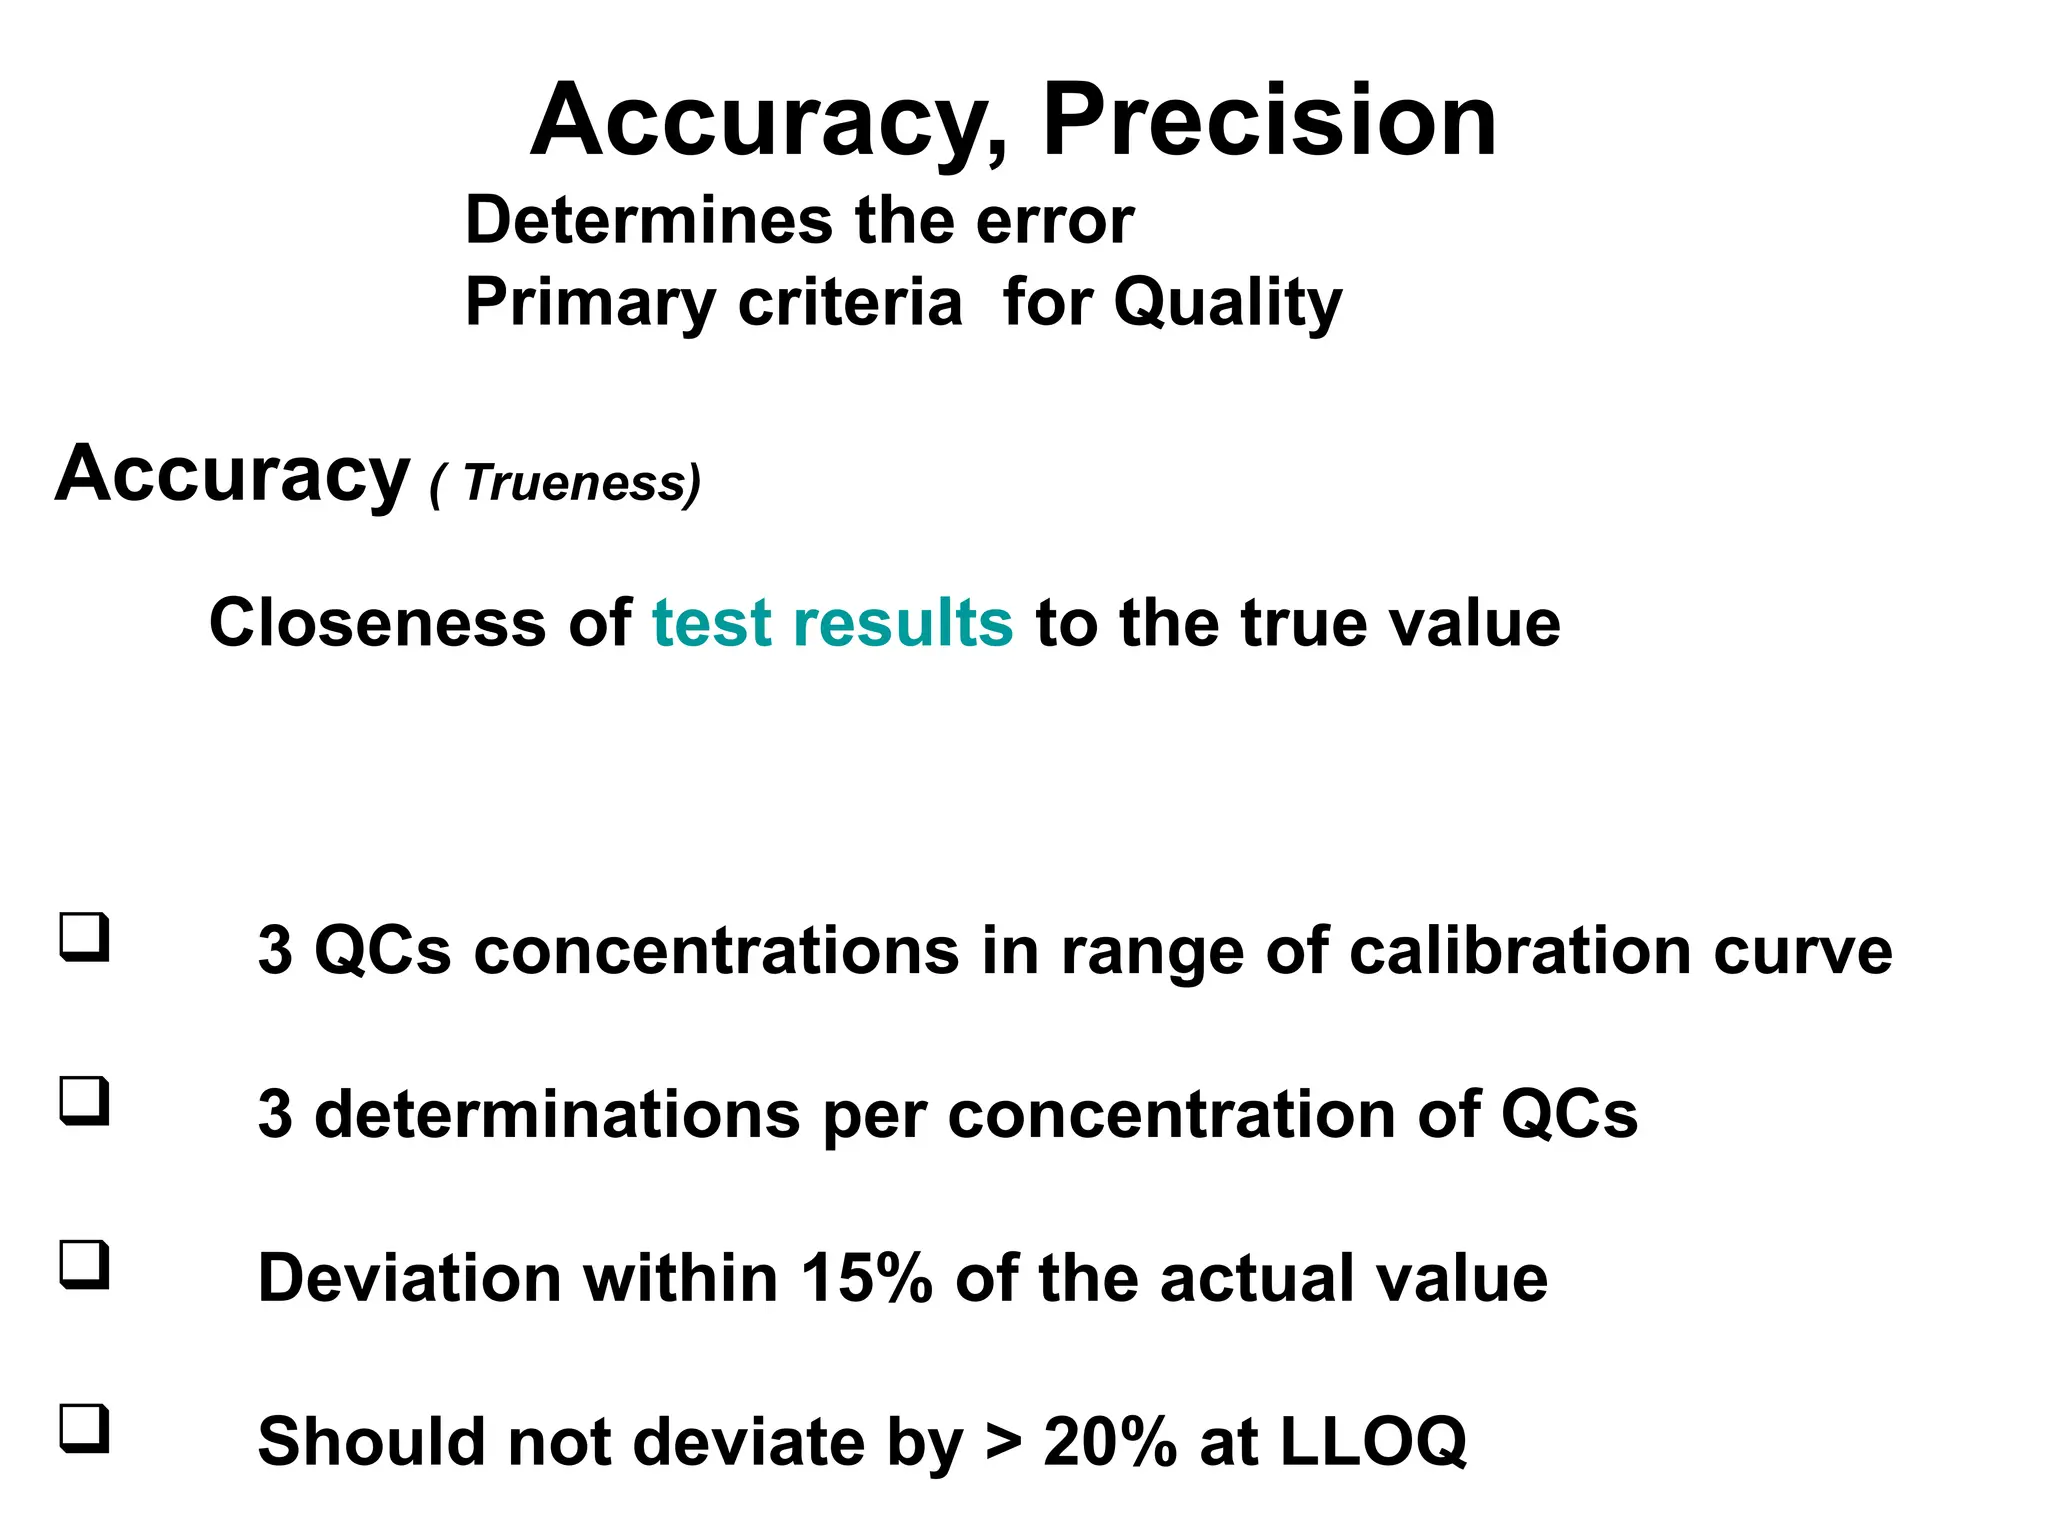
Accuracy, Precision
Determines theerror
Primary criteria for Quality
Accuracy ( Trueness)
Closeness of test results to the true value
3 QCs concentrations in range of calibration curve
3 determinations per concentration of QCs
Deviation within 15% of the actual value
Should not deviate by > 20% at LLOQ
28.
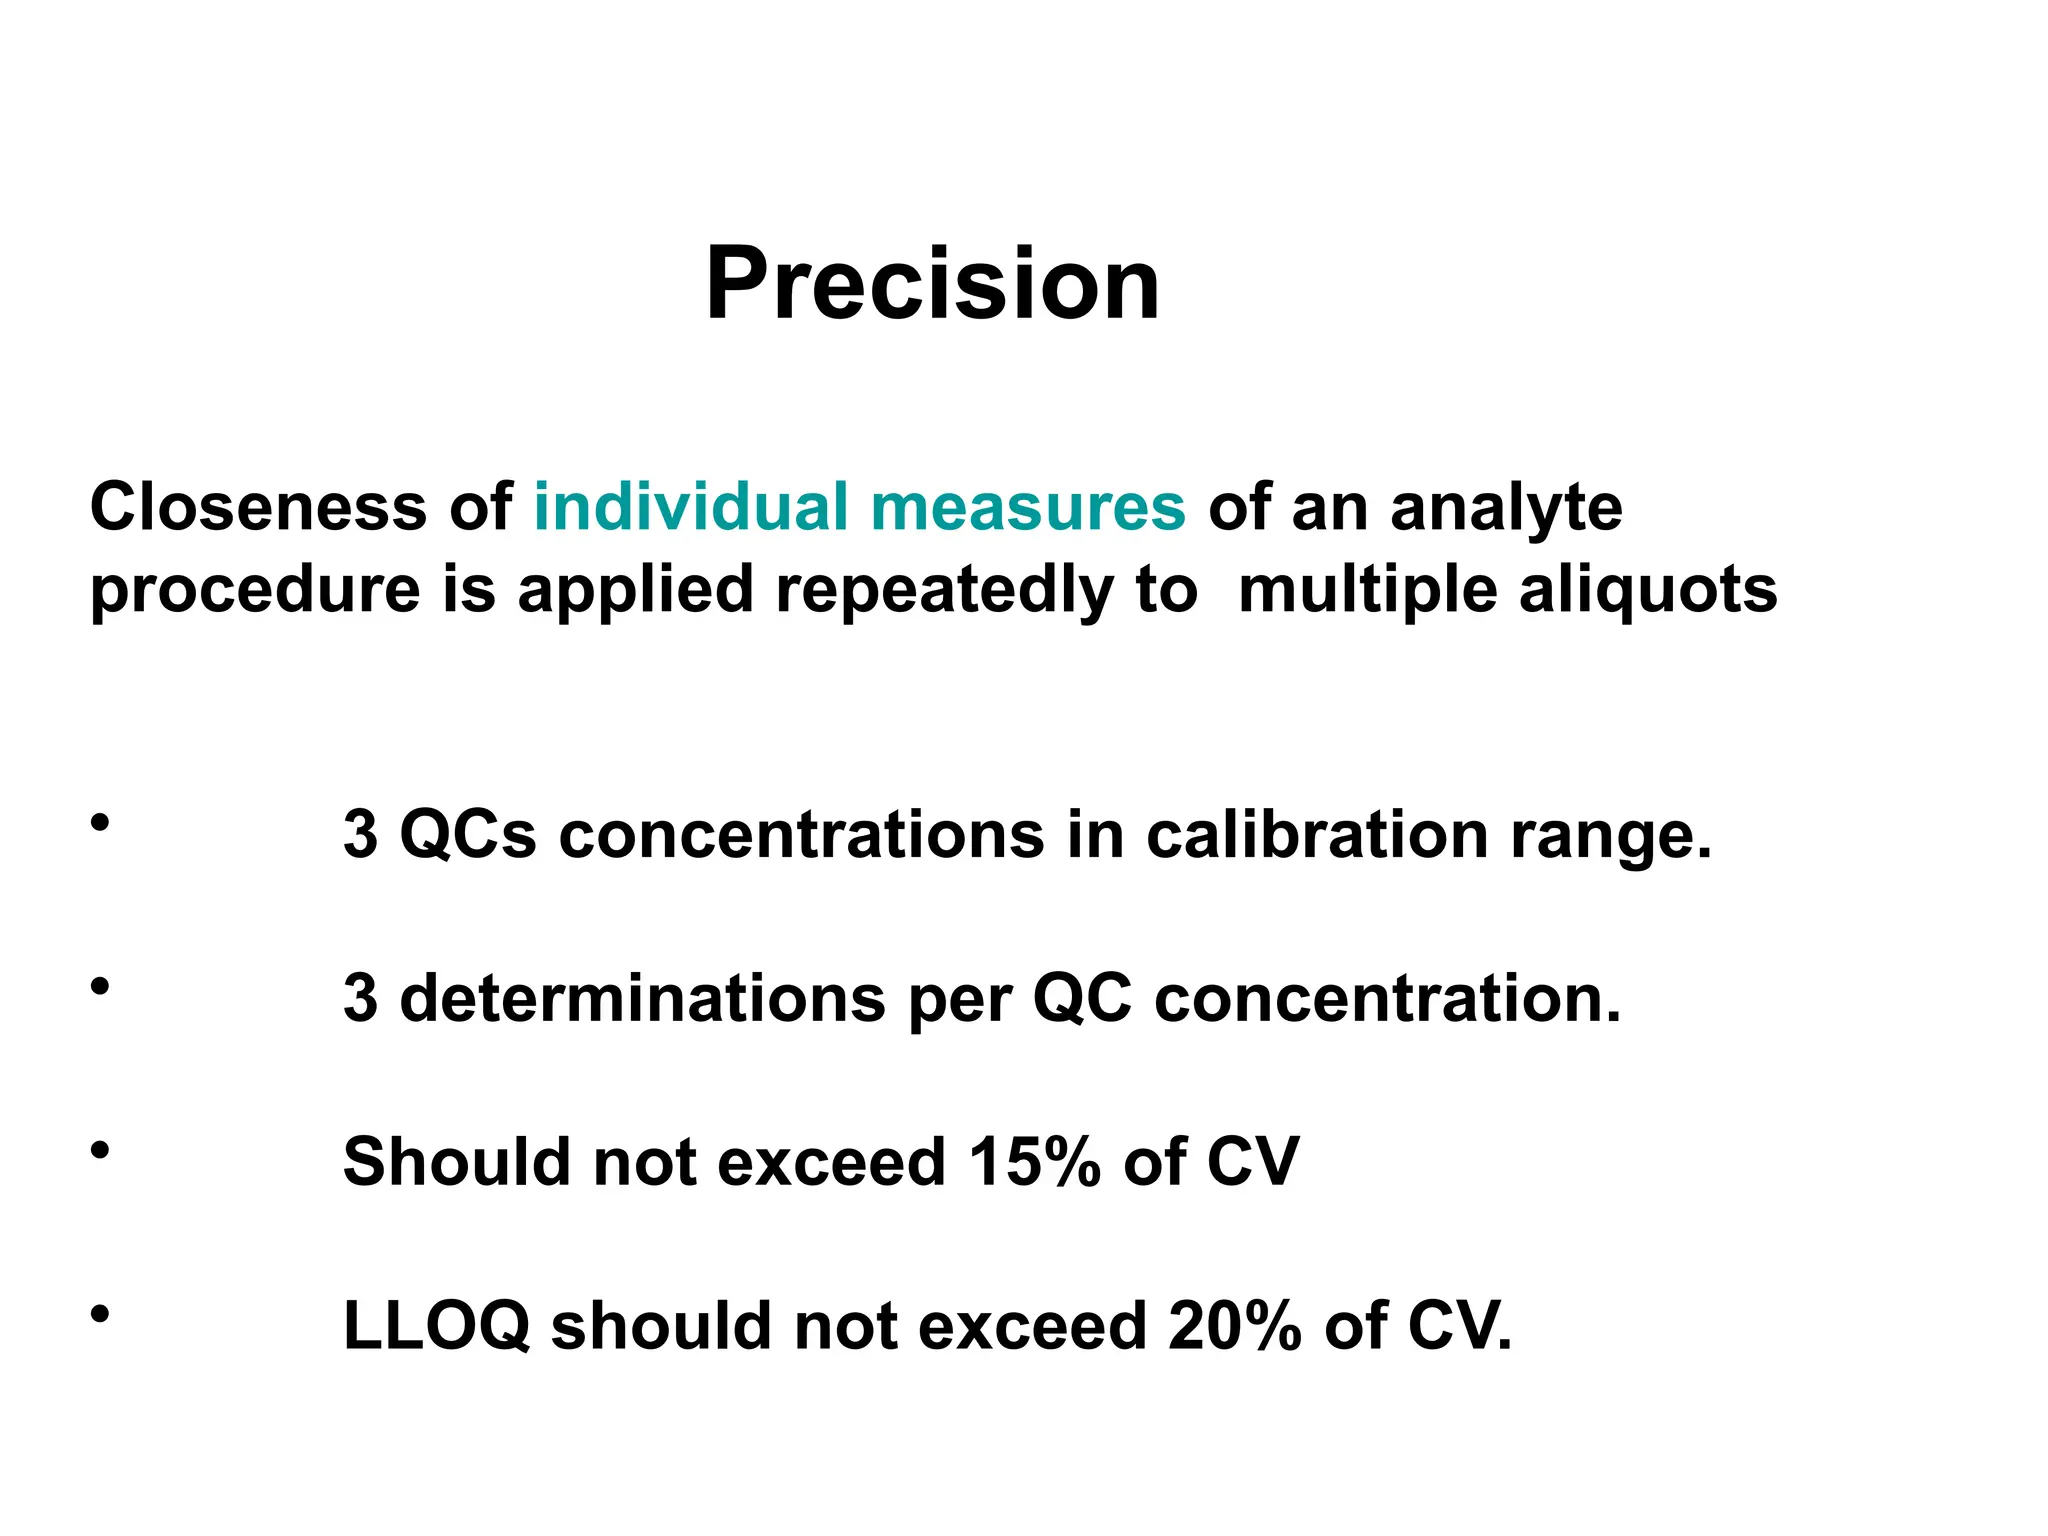
Precision
Closeness of individualmeasures of an analyte
procedure is applied repeatedly to multiple aliquots
• 3 QCs concentrations in calibration range.
• 3 determinations per QC concentration.
• Should not exceed 15% of CV
• LLOQ should not exceed 20% of CV.
29.
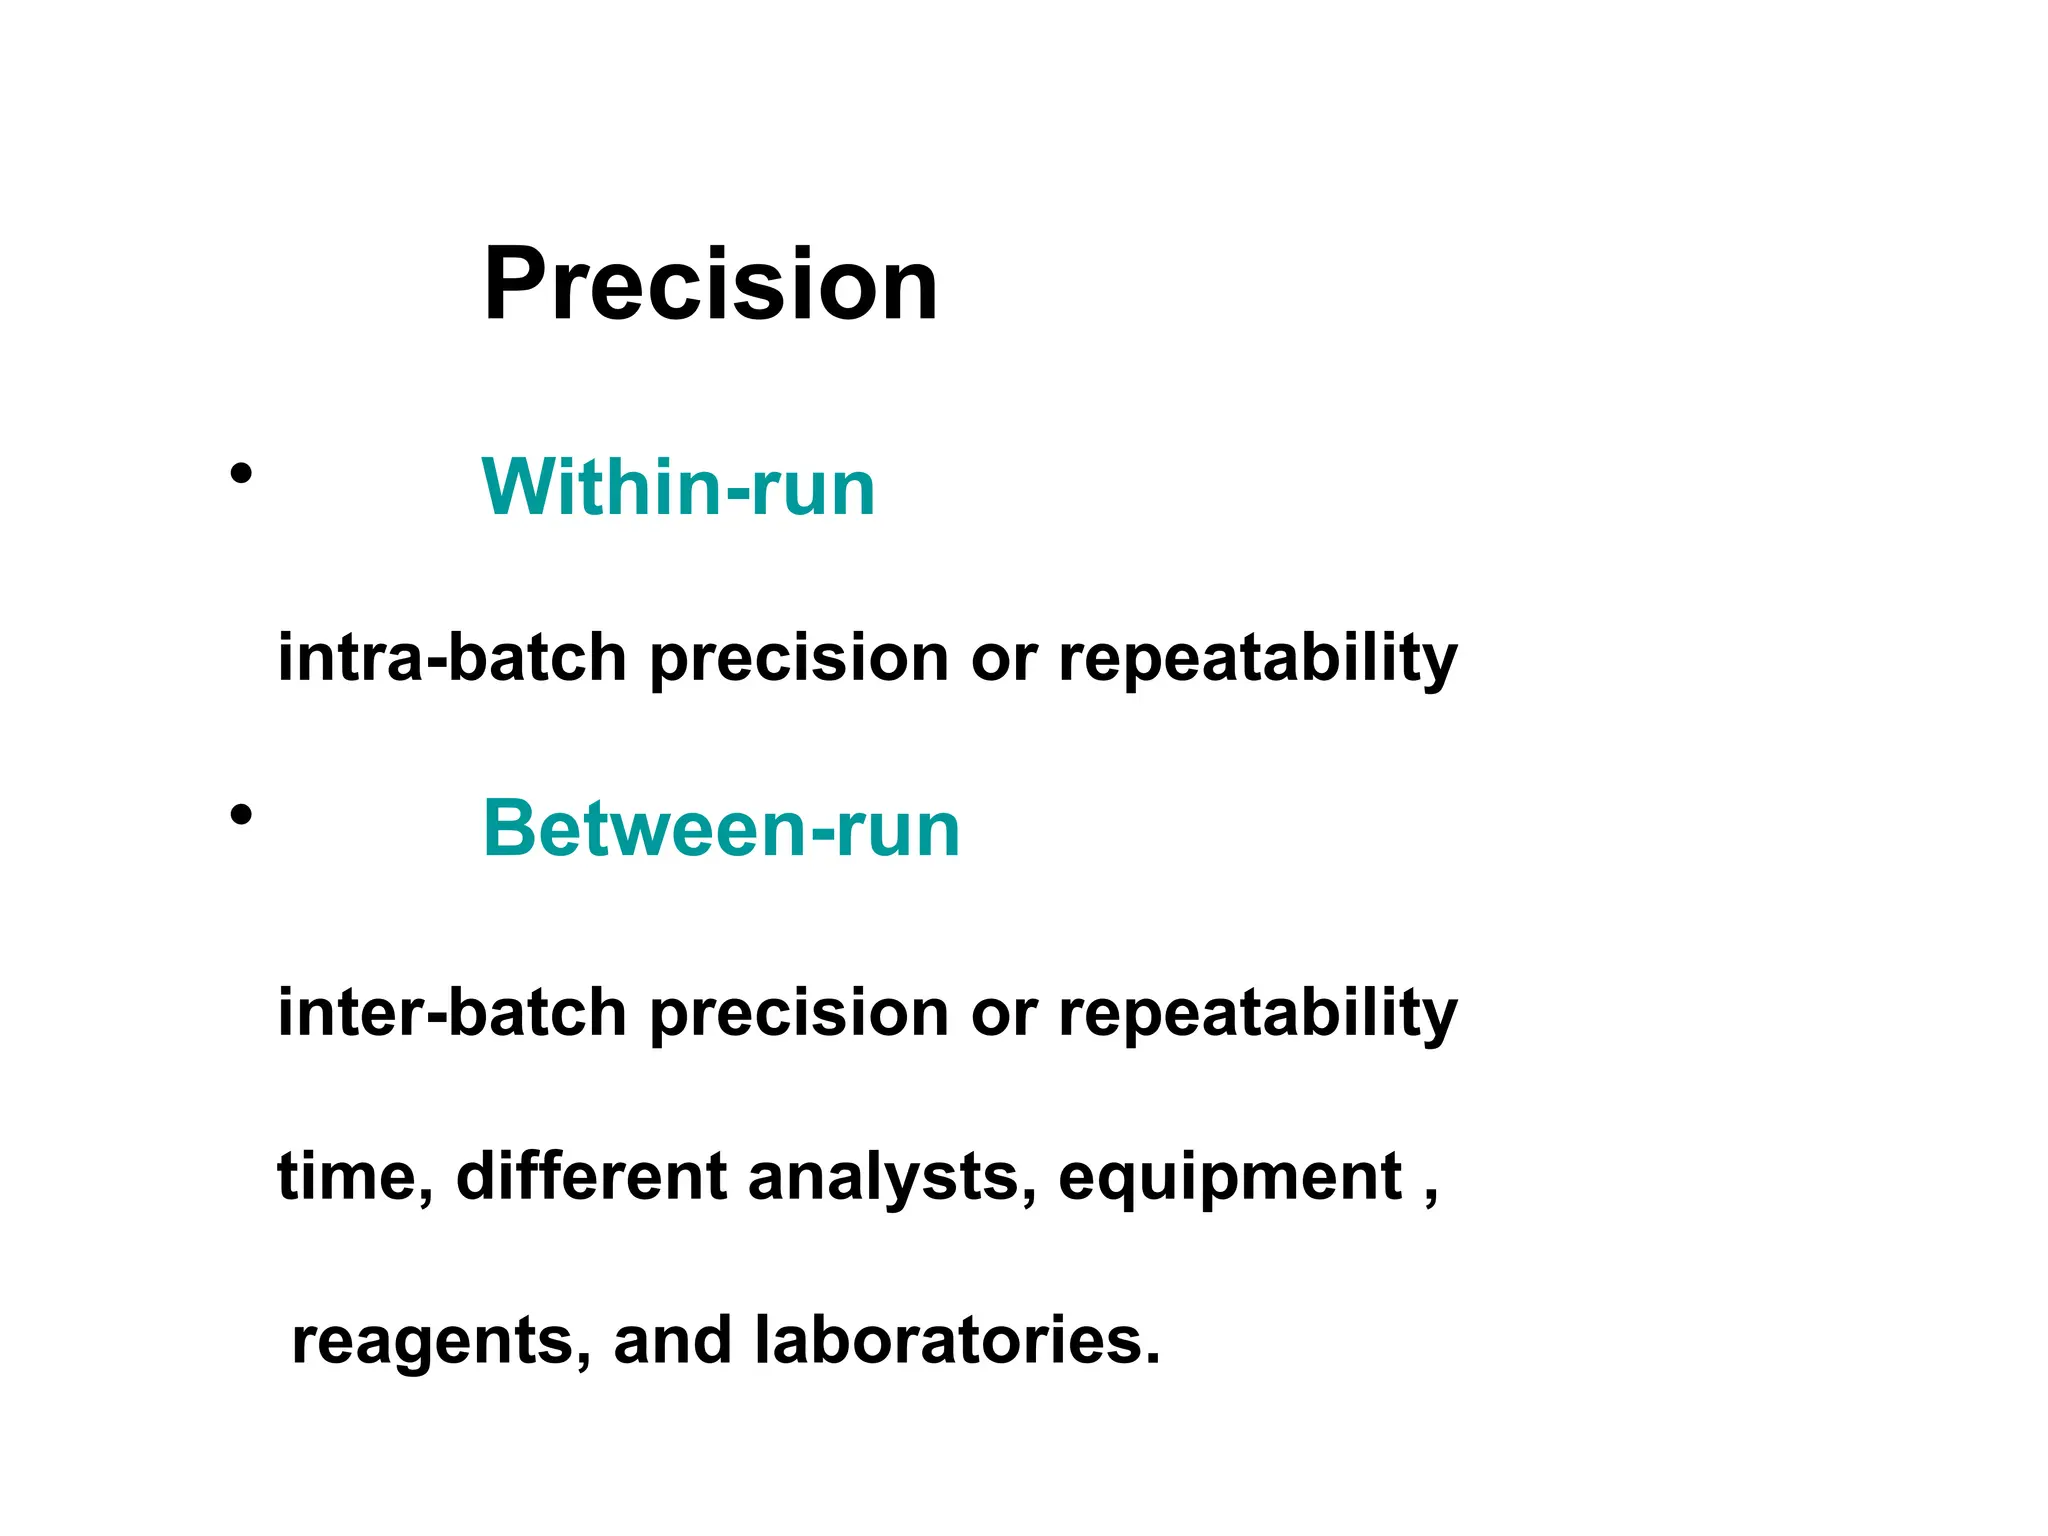
Precision
• Within-run
intra-batch precisionor repeatability
• Between-run
inter-batch precision or repeatability
time, different analysts, equipment ,
reagents, and laboratories.
30.
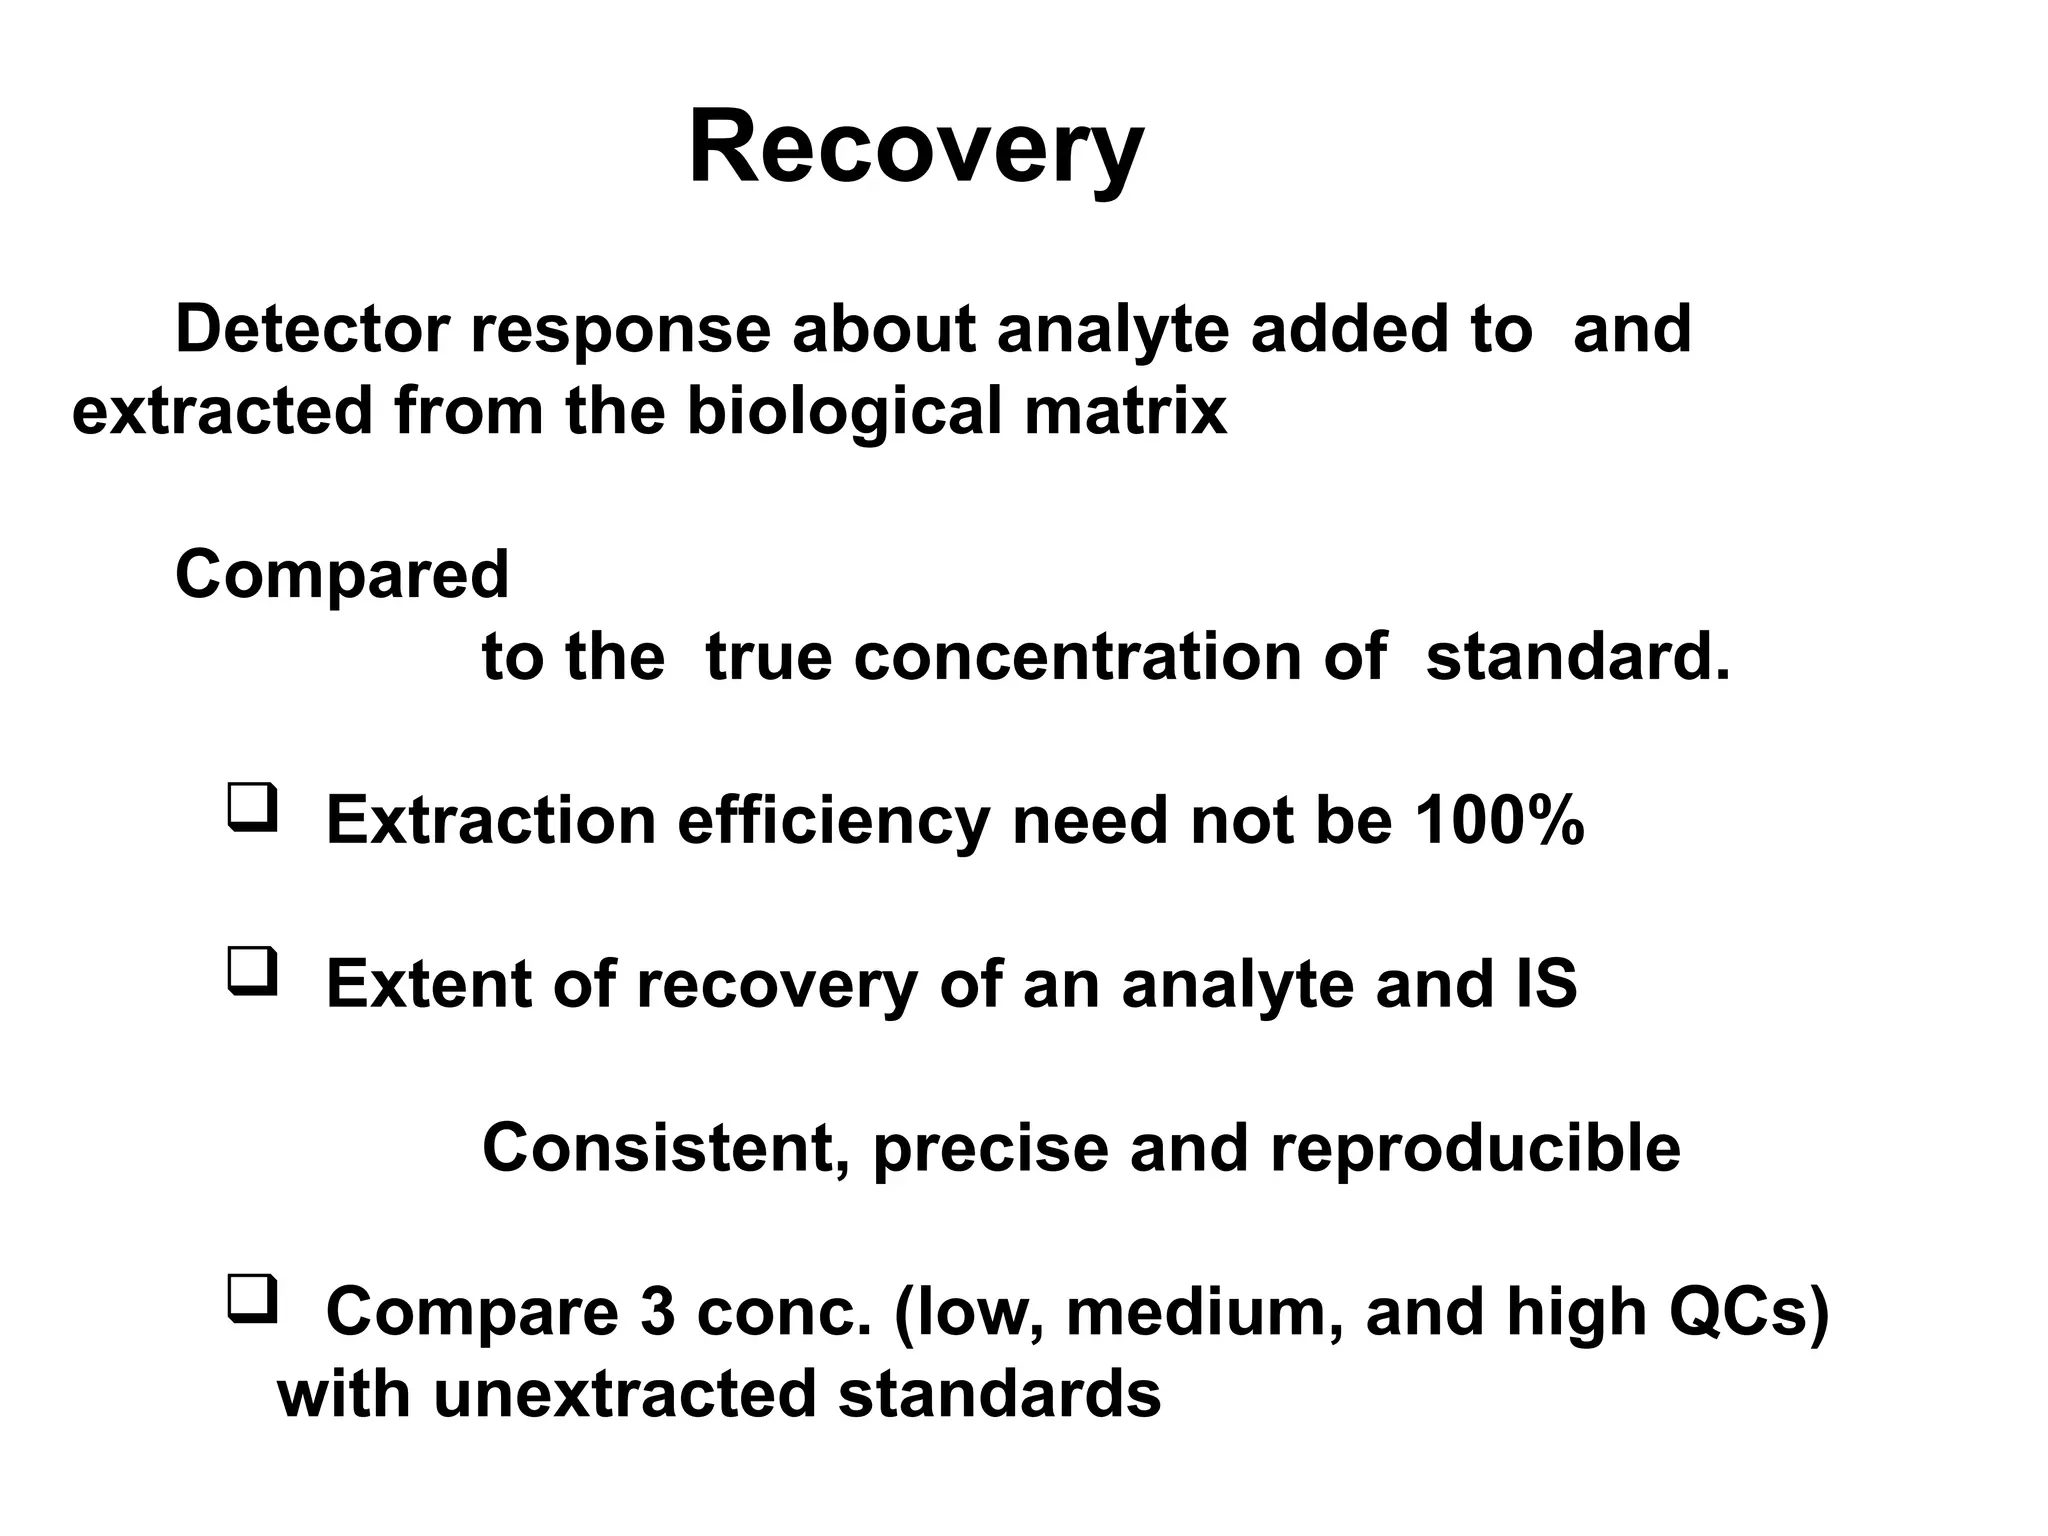
Recovery
Detector response aboutanalyte added to and
extracted from the biological matrix
Compared
to the true concentration of standard.
Extraction efficiency need not be 100%
Extent of recovery of an analyte and IS
Consistent, precise and reproducible
Compare 3 conc. (low, medium, and high QCs)
with unextracted standards
31.
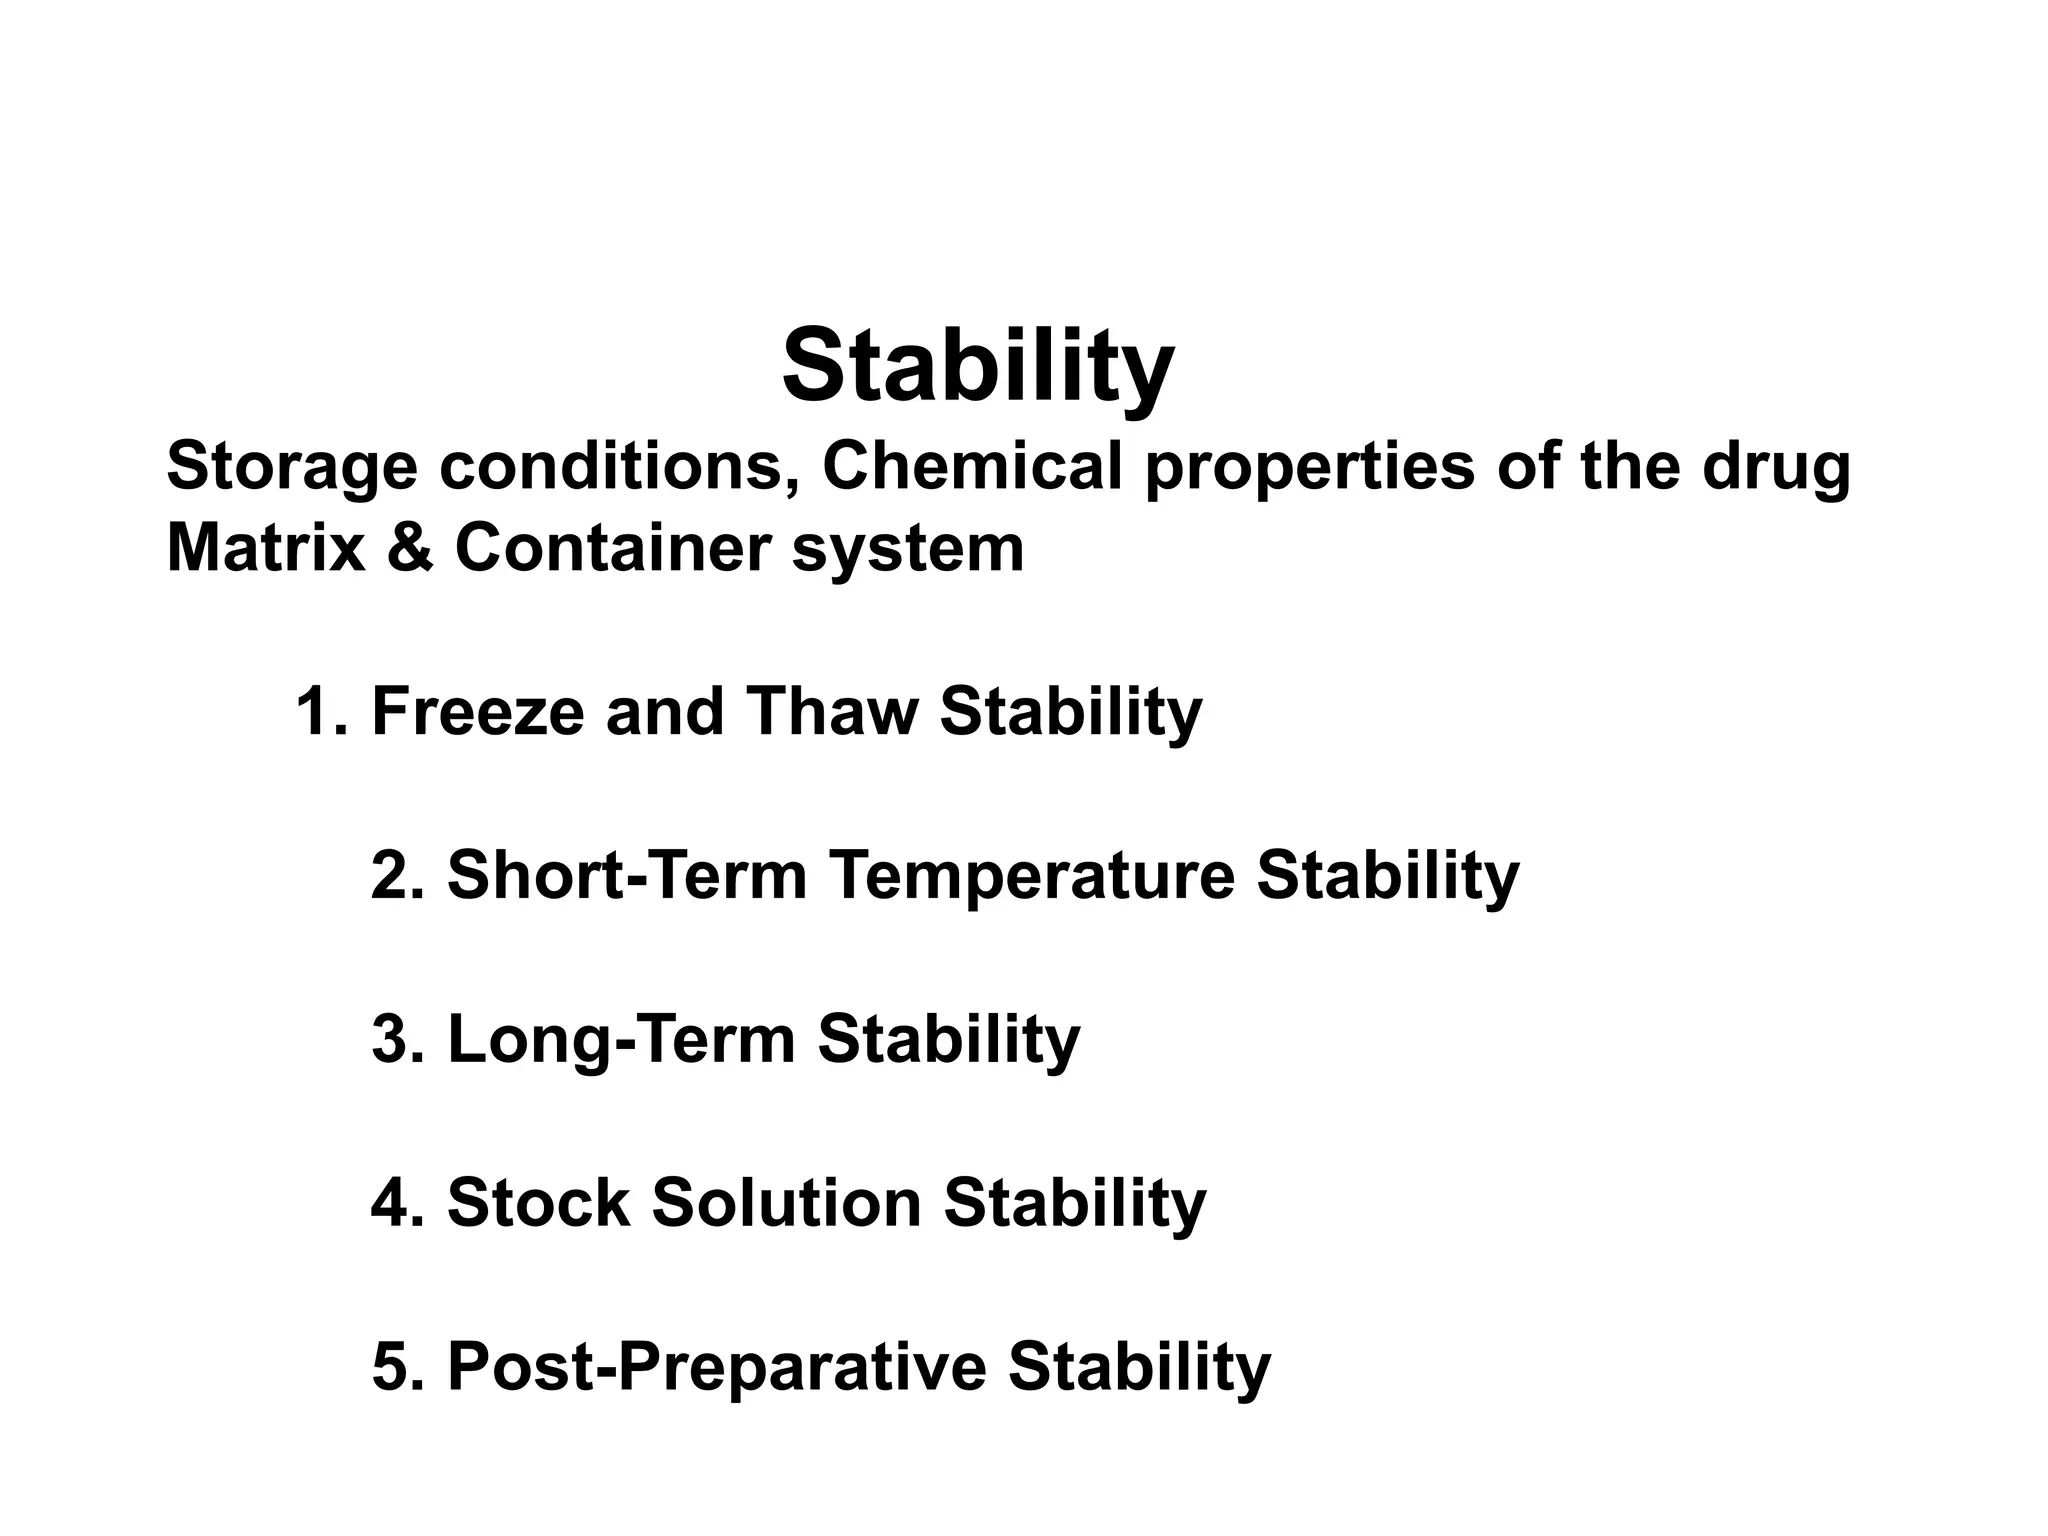
Stability
Storage conditions, Chemicalproperties of the drug
Matrix & Container system
1. Freeze and Thaw Stability
2. Short-Term Temperature Stability
3. Long-Term Stability
4. Stock Solution Stability
5. Post-Preparative Stability
32.
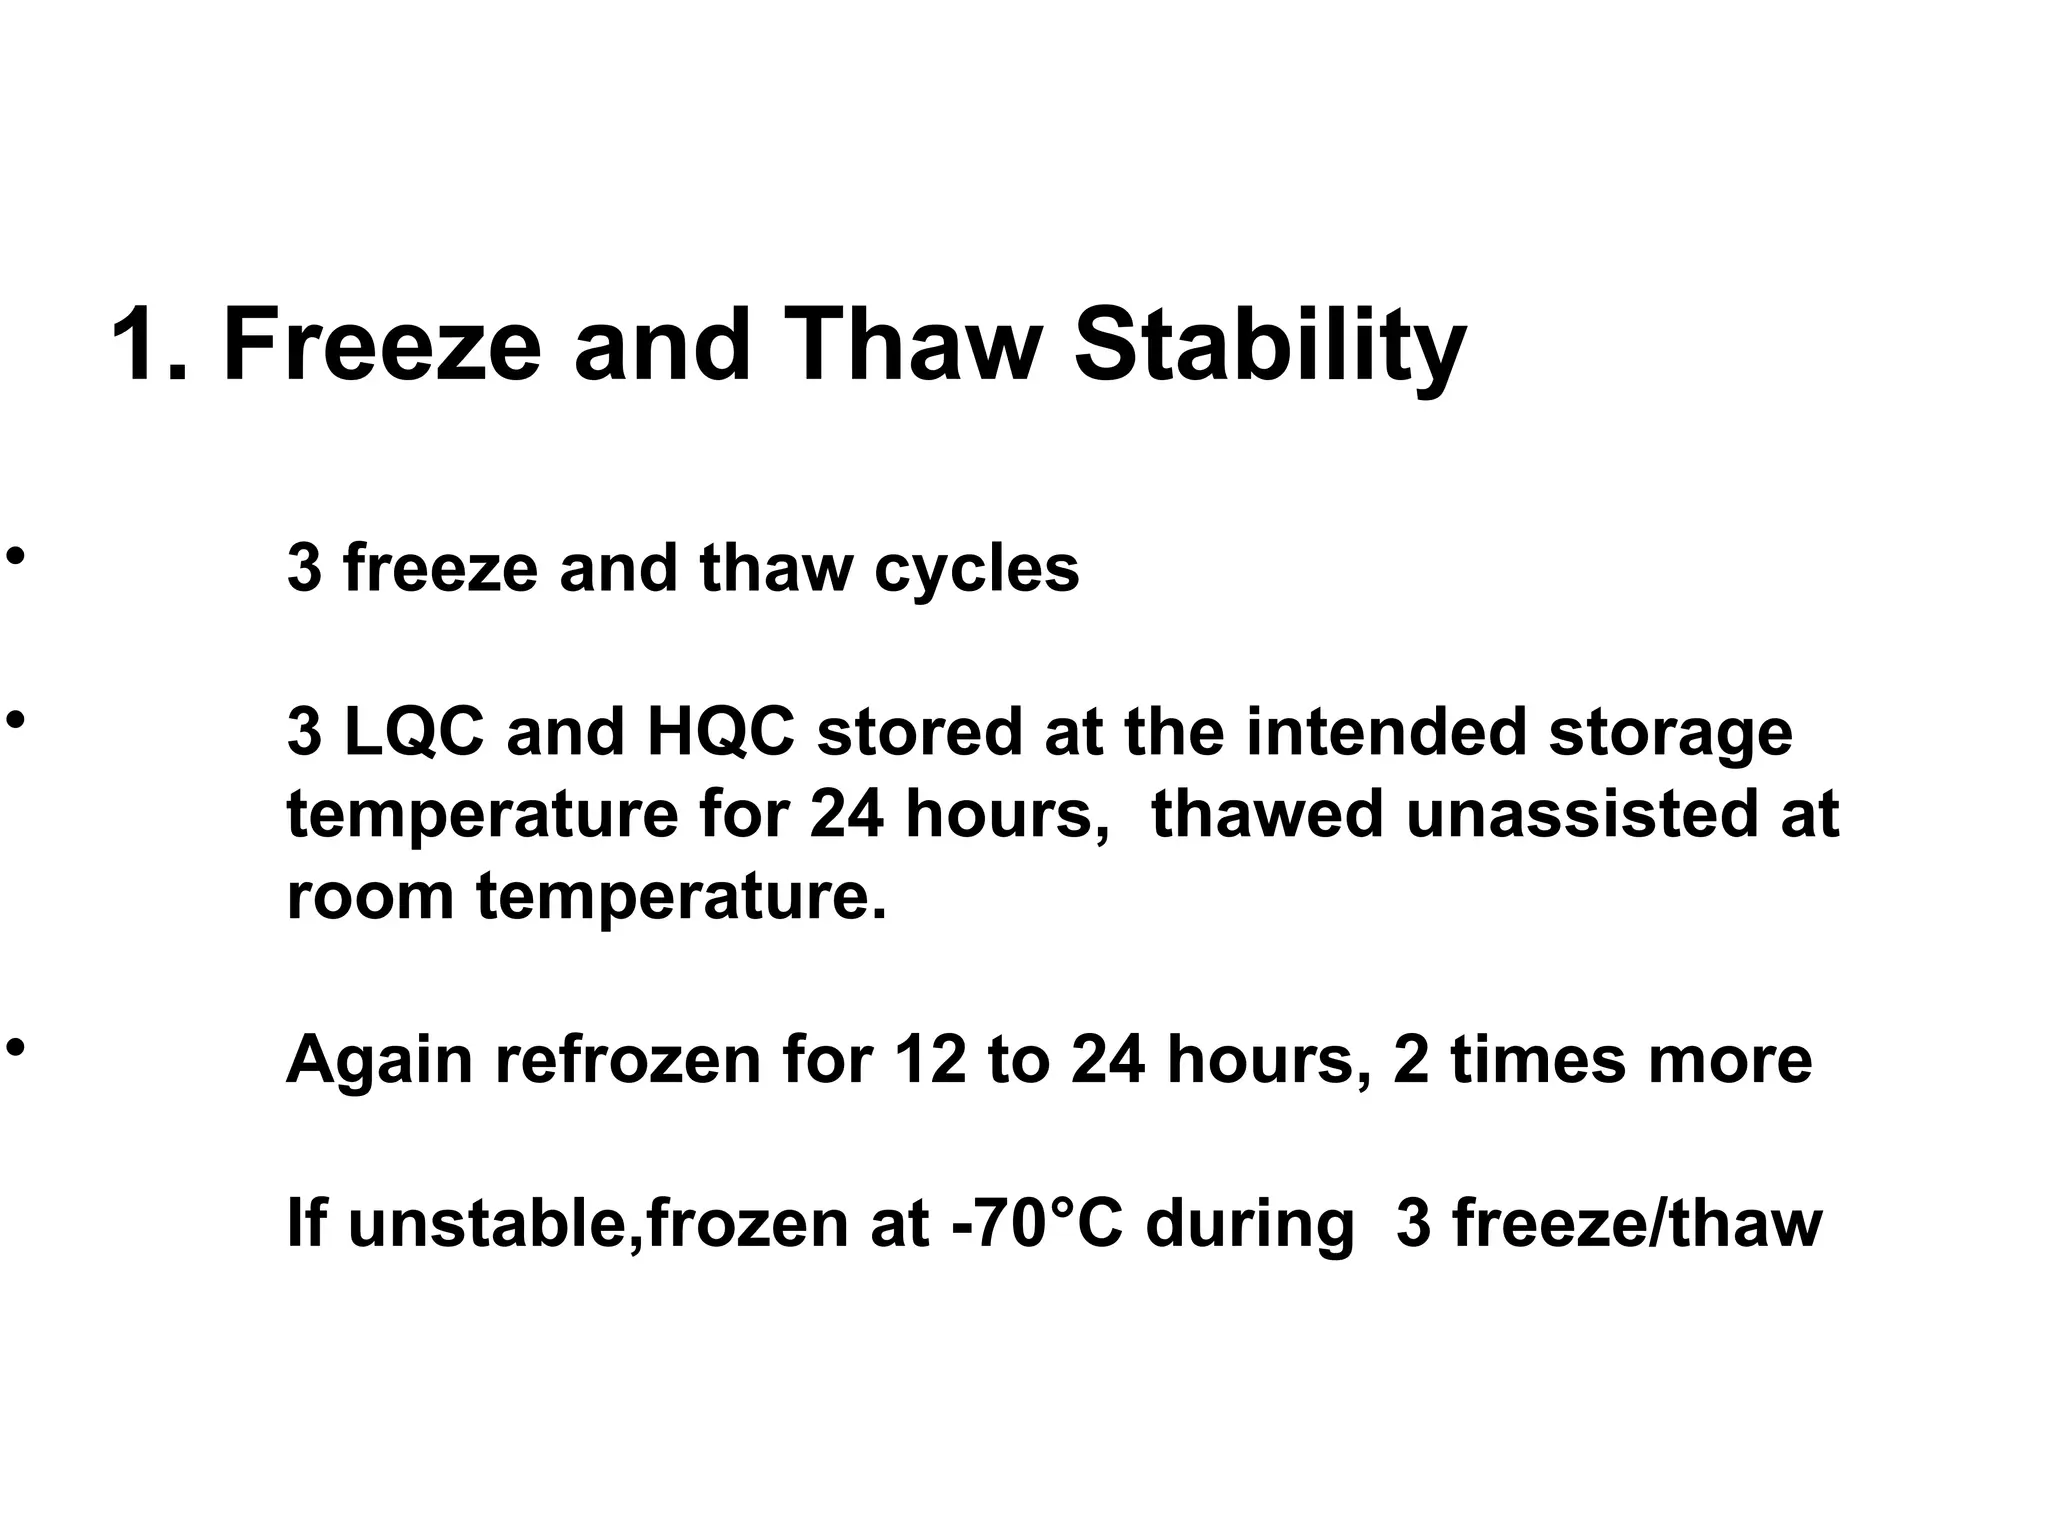
1. Freeze andThaw Stability
• 3 freeze and thaw cycles
• 3 LQC and HQC stored at the intended storage
temperature for 24 hours, thawed unassisted at
room temperature.
• Again refrozen for 12 to 24 hours, 2 times more
If unstable,frozen at -70°C during 3 freeze/thaw
33.
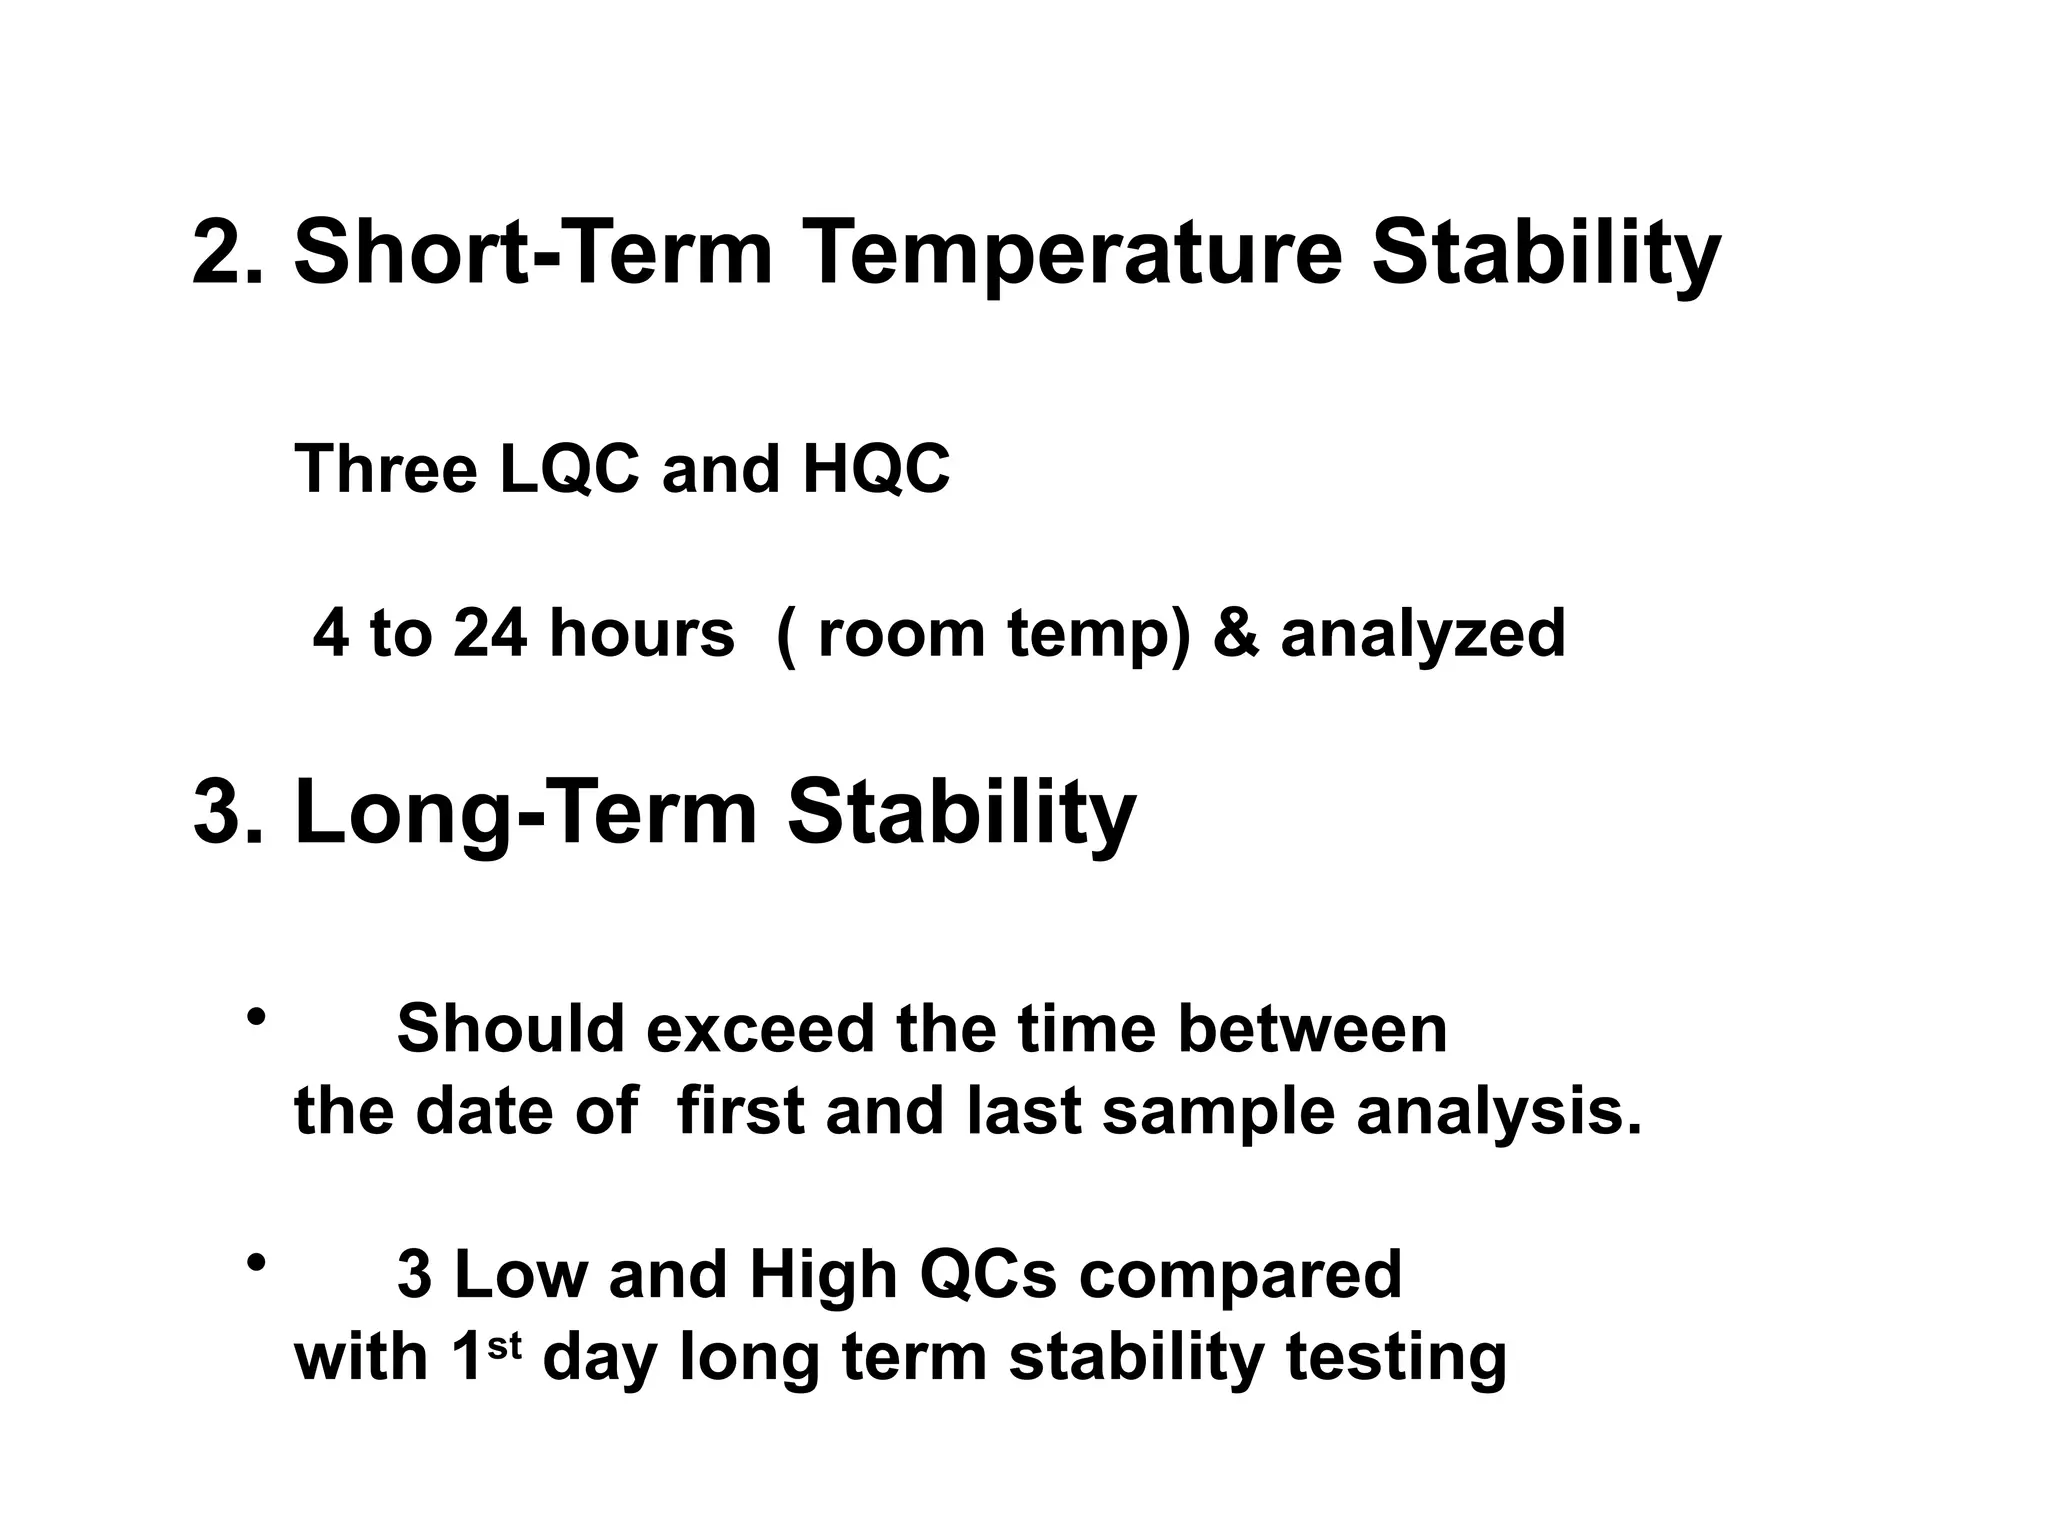
2. Short-Term TemperatureStability
Three LQC and HQC
4 to 24 hours ( room temp) & analyzed
3. Long-Term Stability
• Should exceed the time between
the date of first and last sample analysis.
• 3 Low and High QCs compared
with 1st
day long term stability testing
34.
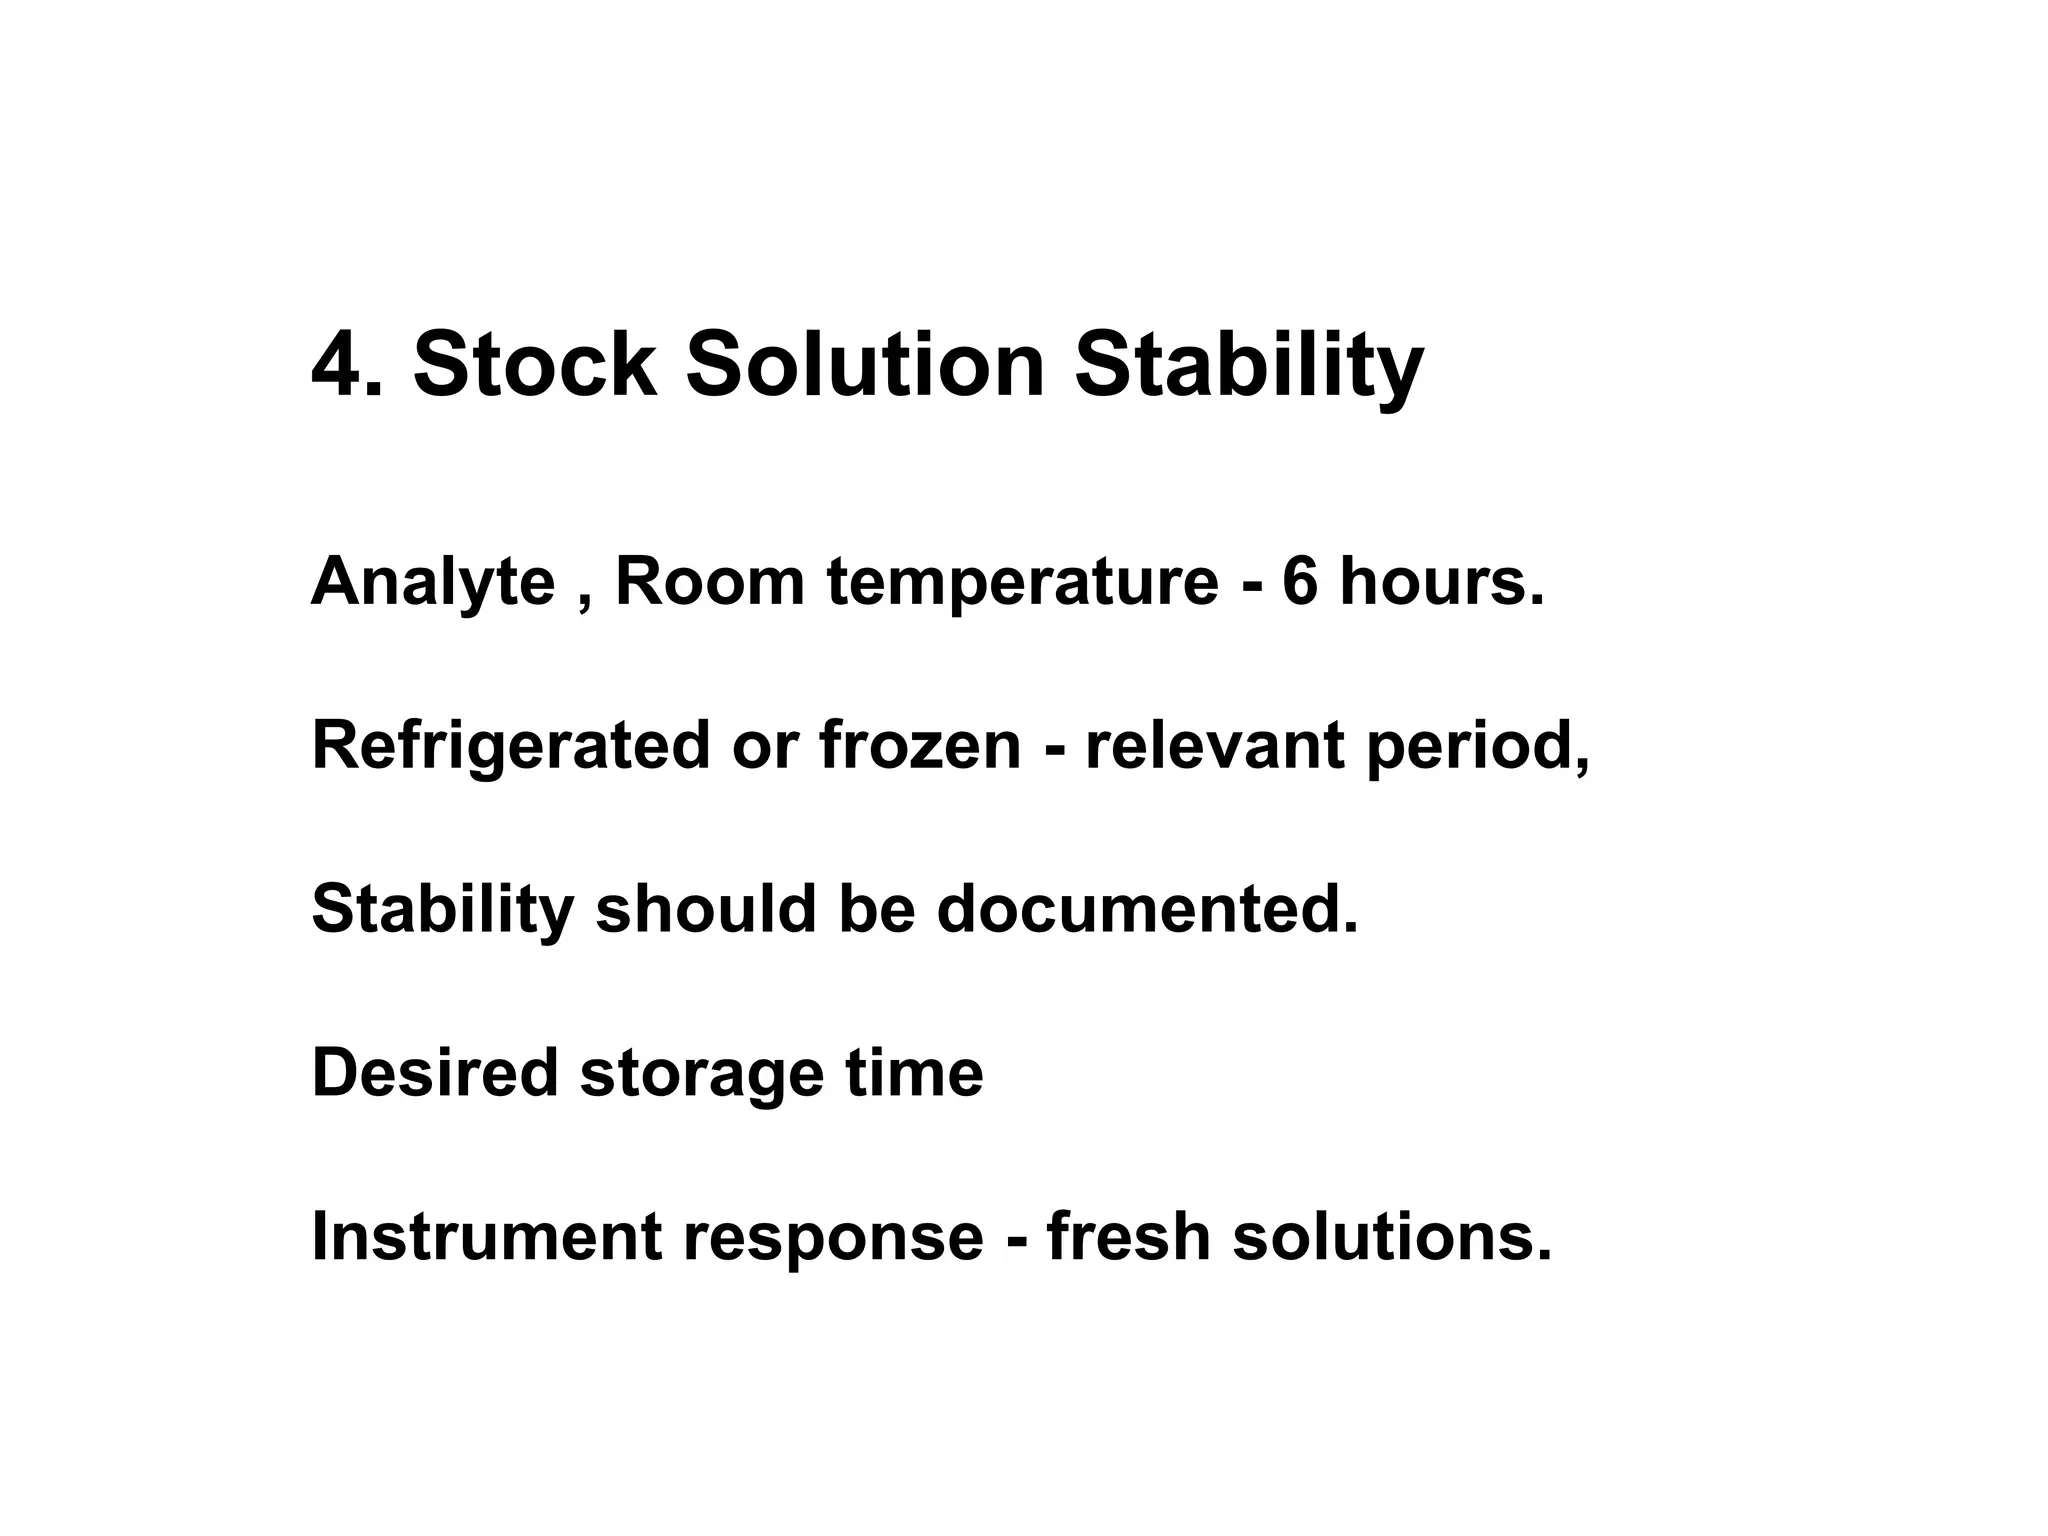
4. Stock SolutionStability
Analyte , Room temperature - 6 hours.
Refrigerated or frozen - relevant period,
Stability should be documented.
Desired storage time
Instrument response - fresh solutions.
35.
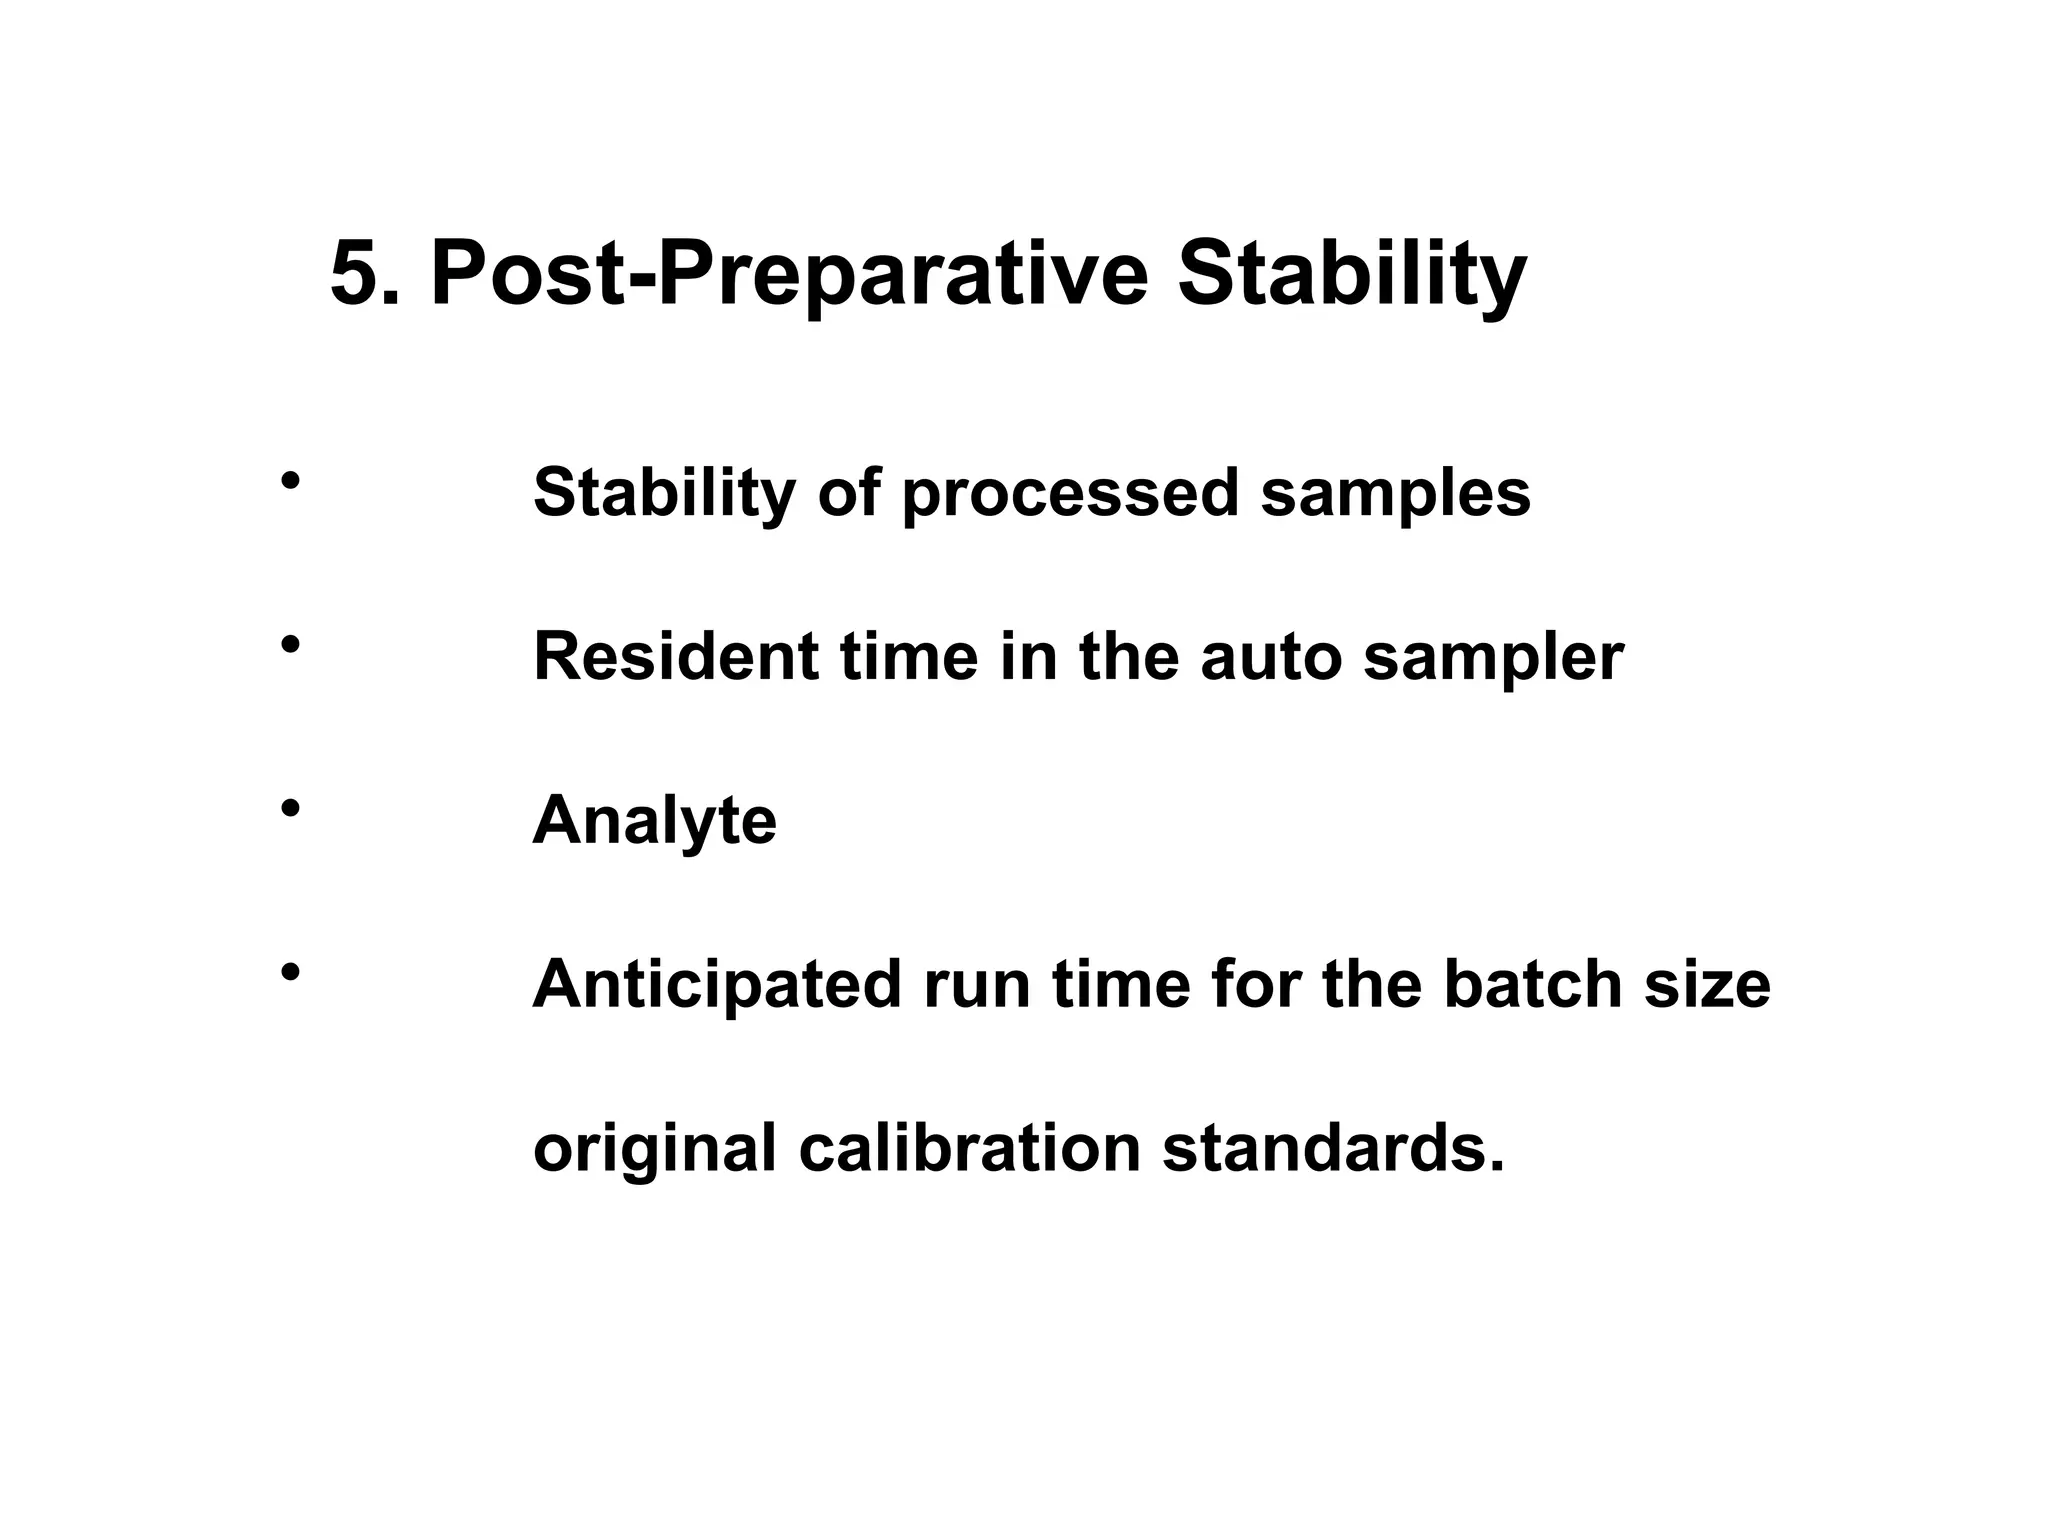
5. Post-Preparative Stability
•Stability of processed samples
• Resident time in the auto sampler
• Analyte
• Anticipated run time for the batch size
original calibration standards.
36.
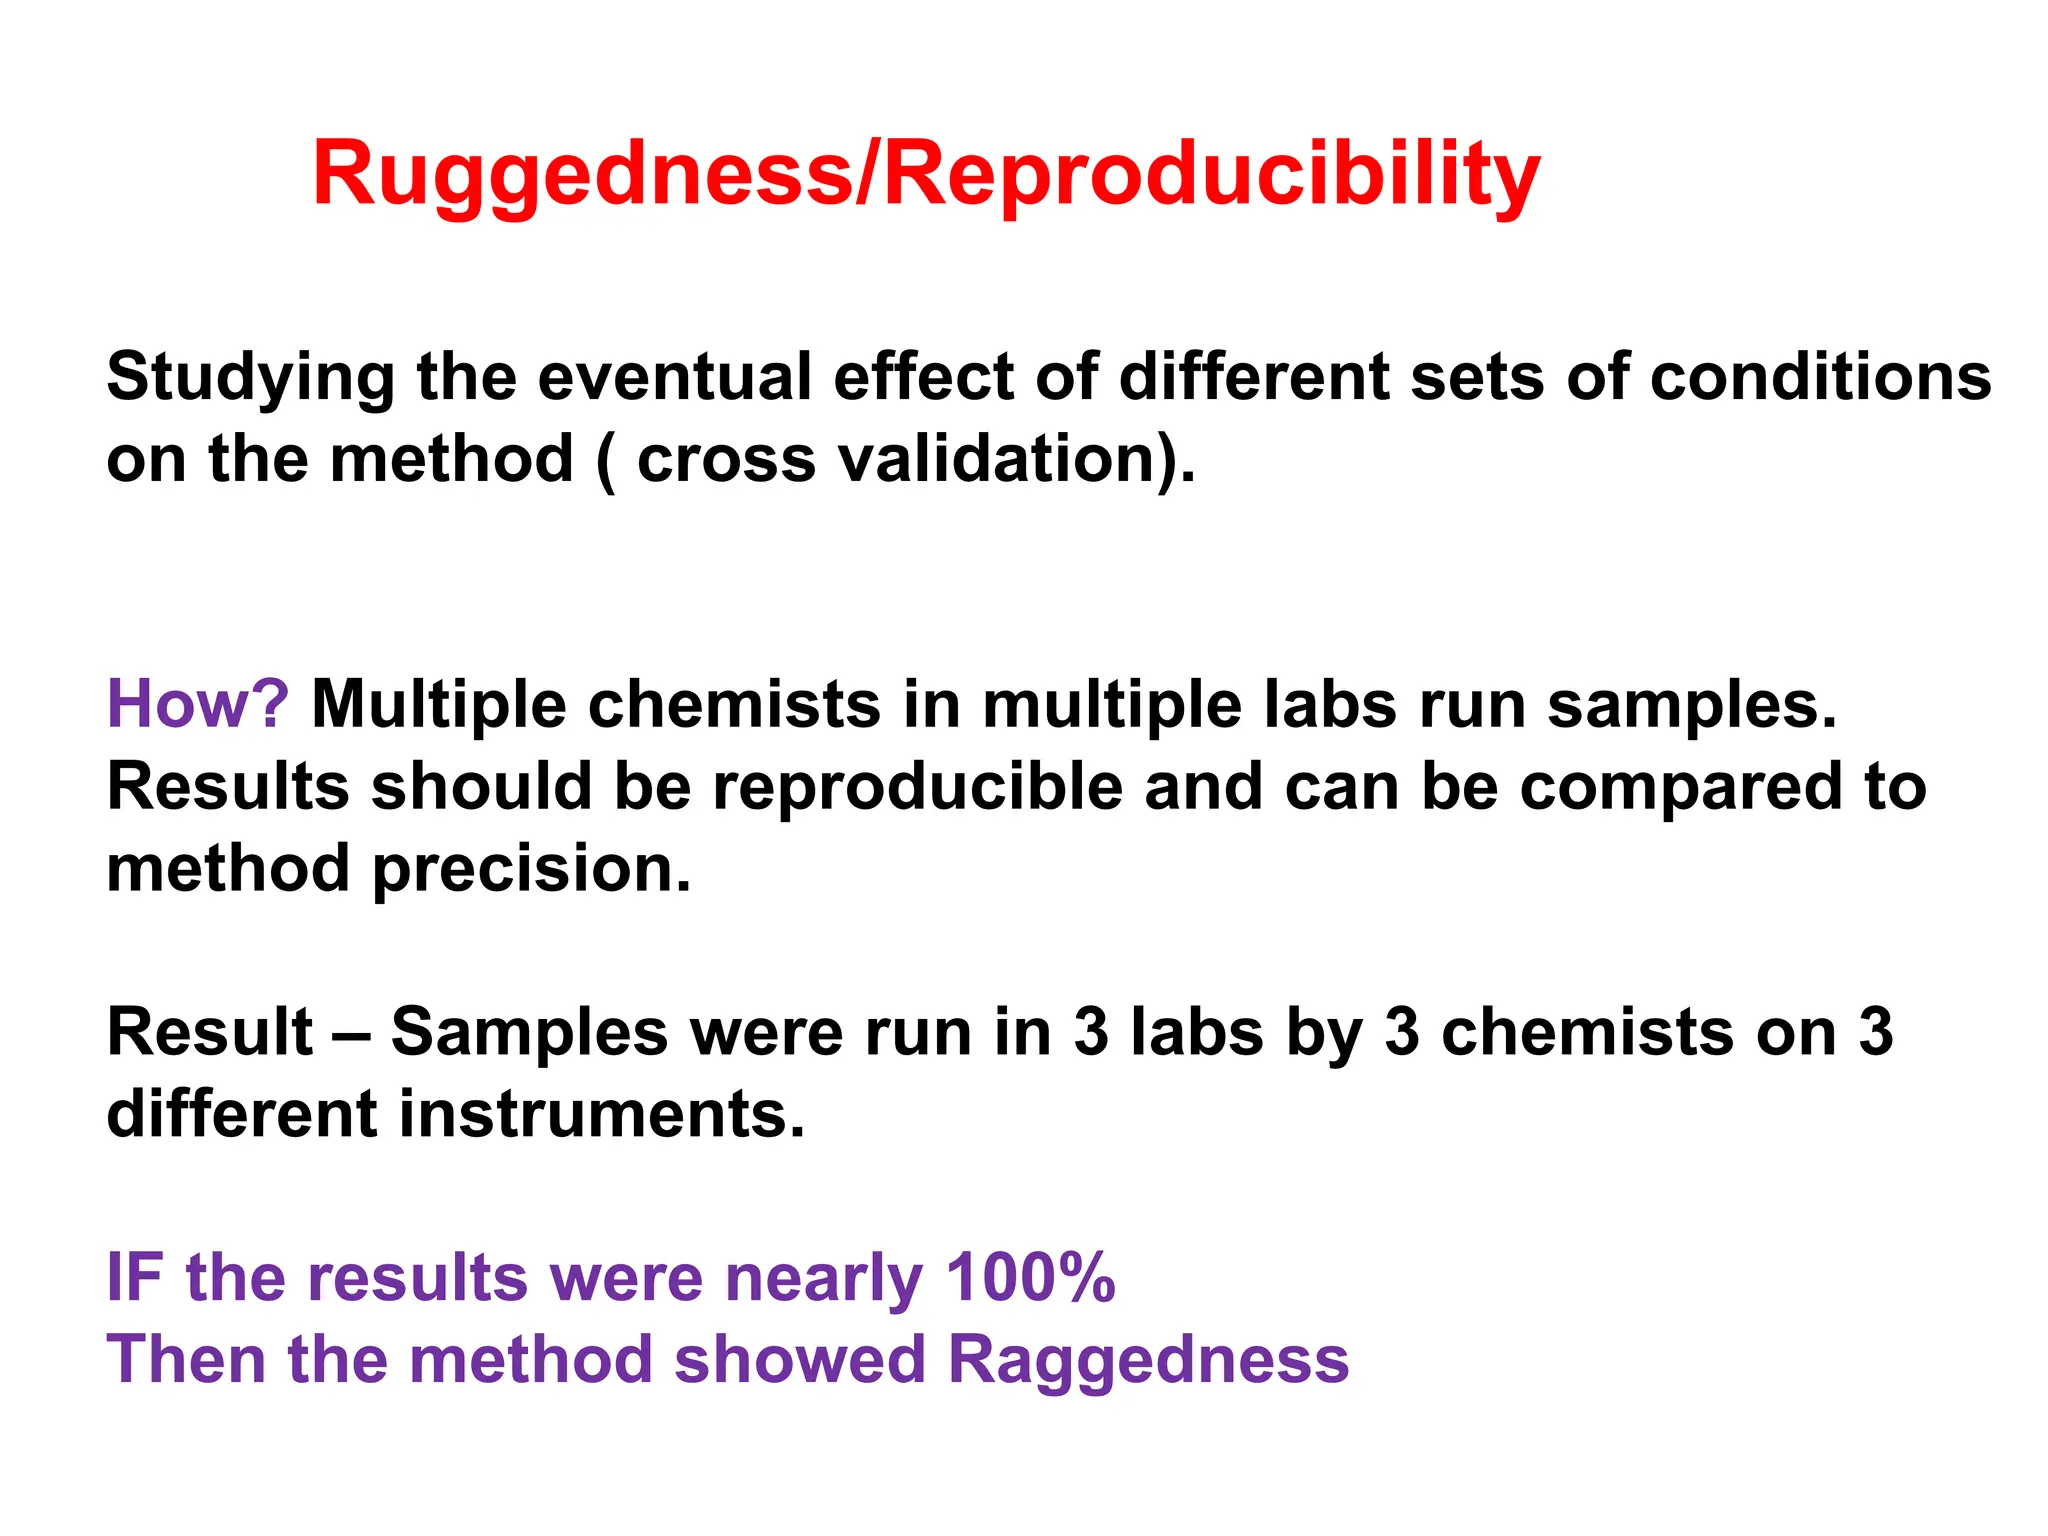
Ruggedness/Reproducibility
Studying the eventualeffect of different sets of conditions
on the method ( cross validation).
How? Multiple chemists in multiple labs run samples.
Results should be reproducible and can be compared to
method precision.
Result – Samples were run in 3 labs by 3 chemists on 3
different instruments.
IF the results were nearly 100%
Then the method showed Raggedness
37.
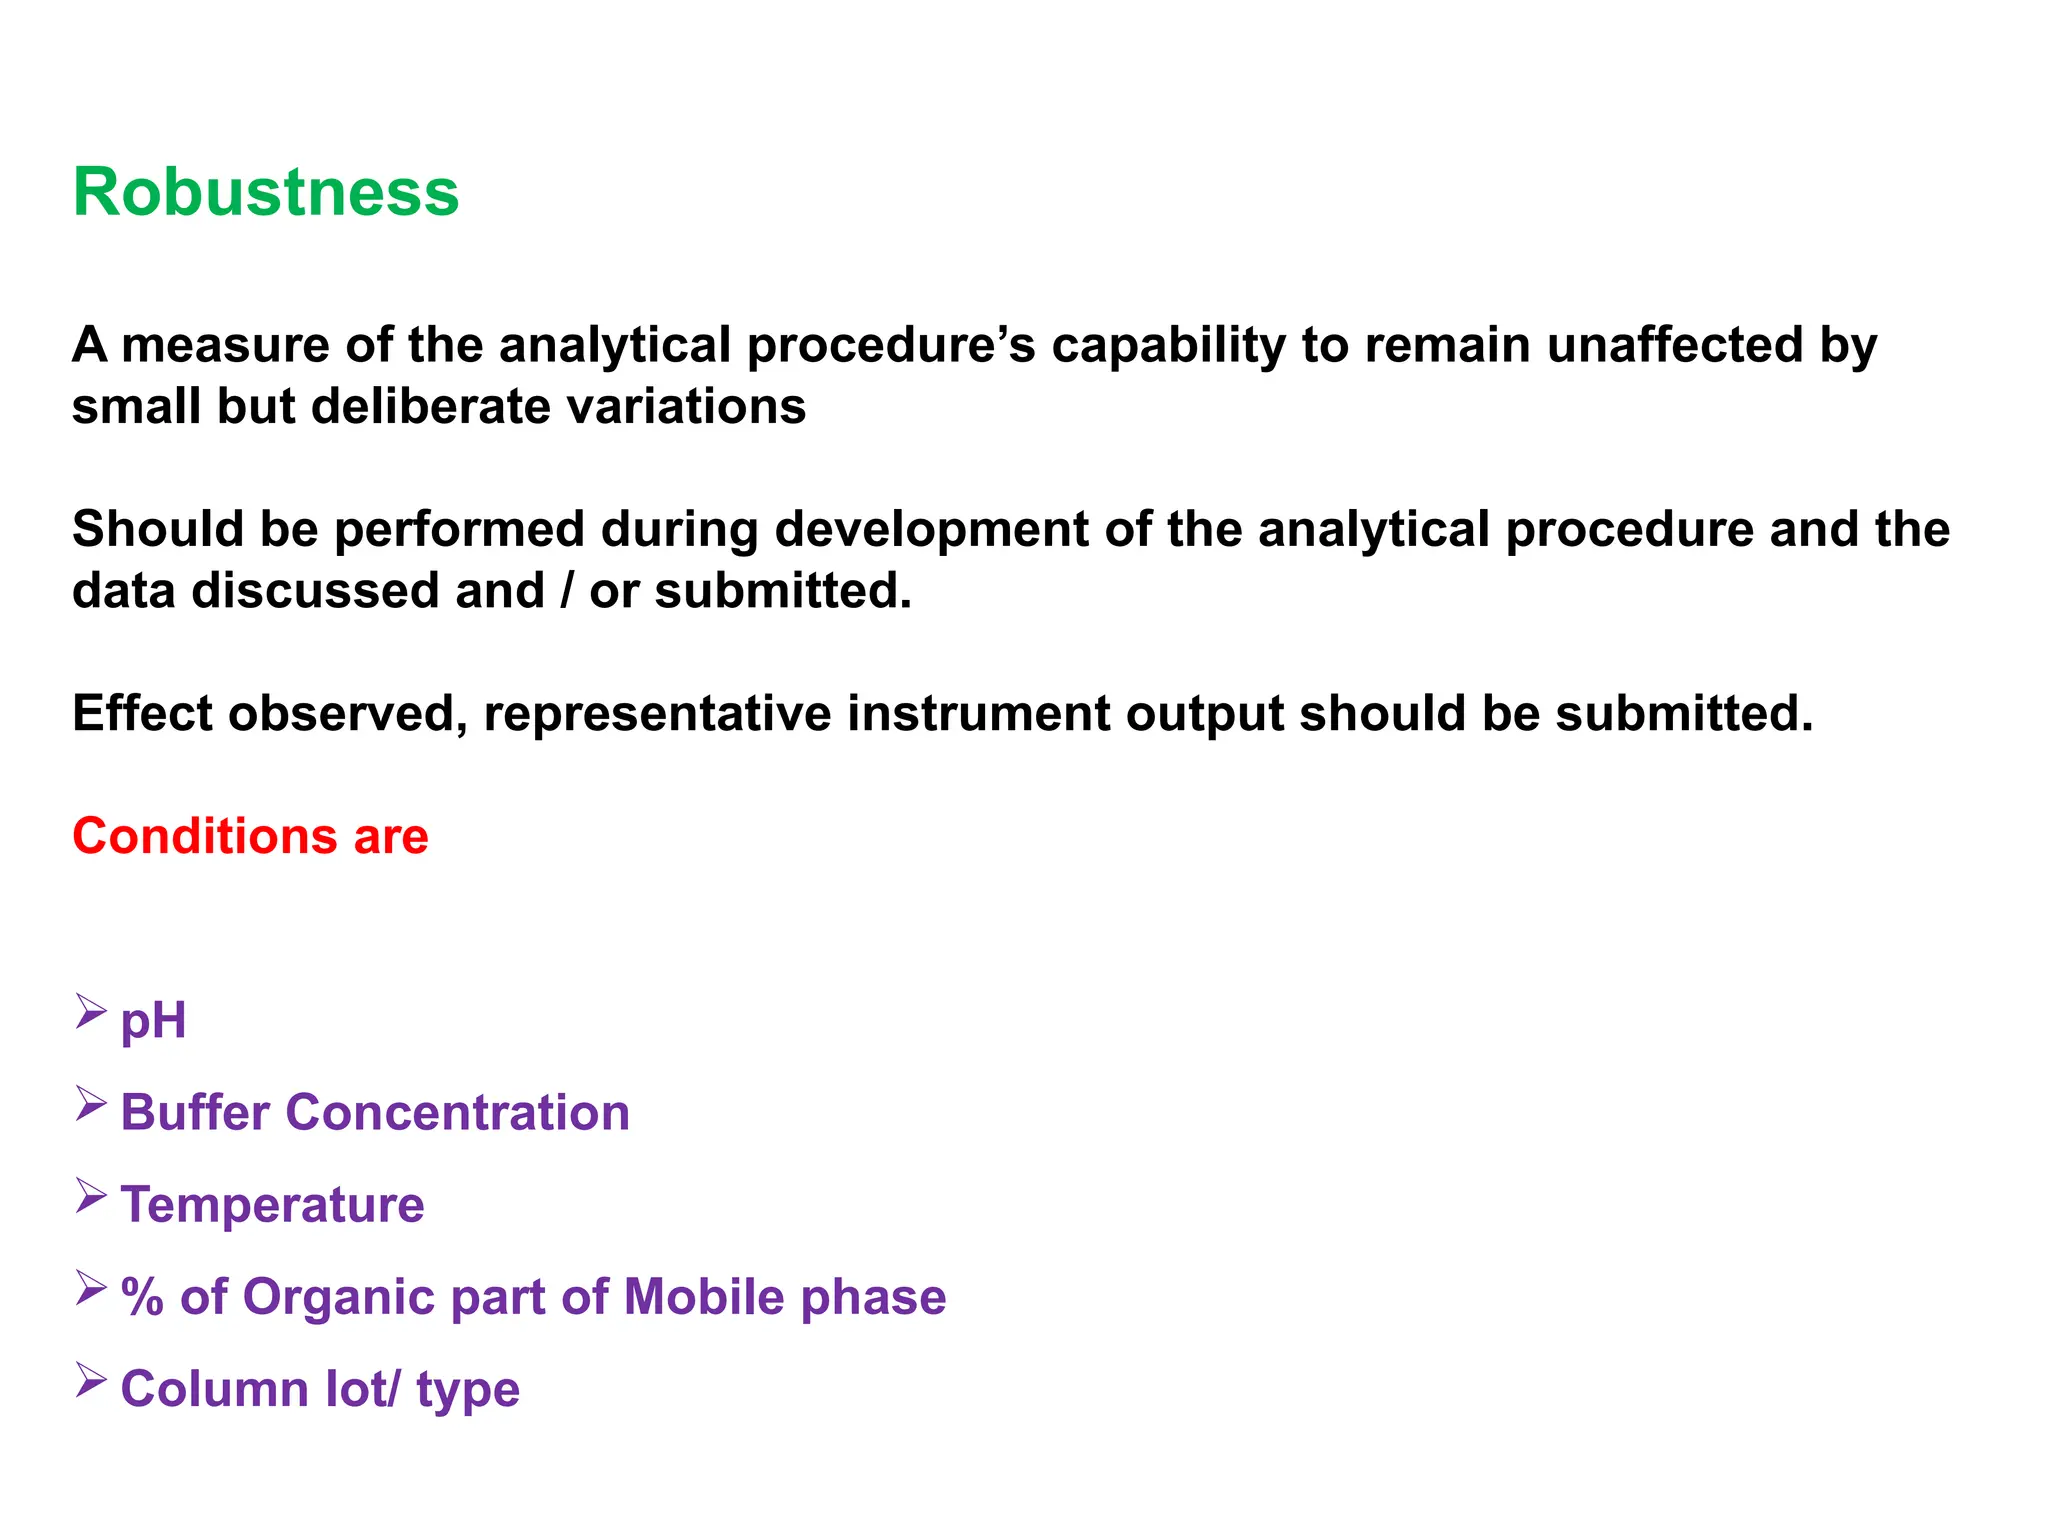
Robustness
A measure ofthe analytical procedure’s capability to remain unaffected by
small but deliberate variations
Should be performed during development of the analytical procedure and the
data discussed and / or submitted.
Effect observed, representative instrument output should be submitted.
Conditions are
pH
Buffer Concentration
Temperature
% of Organic part of Mobile phase
Column lot/ type
38.
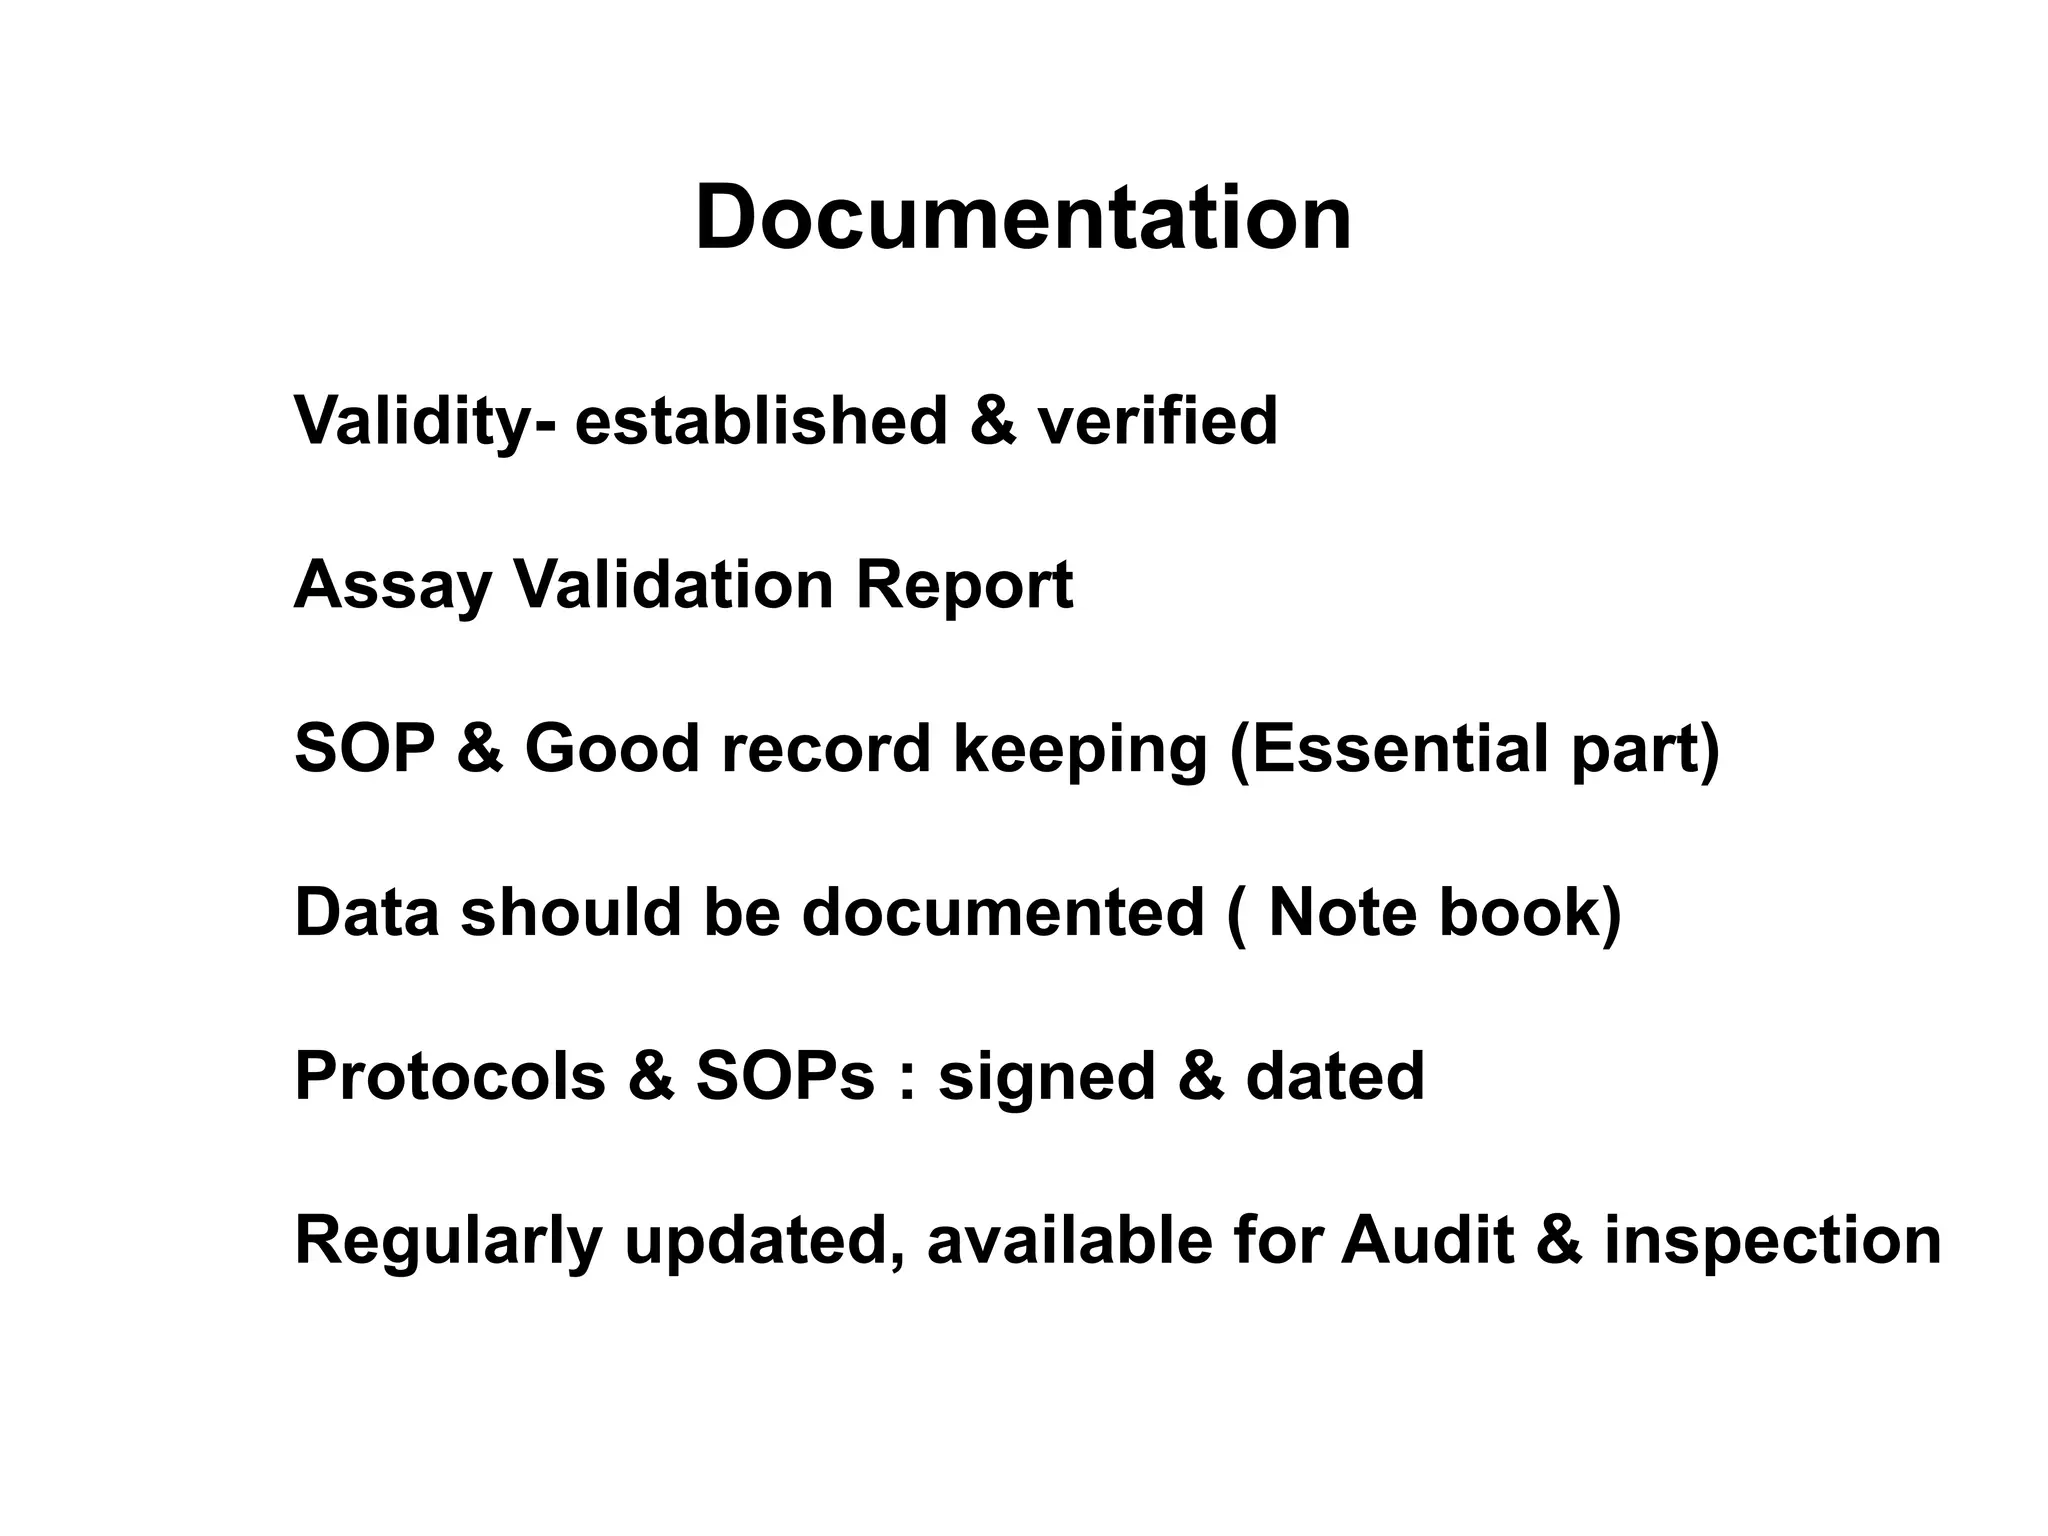
Documentation
Validity- established &verified
Assay Validation Report
SOP & Good record keeping (Essential part)
Data should be documented ( Note book)
Protocols & SOPs : signed & dated
Regularly updated, available for Audit & inspection
39.
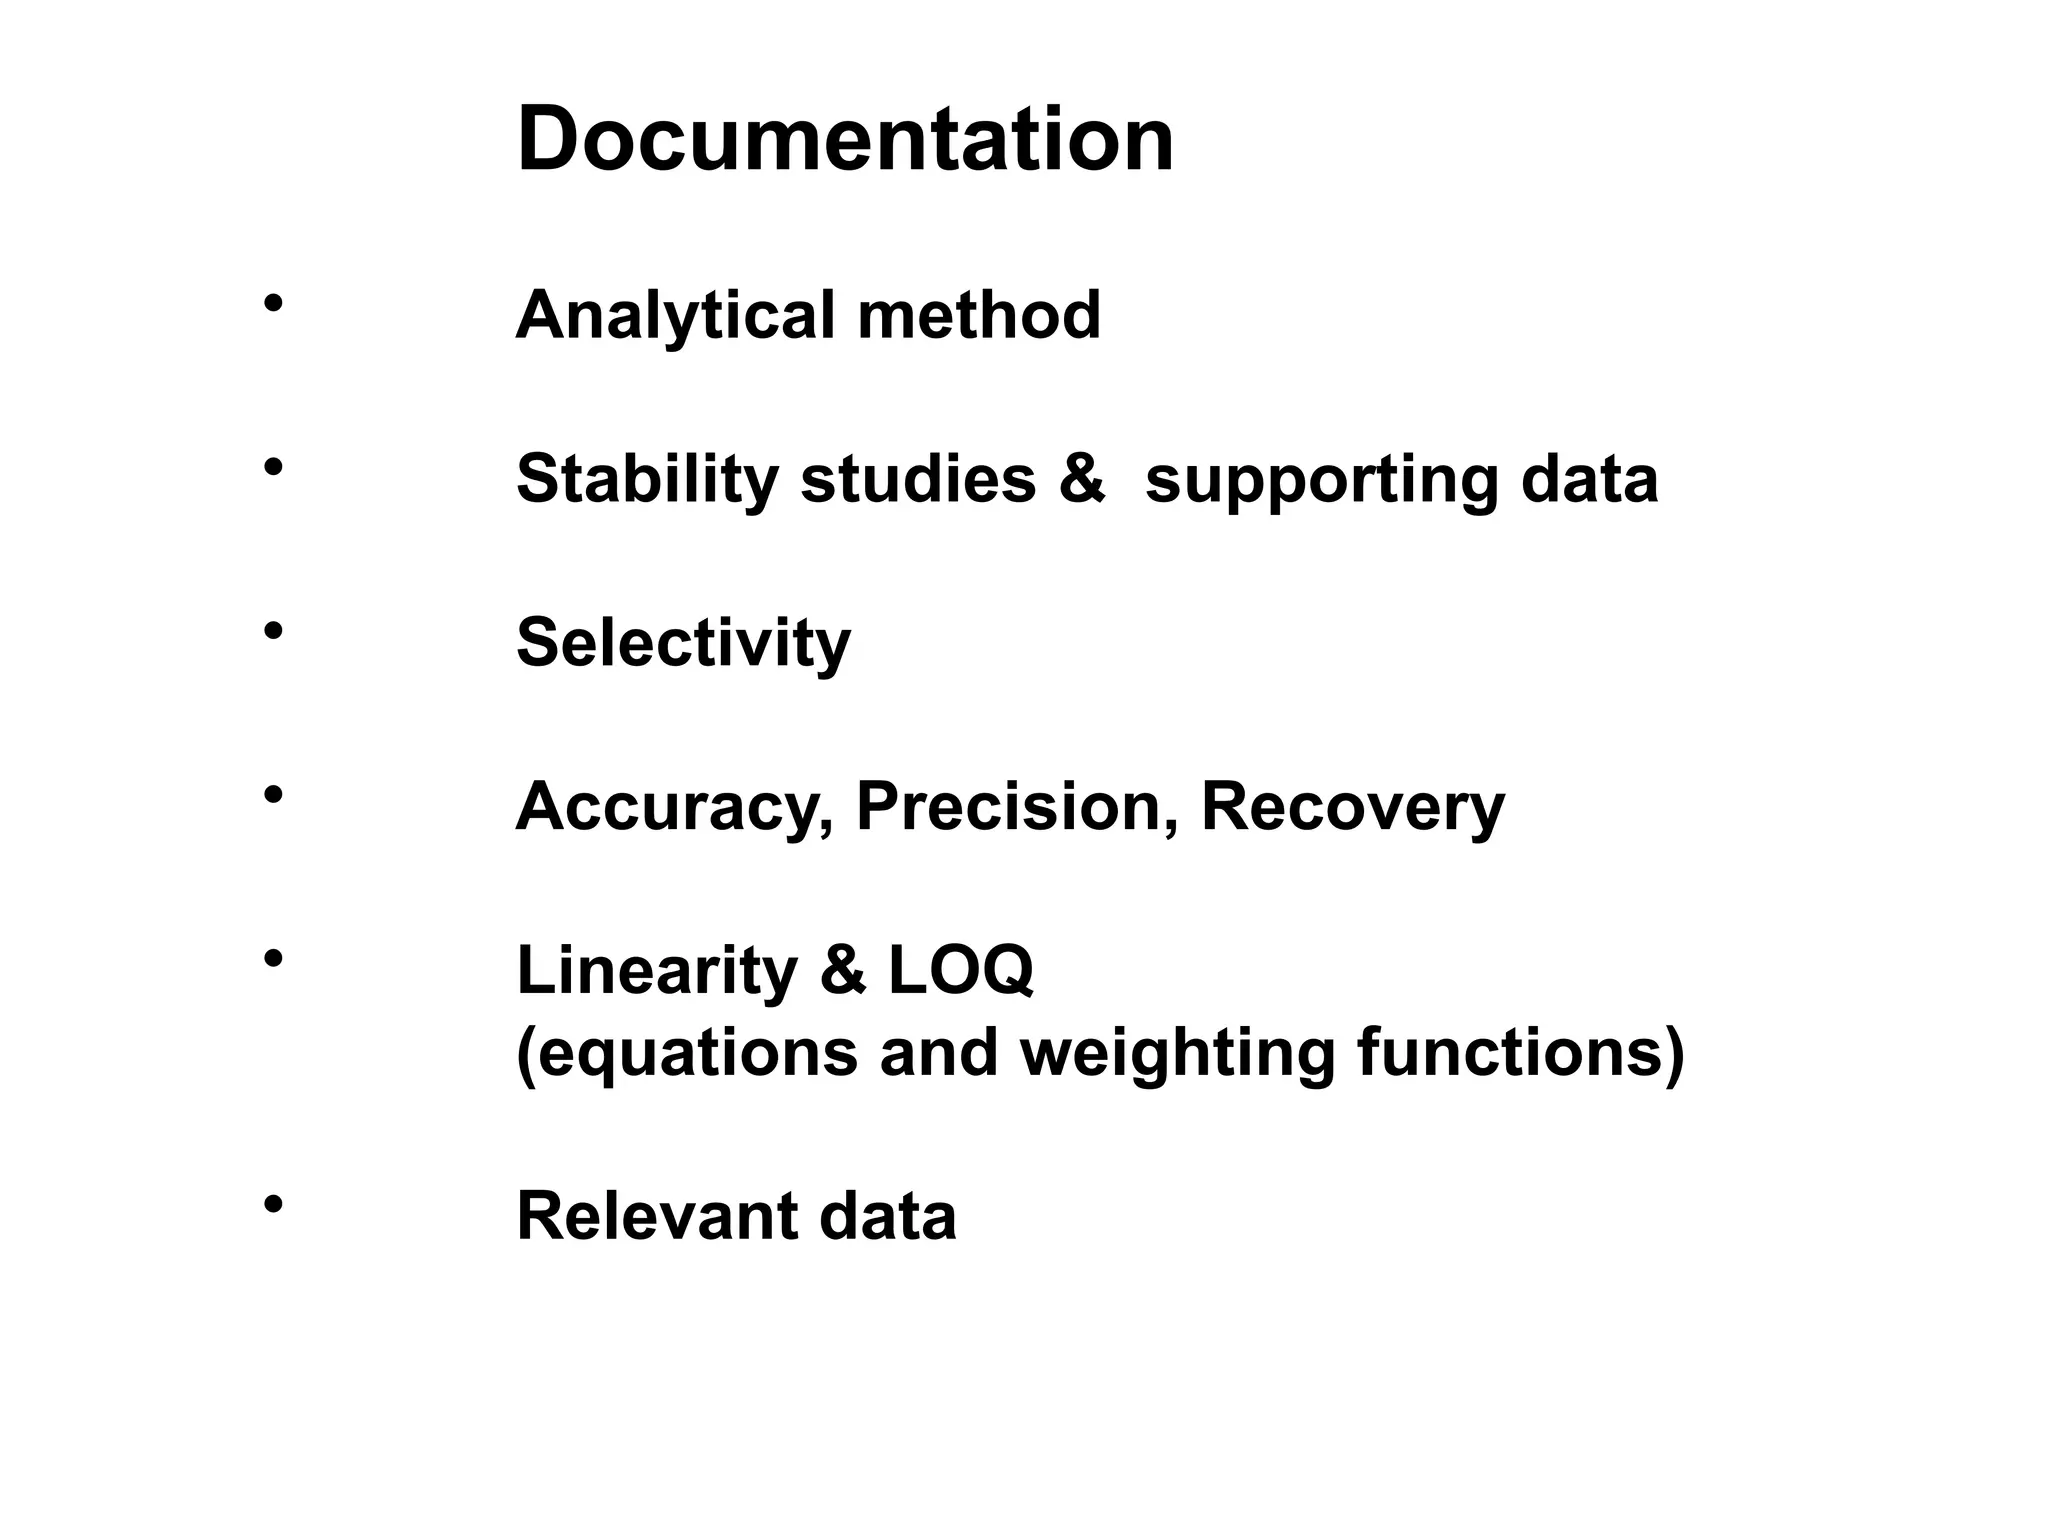
Documentation
• Analytical method
•Stability studies & supporting data
• Selectivity
• Accuracy, Precision, Recovery
• Linearity & LOQ
(equations and weighting functions)
• Relevant data
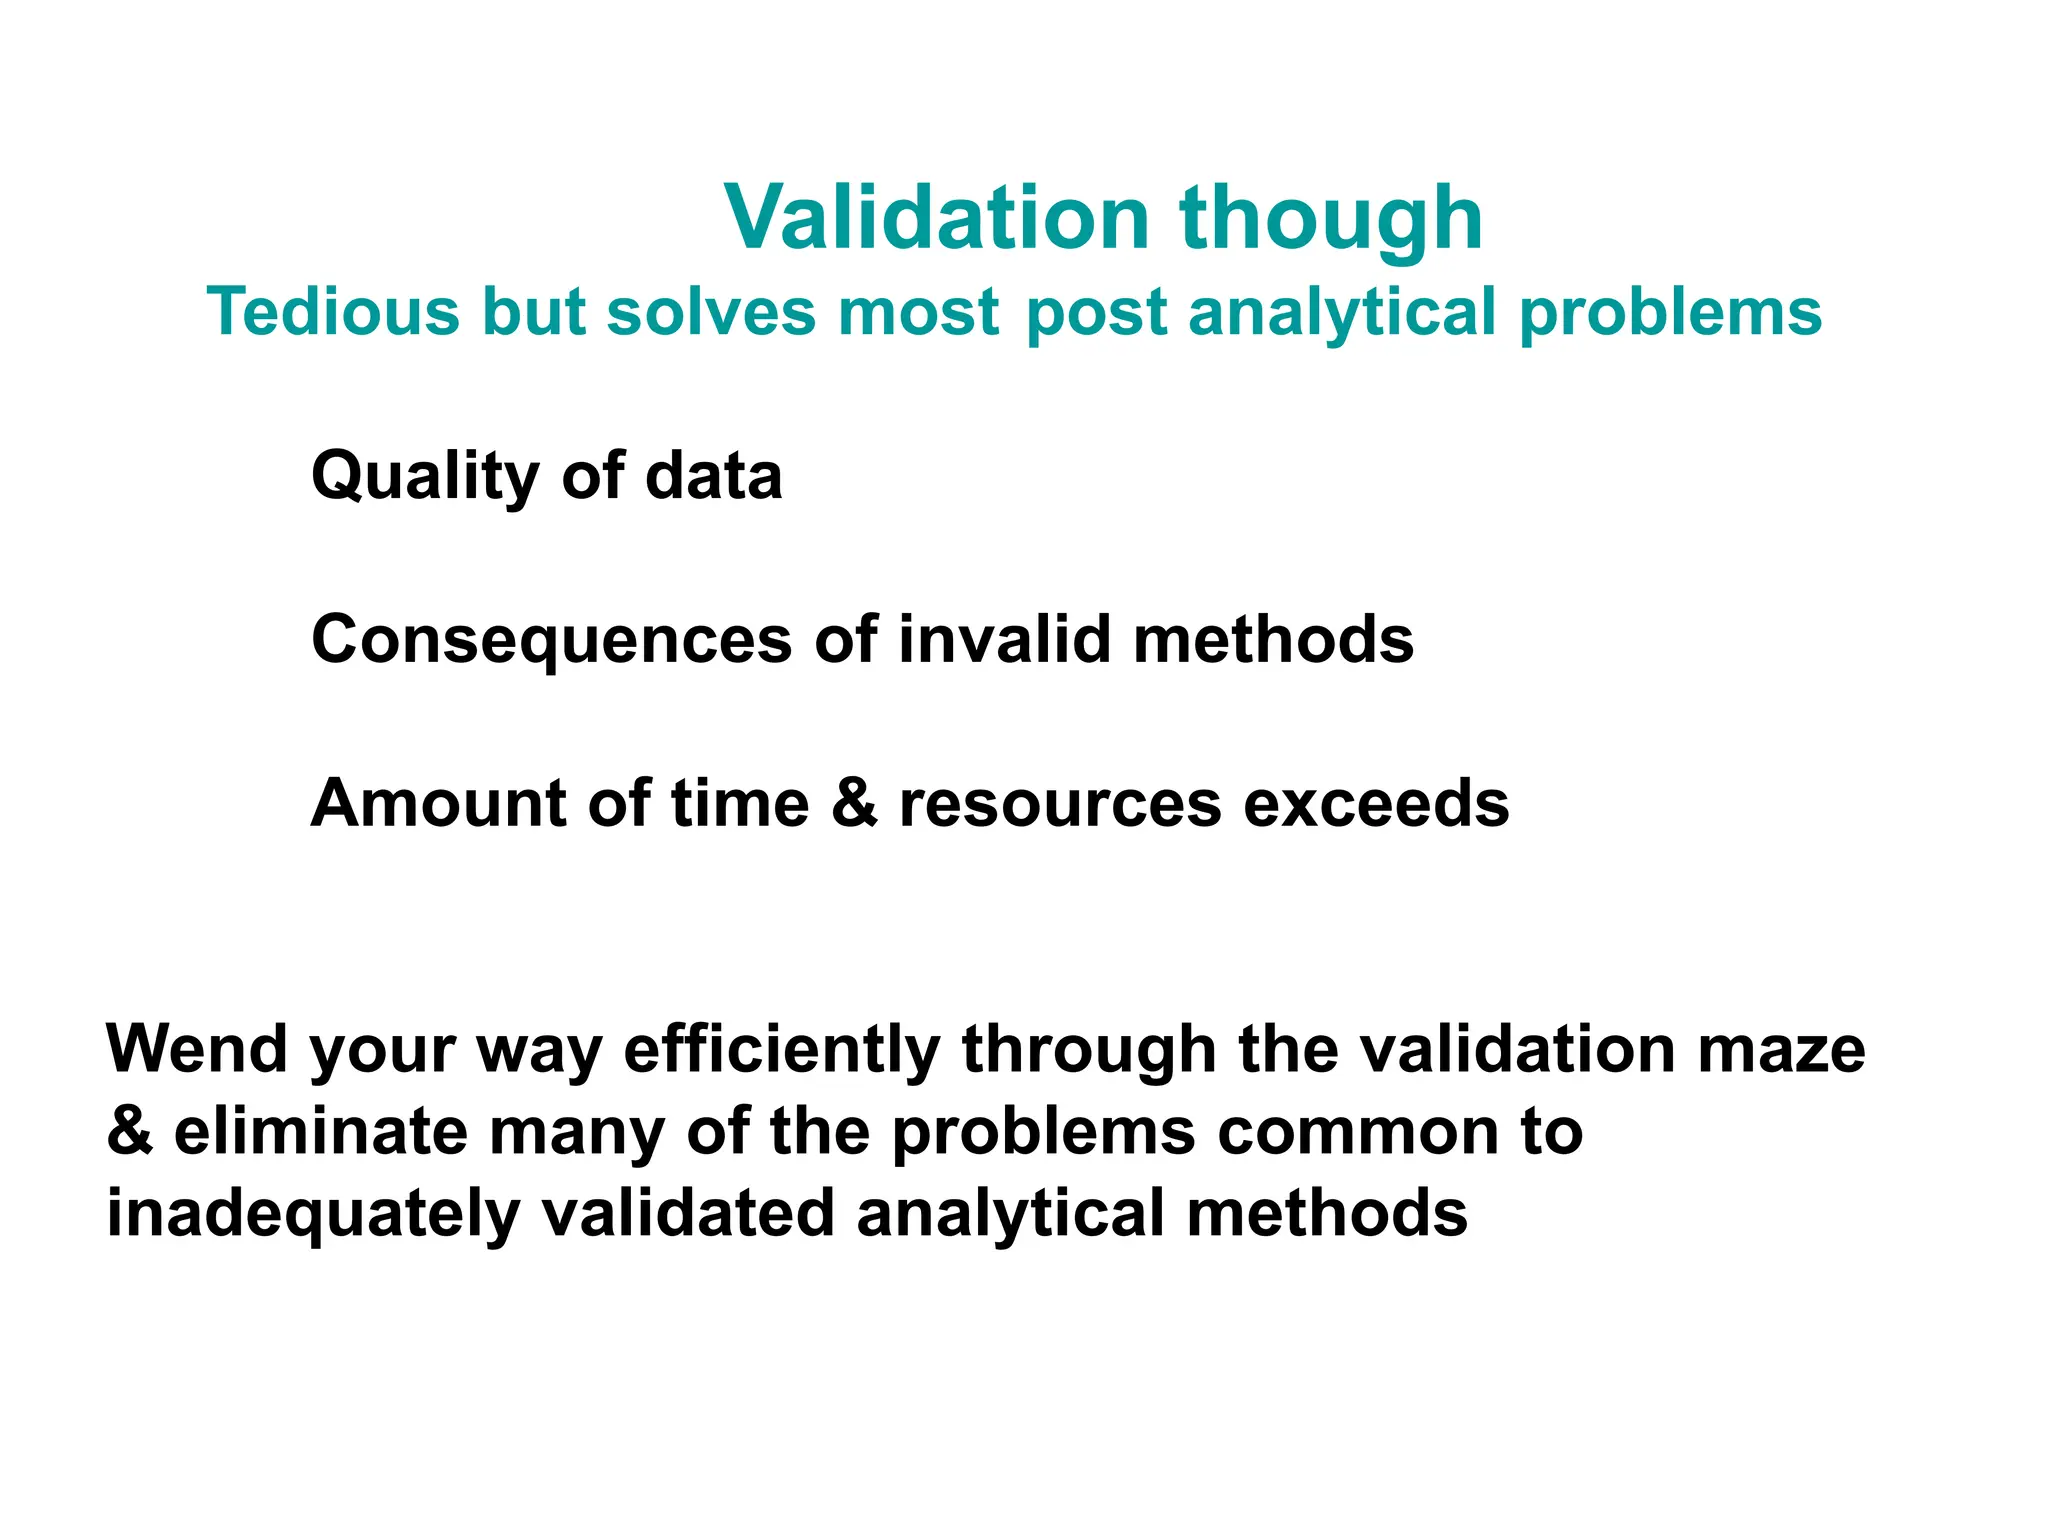
Validation though
Tedious butsolves most post analytical problems
Quality of data
Consequences of invalid methods
Amount of time & resources exceeds
Wend your way efficiently through the validation maze
& eliminate many of the problems common to
inadequately validated analytical methods