1. 12th Nov’14 Aaj Ka Trend
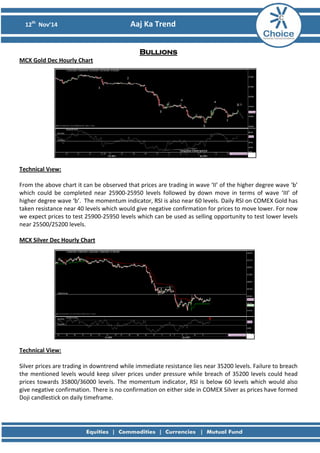
Bullions MCX Gold Dec Hourly Chart
Technical View: From the above chart it can be observed that prices are trading in wave ‘II’ of the higher degree wave ‘b’ which could be completed near 25900-25950 levels followed by down move in terms of wave ‘III’ of higher degree wave ‘b’. The momentum indicator, RSI is also near 60 levels. Daily RSI on COMEX Gold has taken resistance near 40 levels which would give negative confirmation for prices to move lower. For now we expect prices to test 25900-25950 levels which can be used as selling opportunity to test lower levels near 25500/25200 levels. MCX Silver Dec Hourly Chart
Technical View: Silver prices are trading in downtrend while immediate resistance lies near 35200 levels. Failure to breach the mentioned levels would keep silver prices under pressure while breach of 35200 levels could head prices towards 35800/36000 levels. The momentum indicator, RSI is below 60 levels which would also give negative confirmation. There is no confirmation on either side in COMEX Silver as prices have formed Doji candlestick on daily timeframe.
2. 12th Nov’14 Aaj Ka Trend
Fundamental News:
• Gold futures pressured by broadly stronger U.S. dollar.
• Gold prices fell for the second consecutive session on Tuesday, as a broadly stronger U.S. dollar dampened the appeal of the precious metal.
• On the Comex division of the New York Mercantile Exchange, gold futures for December delivery traded at $1,156.20 a troy ounce during U.S. morning hours, down $3.60, or 0.31%.
Pivot Levels for the Day:
S1
S2
S3
Pivot
R1
R2
R3
Gold
25527
25257
24812
25702
25972
26147
26592
Silver
34415
34024
33371
34677
35068
35330
35983
Recommendation:
Gold
Sell
Silver
Sell
3. 12th Nov’14 Aaj Ka Trend
Base Metals MCX Copper Nov Hourly Chart
Technical Views: Copper prices initially moved lower however prices have taken support near 61.8 % retracement level of the up move from 403 – 416 levels. The RSI is hovering near 60 levels above which Prices would gain momentum in prices. For now, we expect prices could test 416 levels above which 420 levels can be expected as long as 407 levels are protected on downside.
MCX Aluminum Nov Hourly Chart
MCX Lead Nov Hourly Chart
MCX Nickel Nov Hourly Chart
MCX Zinc Nov Hourly Chart
4. 12th Nov’14 Aaj Ka Trend
Fundamental News:
• Copper futures fall to 1-week low as stronger dollar weighs
• Copper futures fell to a one-week low on Tuesday, as a broadly stronger U.S. dollar and speculation slowing economic growth in China will dampen demand for the industrial metal weighed
Pivot Levels for the Day:
S1
S2
S3
Pivot
R1
R2
R3
Copper
409.2
405.7
400.2
411.2
414.7
416.7
422.2
Aluminum
125.1
123.5
120.9
126.0
127.7
128.6
131.1
Lead
124.6
123.3
121.4
125.3
126.5
127.2
129.2
Nickel
937.3
922.0
898.2
945.8
961.1
969.6
993.4
Zinc
138.2
136.6
134.2
139.1
140.6
141.5
144.0
Recommendation:
Copper
Buy
Aluminum
Buy
Lead
Buy
Nickel
Buy
Zinc
Neutral
5. 12th Nov’14 Aaj Ka Trend
Energy MCX Crude Nov Hourly Chart:
Technical Views: Crude prices have taken support near multiple support of 4710 levels and prices have formed hammer on hourly timeframe which is suggesting pullback till 4850 levels. Downside remains limited to4700 levels. NYMEX Crude prices has an immediate support of 76.5$ levels, as long as mentioned levels are protected prices can move towards 78.40$ levels. MCX Natural Gas Oct Hourly Chart:
Technical Views: Natural gas prices gave gap down opening below the uptrend line suggesting that the trend could have completed and new trend in downward direction of sideways are taking place. The sudden shift from bullish to bearish in RSI suggests weakness in prices. For now as long as 267 levels are capped on higher side 254/250 levels can be expected.
6. 12th Nov’14 Aaj Ka Trend
Fundamental News:
• Oil futures decline as supply-demand concerns weigh
• Oil futures extended losses from the previous session, as lingering concerns over weakening demand and ample global supplies weighed
• Prices recovered to last trade at $82.46 a barrel during U.S. morning hours, down 49 cents, or 0.59%.
• Natural gas futures plunge 3% with weather in focus.
• U.S. natural gas prices fell sharply, extending steep losses from the previous session as investors cashed out of the market to lock in gains from a recent rally which took futures to four-month highs.
Pivot Levels for the Day:
S1
S2
S3
Pivot
R1
R2
R3
Crude
4730
4686
4613
4759
4803
4832
4905
Natural Gas
256
249.3
237.3
261.3
268
273.3
285.30
Recommendation:
Crude
Buy
Natural Gas
Sell
8. 12th Nov’14 Aaj Ka Trend
This is solely for information of clients of Choice Broking and does not construe to be an investment advice. It is also not intended as an offer or solicitation for the purchase and sale of any financial instruments. Any action taken by you on the basis of the information contained herein is your responsibility alone and Choice Broking its subsidiaries or its employees or associates will not be liable in any manner for the consequences of such action taken by you. We have exercised due diligence in checking the correctness and authenticity of the information contained in this recommendation, but Choice Broking or any of its subsidiaries or associates or employees shall not be in any way responsible for any loss or damage that may arise to any person from any inadvertent error in the information contained in this recommendation or any action taken on basis of this information. Technical analysis studies market psychology, price patterns and volume levels. It is used to forecast future price and market movements. Technical analysis is complementary to fundamental analysis and news sources. The recommendations issued herewith might be contrary to recommendations issued by Choice Broking in the company research undertaken as the recommendations stated in this report is derived purely from technical analysis. Choice Broking has based this document on information obtained from sources it believes to be reliable but which it has not independently verified; Choice Broking makes no guarantee, representation or warranty and accepts no responsibility or liability as to its accuracy or completeness. The opinions contained within the report are based upon publicly available information at the time of publication and are subject to change without notice. The information and any disclosures provided herein are in summary form and have been prepared for informational purposes. The recommendations and suggested price levels are intended purely for trading purposes. The recommendations are valid for the day of the report however trading trends and volumes might vary substantially on an intraday basis and the recommendations may be subject to change. The information and any disclosures provided herein may be considered confidential. Any use, distribution, modification, copying, forwarding or disclosure by any person is strictly prohibited. The information and any disclosures provided herein do not constitute a solicitation or offer to purchase or sell any security or other financial product or instrument. The current performance may be unaudited. Past performance does not guarantee future returns. There can be no assurance that investments will achieve any targeted rates of return, and there is no guarantee against the loss of your entire investment. POTENTIAL CONFLICT OF INTEREST DISCLOSURE (as on date of report) Disclosure of interest statement – • Analyst interest of the stock /Instrument(s): - No. • Firm interest of the stock / Instrument (s): - No.
Disclaimer