1. Equities I Commodities I Currencies I Mutual Funds
Aaj Ka Trend
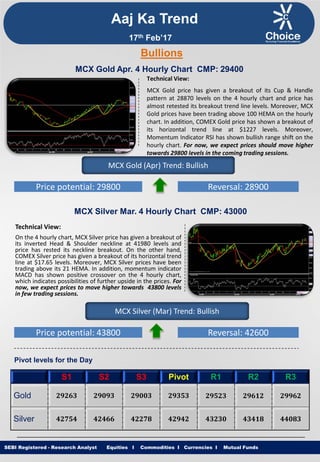
Technical View:
MCX Gold price has given a breakout of its Cup & Handle
pattern at 28870 levels on the 4 hourly chart and price has
almost retested its breakout trend line levels. Moreover, MCX
Gold prices have been trading above 100 HEMA on the hourly
chart. In addition, COMEX Gold price has shown a breakout of
its horizontal trend line at $1227 levels. Moreover,
Momentum Indicator RSI has shown bullish range shift on the
hourly chart. For now, we expect prices should move higher
towards 29800 levels in the coming trading sessions.
SEBI Registered - Research Analyst Equities I Commodities I Currencies I Mutual Funds
Bullions
MCX Gold Apr. 4 Hourly Chart CMP: 29400
MCX Gold (Apr) Trend: Bullish
Price potential: 29800 Reversal: 28900
MCX Silver Mar. 4 Hourly Chart CMP: 43000
Technical View:
On the 4 hourly chart, MCX Silver price has given a breakout of
its inverted Head & Shoulder neckline at 41980 levels and
price has rested its neckline breakout. On the other hand,
COMEX Silver price has given a breakout of its horizontal trend
line at $17.65 levels. Moreover, MCX Silver prices have been
trading above its 21 HEMA. In addition, momentum indicator
MACD has shown positive crossover on the 4 hourly chart,
which indicates possibilities of further upside in the prices. For
now, we expect prices to move higher towards 43800 levels
in few trading sessions.
MCX Silver (Mar) Trend: Bullish
Price potential: 43800 Reversal: 42600
Pivot levels for the Day
S1 S2 S3 Pivot R1 R2 R3
Gold 29263 29093 29003 29353 29523 29612 29962
Silver 42754 42466 42278 42942 43230 43418 44083
17th Feb’17
2. Equities I Commodities I Currencies I Mutual Funds
Technical View:
MCX Copper price has given the breakout of its falling wedge
pattern at 402 levels on the hourly chart and price has retested its
breakout trend line at 399 levels. On the hourly chart, COMEX
Copper price has shown a breakout of its horizontal trend line at
2.75 levels. Furthermore, momentum indicator MACD has shown
positive crossover and moved above its signal line levels on the
hourly time frame, which suggests some huge upside momentum
in the prices. For now, we expect prices to move higher
towards 412 levels in coming trading sessions.
SEBI Registered - Research Analyst Equities I Commodities I Currencies I Mutual Funds
MCX Copper Feb. Hourly Chart CMP: 401
MCX Copper (Feb) Trend: Bullish
Price potential: 412 Reversal: 385
MCX Crude Oil Feb. Hourly Chart CMP: 3550
Technical View:
MCX Crude Oil price has faced the resistance of its falling
trend line at 3600 levels. Moreover, prices have been trading
below 200 HEMA. Furthermore, NYMEX Crude Oil prices
have given a breakdown of its rising trend line at $53.90
levels on the hourly chart. Moreover, Momentum indicator
RSI has remained below 60 levels on the hourly chart which
suggests negative movement in the prices. For now, we
expect prices to move lower towards 3450 levels in coming
trading sessions.
MCX Crude Oil (Feb) Trend: Bearish
Price potential: 3450 Reversal: 3610
Pivot levels for the Day
S1 S2 S3 Pivot R1 R2 R3
Copper 397.0 392.9 387.6 402 406 412 426
Crude 3524 3500 3467 3557 3581 3614 3704
Base Metal
Energy
Aaj Ka Trend
17th Feb’17
3. Equities I Commodities I Currencies I Mutual FundsSEBI Registered - Research Analyst Equities I Commodities I Currencies I Mutual Funds
Other Base Metals & Energy
S1 S2 S3 Pivot R1 R2 R3 Trend
Copper 397.0 392.9 387.6 402 406 412 426
Aluminum 126.1 125.1 124.4 126.8 127.7 128.4 130.8
Lead 150.6 148.9 145.8 153.7 155.4 158.5 166.4
Nickel 728.2 719.8 715.0 733.0 741.4 746.2 764.2
Zinc 188.9 187.0 184.4 191.6 193.5 196.1 203.3
Natural Gas 190.1 187.9 184.1 193.9 196.1 199.9 209.8
Fundamental News:
Although the number of housing starts issued in the U.S. unexpectedly fell in January, the percentage drop was
due to an upward revision to prior data and the number of units along with building permits both beat
expectations, bolstering optimism over the health of the U.S. housing sector, official data showed Thursday.
In a report, the U.S. Commerce Department said that housing starts fell by 2.6% from the month before to hit a
seasonally adjusted 1.246 million units last month from December’s total of 1.279 million units, an upward
revision from the initial 1.226 million. Analysts had expected January’s reading to slip from the initial reading of
the last month of 2017 to 1.222 million units.
Meanwhile, the number of building permits issued jumped by 4.6% to a seasonally adjusted 1.285 million
units last month from 1.228 million (initially 1.210 million) in December. Economists had forecast permits to rise
by just 0.2% to 1.230 million units in January.
The number of people who filed for unemployment assistance in the U.S. last week rose less than expected,
holding close to the lowest level since 1973, official data showed on Thursday.
The U.S. Department of Labor said the number of individuals filing for initial jobless benefits in the week ending
February 11 increased by 5,000 to a seasonally adjusted 239,000 from the previous week’s total of 234,000.
Oil prices were slightly higher on Thursday, supported by OPEC led supply cuts, but concerns over rising
inventories and U.S. crude production weighed.
Although estimates suggest compliance by OPEC is around 90%, rising U.S. stocks and a revival of U.S. oil output
have limited price gains.
Aaj Ka Trend
17th Feb’17
4. Equities I Commodities I Currencies I Mutual FundsSEBI Registered - Research Analyst Equities I Commodities I Currencies I Mutual Funds
International Market
Commodity Closing Price
Gold 1235
Silver 17.95
Crude Oil 53.87
Brent Crude Oil 56.79
Natural Gas 3.04
COMEX/NYMEX/ICE ( Precious Metals & Energy) Currency & Commodity Index
Currency (Spot) Current Price
USD / INR 66.84
Dollar Index 100.71
EUR / USD 1.06
CRB Index* 194.03
Closing as on 16.02.17 *Closing as on 16.02.17
LME (Base Metals) ( $ per tones)
Commodity Closing Price
Copper 6090
Aluminum 1875
Zinc 2924
Lead 2400
Nickel 10660
SHFE (Base Metals) (Yuan per tones)
Commodity Closing Price
Copper 49500
Aluminum 13940
Zinc 23780
Lead 19600
Closing as on 16.02.17 Closing as on 16.02.17
LME INVENTORY DATA
Aaj Ka Trend
10-Feb-17 13-Feb-17 14-Feb-17 15-Feb-17 16-Feb-17
Aluminium -6201 -5450 -5075 -8775 -3950
Copper -3324 -375 -4775 -7525 900
Lead -202 -50 600 -25 -25
Nickel -719 1175 -1495 -936 -510
Zinc -752 225 -2350 14425 -1800
17th Feb’17
5. Equities I Commodities I Currencies I Mutual Funds
This is solely for information of clients of Choice Broking and does not construe to be an investment advice. It is also not intended as an offer or solicitation
for the purchase and sale of any financial instruments. Any action taken by you on the basis of the information contained herein is your responsibility alone
and Choice Broking its subsidiaries or its employees or associates will not be liable in any manner for the consequences of such action taken by you. We
have exercised due diligence in checking the correctness and authenticity of the information contained in this recommendation, but Choice Broking or any of
its subsidiaries or associates or employees shall not be in any way responsible for any loss or damage that may arise to any person from any inadvertent
error in the information contained in this recommendation or any action taken on basis of this information. Technical analysis studies market psychology,
price patterns and volume levels. It is used to forecast future price and market movements. Technical analysis is complementary to fundamental analysis
and news sources. The recommendations issued herewith might be contrary to recommendations issued by Choice Broking in the company research
undertaken as the recommendations stated in this report is derived purely from technical analysis. Choice Broking has based this document on information
obtained from sources it believes to be reliable but which it has not independently verified; Choice Broking makes no guarantee, representation or warranty
and accepts no responsibility or liability as to its accuracy or completeness. The opinions contained within the report are based upon publicly available
information at the time of publication and are subject to change without notice. The information and any disclosures provided herein are in summary form
and have been prepared for informational purposes. The recommendations and suggested price levels are intended purely for trading purposes. The
recommendations are valid for the day of the report however trading trends and volumes might vary substantially on an intraday basis and the
recommendations may be subject to change. The information and any disclosures provided herein may be considered confidential. Any use, distribution,
modification, copying, forwarding or disclosure by any person is strictly prohibited. The information and any disclosures provided herein do not constitute a
solicitation or offer to purchase or sell any security or other financial product or instrument. The current performance may be unaudited. Past performance
does not guarantee future returns. There can be no assurance that investments will achieve any targeted rates of return, and there is no guarantee against
the loss of your entire investment.
POTENTIAL CONFLICT OF INTEREST DISCLOSURE (as on date of report) Disclosure of interest statement – • Analyst interest of the stock
/Instrument(s): - No. • Firm interest of the stock / Instrument (s): - No.
Disclaimer
Contact Us
Amit Pathania
Research Associate
amit.pathania@choiceindia.com
www.choicebroking.incustomercare@choiceindia.com
SEBI Registered - Research Analyst Equities I Commodities I Currencies I Mutual Funds
Aaj Ka Trend
17th Feb’17
Neeraj Yadav
Research Advisor
neeraj.yadav@choiceindia.com
Anish Vyas
Senior Research Associate
anish.vyas@choiceindia.com
Kkunal Parar
Digitally signed by Kkunal Parar
DN: cn=Kkunal Parar, o=Choice Equity
Broking Pvt Ltd., ou=Research Dept.,
email=kkunal.parar@choiceindia.com, c=IN
Date: 2017.02.17 09:52:01 +05'30'