1. Equities I Commodities I Currencies I Mutual Funds
Aaj Ka Trend
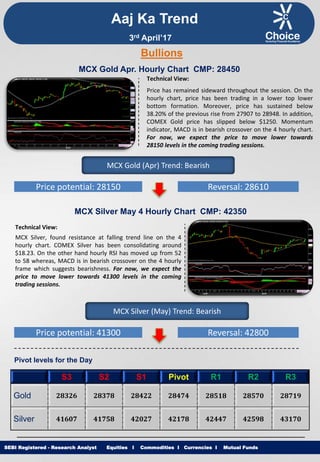
Technical View:
Price has remained sideward throughout the session. On the
hourly chart, price has been trading in a lower top lower
bottom formation. Moreover, price has sustained below
38.20% of the previous rise from 27907 to 28948. In addition,
COMEX Gold price has slipped below $1250. Momentum
indicator, MACD is in bearish crossover on the 4 hourly chart.
For now, we expect the price to move lower towards
28150 levels in the coming trading sessions.
SEBI Registered - Research Analyst Equities I Commodities I Currencies I Mutual Funds
Bullions
MCX Gold Apr. Hourly Chart CMP: 28450
MCX Gold (Apr) Trend: Bearish
Price potential: 28150 Reversal: 28610
MCX Silver May 4 Hourly Chart CMP: 42350
Technical View:
MCX Silver, found resistance at falling trend line on the 4
hourly chart. COMEX Silver has been consolidating around
$18.23. On the other hand hourly RSI has moved up from 52
to 58 whereas, MACD is in bearish crossover on the 4 hourly
frame which suggests bearishness. For now, we expect the
price to move lower towards 41300 levels in the coming
trading sessions.
MCX Silver (May) Trend: Bearish
Price potential: 41300 Reversal: 42800
Pivot levels for the Day
S3 S2 S1 Pivot R1 R2 R3
Gold 28326 28378 28422 28474 28518 28570 28719
Silver 41607 41758 42027 42178 42447 42598 43170
3rd April’17
2. Equities I Commodities I Currencies I Mutual Funds
Technical View:
MCX Copper price has fallen below the rising trend which
triggered a correction towards 378. It also slipped below
100 EMA on the hourly chart. RSI has remained below the
horizontal line on the hourly chart. Moreover, momentum
indicator MACD on the hourly frame is in bearish
crossover. For now, we expect prices to move lower
towards 370 levels in coming trading sessions.
SEBI Registered - Research Analyst Equities I Commodities I Currencies I Mutual Funds
MCX Copper Apr. Hourly Chart CMP: 380.95
MCX Copper (Apr) Trend: Bearish
Price potential: 370 Reversal: 386
MCX Crude Oil (Apr) Hourly Chart CMP: 3287
Technical View:
MCX Crude price has moved up above recent trading range in
the hourly chart. Moreover, price has been sustaining above
100 EMA on the hourly chart. In addition, NYMEX Crude has
moved above $50. Hourly RSI is pegged above 60. Moreover,
4 hourly MACD is in a buy mode. For now, we expect
prices to move higher towards 3380 levels in the few
trading session.
MCX Crude Oil (March) Trend: Bullish
Price potential: 3380 Reversal: 3230
Pivot levels for the Day
S3 S2 S1 Pivot R1 R2 R3
Copper 371.2 374.6 377.7 381 384 388 398
Crude 3218 3232 3257 3271 3296 3310 3362
Base Metal
Energy
Aaj Ka Trend
3rd April’17
3. Equities I Commodities I Currencies I Mutual FundsSEBI Registered - Research Analyst Equities I Commodities I Currencies I Mutual Funds
Other Base Metals & Energy
S3 S2 S1 Pivot R1 R2 R3 Trend
Copper 371.2 374.6 377.7 381 384 388 398
Aluminum 124.1 124.9 125.6 126.4 127.1 127.9 130.3
Lead 146.5 147.7 148.7 149.9 150.9 152.1 155.4
Nickel 624.7 632.3 636.7 644.3 648.7 656.3 676.0
Zinc 176.4 178.2 179.4 181.2 182.4 184.2 189.0
Natural Gas 198.6 201.9 203.6 206.9 208.6 211.9 220.2
Fundamental News:
The dollar moved lower against other major currencies on Friday, after the release of disappointing U.S.
personal spending data, although overall optimism over the strength of the economy still lent support.
China's largest crude oil buyer Sinopec aims to ship more cargoes from Brazil, the United States and Canada, to
help ensure stable crude supplies as the Middle East boosts refining capacity and Africa suffers disruptions.
Swiss-based commodities trading and mining giant Glencore (LON:GLEN) is in advanced talks to sell a bundle of
its global oil storage stakes, sources familiar with the matter said, following a boom period for storage
companies.
Gold prices dipped in Asia on Friday with a stronger dollar weighing on demand, but support coming on political
risks, including a meeting next week in Florida between President Donald Trump and China's President Xi Jinping
as well as elections in France and chances of a far-right government.
U.S. consumer spending barely rose in February amid delays in the payment of income tax refunds, but the
biggest annual increase in inflation in nearly five years supported expectations of further interest rate hikes this
year.
The U.S. economy is on track to expand at a 0.9 percent annualized pace in the first quarter following the
release of data on consumer spending and income in February, the Atlanta Federal Reserve's GDP Now forecast
model showed on Friday.
Aaj Ka Trend
3rd April’17
4. Equities I Commodities I Currencies I Mutual FundsSEBI Registered - Research Analyst Equities I Commodities I Currencies I Mutual Funds
International Market
Commodity Closing Price
Gold 1250
Silver 18.23
Crude Oil 50.57
Brent Crude Oil 53.45
Natural Gas 3.21
COMEX/NYMEX/ICE ( Precious Metals & Energy) Currency & Commodity Index
Currency (Spot) Current Price
USD / INR 64.80
Dollar Index 100.26
EUR / USD 1.06
CRB Index* 185.88
Closing as on 31.03.17 *Closing as on 31.03.17
LME (Base Metals) ( $ per tones)
Commodity Closing Price
Copper 5837
Aluminum 1962
Zinc 2771
Lead 2340
Nickel 10025
SHFE (Base Metals) (Yuan per tones)
Commodity Closing Price
Copper 47830
Aluminum 13895
Zinc 23450
Lead 17255
Closing as on 31.03.17 Closing as on 31.03.17
LME INVENTORY DATA
Aaj Ka Trend
27-March-17 28-March-17 29-March-17 30-March-17 31-March-17
Aluminium -9925 -12975 -11225 -13625 -12050
Copper -1150 -2150 -4950 -6725 -6375
Lead 175 175 -50 -1050 -1925
Nickel -108 -978 -1314 -1464 -888
Zinc -1100 -575 -350 -975 -950
3rd April’17
5. Equities I Commodities I Currencies I Mutual Funds
This is solely for information of clients of Choice Broking and does not construe to be an investment advice. It is also not intended as an offer or solicitation
for the purchase and sale of any financial instruments. Any action taken by you on the basis of the information contained herein is your responsibility alone
and Choice Broking its subsidiaries or its employees or associates will not be liable in any manner for the consequences of such action taken by you. We
have exercised due diligence in checking the correctness and authenticity of the information contained in this recommendation, but Choice Broking or any of
its subsidiaries or associates or employees shall not be in any way responsible for any loss or damage that may arise to any person from any inadvertent
error in the information contained in this recommendation or any action taken on basis of this information. Technical analysis studies market psychology,
price patterns and volume levels. It is used to forecast future price and market movements. Technical analysis is complementary to fundamental analysis
and news sources. The recommendations issued herewith might be contrary to recommendations issued by Choice Broking in the company research
undertaken as the recommendations stated in this report is derived purely from technical analysis. Choice Broking has based this document on information
obtained from sources it believes to be reliable but which it has not independently verified; Choice Broking makes no guarantee, representation or warranty
and accepts no responsibility or liability as to its accuracy or completeness. The opinions contained within the report are based upon publicly available
information at the time of publication and are subject to change without notice. The information and any disclosures provided herein are in summary form
and have been prepared for informational purposes. The recommendations and suggested price levels are intended purely for trading purposes. The
recommendations are valid for the day of the report however trading trends and volumes might vary substantially on an intraday basis and the
recommendations may be subject to change. The information and any disclosures provided herein may be considered confidential. Any use, distribution,
modification, copying, forwarding or disclosure by any person is strictly prohibited. The information and any disclosures provided herein do not constitute a
solicitation or offer to purchase or sell any security or other financial product or instrument. The current performance may be unaudited. Past performance
does not guarantee future returns. There can be no assurance that investments will achieve any targeted rates of return, and there is no guarantee against
the loss of your entire investment.
POTENTIAL CONFLICT OF INTEREST DISCLOSURE (as on date of report) Disclosure of interest statement – • Analyst interest of the stock
/Instrument(s): - No. • Firm interest of the stock / Instrument (s): - No.
Disclaimer
Contact Us
Amit Pathania
Research Associate
amit.pathania@choiceindia.com
www.choicebroking.incustomercare@choiceindia.com
SEBI Registered - Research Analyst Equities I Commodities I Currencies I Mutual Funds
Aaj Ka Trend
3rd April’17
Neeraj Yadav
Research Advisor
neeraj.yadav@choiceindia.com
Anish Vyas
Senior Research Associate
anish.vyas@choiceindia.com
Rupak De
Research Associate
rupak.de@choiceindia.com
Amit Pathania
Digitally signed by Amit Pathania
DN: cn=Amit Pathania, o=Choice Equity Broking Pvt. ltd,
ou=Research Department,
email=amit.pathania@choiceindia.com, c=IN
Date: 2017.04.03 08:28:54 +05'30'