1. 13th Oct’14 Equity Bazaar
Nifty
Nifty Technical View:
After given gap down opening, Nifty prices falls & made day’s lows but during mid-session bulls were entered extraordinarily & pulled price at higher level, but bulls fail they strength & finally Nifty future has given closing near intraday low.
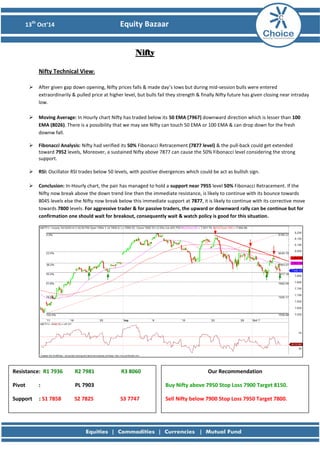
Moving Average: In Hourly chart Nifty has traded below its 50 EMA (7967) downward direction which is lesser than 100 EMA (8026). There is a possibility that we may see Nifty can touch 50 EMA or 100 EMA & can drop down for the fresh downw fall.
Fibonacci Analysis: Nifty had verified its 50% Fibonacci Retracement (7877 level) & the pull-back could get extended toward 7952 levels, Moreover, a sustained Nifty above 7877 can cause the 50% Fibonacci level considering the strong support.
RSI: Oscillator RSI trades below 50 levels, with positive divergences which could be act as bullish sign.
Conclusion: In-Hourly chart, the pair has managed to hold a support near 7955 level 50% Fibonacci Retracement. If the Nifty now break above the down trend line then the immediate resistance, is likely to continue with its bounce towards 8045 levels else the Nifty now break below this immediate support at 7877, it is likely to continue with its corrective move towards 7800 levels. For aggressive trader & for passive traders, the upward or downward rally can be continue but for confirmation one should wait for breakout, consequently wait & watch policy is good for this situation.
Resistance: R1 7936 R2 7981 R3 8060
Pivot : PL 7903
Support : S1 7858 S2 7825 S3 7747
Our Recommendation
Buy Nifty above 7950 Stop Loss 7900 Target 8150.
Sell Nifty below 7900 Stop Loss 7950 Target 7800.
2. 13th Oct’14 Equity Bazaar
Bank Nifty
Bank Nifty Technical View:
Friday, Bank Nifty opened with a downward gap & tried to sustain its higher level but not able to sustain it the sellers continued to dominate the market right from its higher level & finally Bank Nifty future has given almost 273 points downward rally from its day high.
Moving Average: In Hourly chart, The Bank Nifty is trading above the 50 EMA (15487) & near 100 EMA (15646) with broad distance which is an indication of ongoing bearish trend.
Fibonacci Analysis: On the upside, 15738 the 38.2% Fibonacci levels are likely to provide immediate resistances to this pair, breaking which it can extend the upward rally towards the 15972 levels. Moreover, sustained trading below 15549 can we may see sharp correction till 15360 levels.
RSI: RSI currently fall below 60 levels & it is expected to decline till to 30 levels.
Conclusion: The charts suggest that Bank Nifty may trade in broad range a key resistance lies at 15869 & key support at 15180 for belligerent trader can picked up intraday swings & for flaccid traders wait & watch policy is good in this situation.
Resistance: R1 15678 R2 15843 R3 16116
Pivot : PL 15570
Support : S1 15405 S2 15297 S3 15024
Our Recommendation
Buy BNF above 15600 Stop Loss 15500 Target: 15800.
Sell BNF below 15000 Stop Loss 15600 Target: 15200.
3. 13th Oct’14 Equity Bazaar
Stock of the Day
HINDPETRO View:
Hind Petro had given strong horizontal resistance breakout and thriven to sustain above its important support 501 level.
Candlestick Pattern: On daily chart we have seen Hind Petro had formed “Long Green Candle” on 8-Oct & after that last 2 trading secession we see that small real bodies of red candles which is sign of trend continuation.
Moving Average: In Daily chart, Hind Petro has traded above its 50 SMA & 100 SMA with hefty gap.
RSI: RSI currently trade near 54.70 levels expecting that upside is still left.
Conclusion: The charts suggest that Hind Petro has traded above its strong support levels in down track consequently tumble can be used as buying opportunities to test sophisticated levels for the day. For short term there is a possibility of upward rally and the next resistance would be watch around Rs.440/580 level.
Resistance: R1 517 R2 526 R3 540
Pivot : PL 512
Support : S1 503 S2 498 S3 484
Our Recommendation
Buy Hind Petro above 515 Stop Loss 495 Target: 580
4. 13th Oct’14 Equity Bazaar
Derivative Analysis FIIS Data: FII’s are the net Seller on 10th October 2014 is Rs 791.77 Cr and Dll’s are the net Buyer on 10th October 2014 is Rs 558.21 Cr. Option Data: 8200 CE has the highest OI with 57 lakhs and 8100 CE has the second highest OI with 56 lakhs and 7800 PE has the highest OI with 66 lakhs and 7700 PE has the second highest OI with 55 lakhs. Open Interest: The above options data shows nifty has now a strong support at 7800 and resistance at 8200 the trend change level as per option data is 8100. Intraday Option Strategy: (A) Buy Nifty 8000 calls and Sell Nifty 8200 puts if buy level is breached. (B) Sell Nifty 7700 calls and Buy Nifty 7900 puts if sell level is breached.
7. 13th Oct’14 Equity Bazaar
Disclaimer
This is solely for information of clients of Choice India and does not construe to be an investment advice. It is also not intended as an offer or solicitation for the purchase and sale of any financial instruments. Any action taken by you on the basis of the information contained herein is your responsibility alone and Choice India its subsidiaries or its employees or associates will not be liable in any manner for the consequences of such action taken by you. We have exercised due diligence in checking the correctness and authenticity of the information contained in this recommendation, but Choice India or any of its subsidiaries or associates or employees shall not be in any way responsible for any loss or damage that may arise to any person from any inadvertent error in the information contained in this recommendation or any action taken on basis of this information. Technical analysis studies market psychology, price patterns and volume levels. It is used to forecast future price and market movements. Technical analysis is complementary to fundamental analysis and news sources. The recommendations issued herewith might be contrary to recommendations issued by Choice India in the company research undertaken as the recommendations stated in this report is derived purely from technical analysis. Choice India has based this document on information obtained from sources it believes to be reliable but which it has not independently verified; Choice India makes no guarantee, representation or warranty and accepts no responsibility or liability as to its accuracy or completeness. The opinions contained within the report are based upon publicly available information at the time of publication and are subject to change without notice. The information and any disclosures provided herein are in summary form and have been prepared for informational purposes. The recommendations and suggested price levels are intended purely for trading purposes. The recommendations are valid for the day of the report however trading trends and volumes might vary substantially on an intraday basis and the recommendations may be subject to change. The information and any disclosures provided herein may be considered confidential. Any use, distribution, modification, copying, forwarding or disclosure by any person is strictly prohibited. The information and any disclosures provided herein do not constitute a solicitation or offer to purchase or sell any security or other financial product or instrument. The current performance may be unaudited. Past performance does not guarantee future returns. There can be no assurance that investments will achieve any targeted rates of return, and there is no guarantee against the loss of your entire investment.
POTENTIAL CONFLICT OF INTEREST DISCLOSURE (as on date of report) Disclosure of interest statement – • Analyst interest of the stock /Instrument(s): - No. • Firm interest of the stock / Instrument (s): - No.