Financial Accounting and Analysis balancesheet.pdf
Aaj ka trend 16.12.16
1. Equities I Commodities I Currencies I Mutual Funds
Aaj Ka Trend
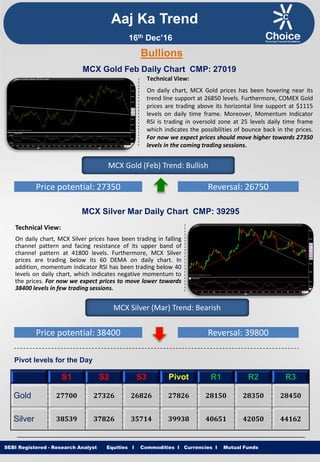
Technical View:
On daily chart, MCX Gold prices has been hovering near its
trend line support at 26850 levels. Furthermore, COMEX Gold
prices are trading above its horizontal line support at $1115
levels on daily time frame. Moreover, Momentum Indicator
RSI is trading in oversold zone at 25 levels daily time frame
which indicates the possibilities of bounce back in the prices.
For now we expect prices should move higher towards 27350
levels in the coming trading sessions.
SEBI Registered - Research Analyst Equities I Commodities I Currencies I Mutual Funds
Bullions
MCX Gold Feb Daily Chart CMP: 27019
MCX Gold (Feb) Trend: Bullish
Price potential: 27350 Reversal: 26750
MCX Silver Mar Daily Chart CMP: 39295
Technical View:
On daily chart, MCX Silver prices have been trading in falling
channel pattern and facing resistance of its upper band of
channel pattern at 41800 levels. Furthermore, MCX Silver
prices are trading below its 60 DEMA on daily chart. In
addition, momentum indicator RSI has been trading below 40
levels on daily chart, which indicates negative momentum to
the prices. For now we expect prices to move lower towards
38400 levels in few trading sessions.
MCX Silver (Mar) Trend: Bearish
Price potential: 38400 Reversal: 39800
Pivot levels for the Day
S1 S2 S3 Pivot R1 R2 R3
Gold 27700 27326 26826 27826 28150 28350 28450
Silver 38539 37826 35714 39938 40651 42050 44162
16th Dec’16
2. Equities I Commodities I Currencies I Mutual Funds
Technical View:
On hourly chart, MCX Copper price has shown breakdown
of its symmetrical triangle pattern at 393 levels. Moreover,
COMEX Copper price has witnessed breakdown of its
ascending triangle pattern $2.62 levels on daily chart. In
addition MCX Copper prices are trading below its 21 DEMA.
Furthermore, momentum indicator RSI is trading below 60
levels on daily time frame. For now we expect prices to
move lower towards 379 levels in coming trading sessions.
SEBI Registered - Research Analyst Equities I Commodities I Currencies I Mutual Funds
MCX Copper Feb Hourly Chart CMP: 391.65
MCX Copper (Feb) Trend: Bearish
Price potential: 384 Reversal: 398
MCX Crude Oil Dec. Daily Chart CMP: 3487
Technical View:
MCX Crude Oil price has been taking support of its horizontal
trend line at 3356 levels on hourly chart. MCX Crude Oil is
trading above its 50 DEMA on daily chart. In addition, NYMEX
WTI Crude Oil price has shown breakout of its symmetrical
triangle pattern at 52 levels on daily chart. Moreover,
Momentum indicator RSI is trading above 60 levels on daily
chart which suggest the positive movement in the prices. For
now we expect prices to move higher 3540 towards levels
in coming trading sessions.
MCX Crude Oil (Dec) Trend: Bullish
Price potential: 3540 Reversal: 3460
Pivot levels for the Day
S1 S2 S3 Pivot R1 R2 R3
Copper 383.9 375.8 362.3 389.3 397.4 402.8 416.3
Crude 3388 3340 3240 3440 3488 3540 3640
Base Metal
Energy
Aaj Ka Trend
16th Dec’16
3. Equities I Commodities I Currencies I Mutual FundsSEBI Registered - Research Analyst Equities I Commodities I Currencies I Mutual Funds
Other Base Metals & Energy
S1 S2 S3 Pivot R1 R2 R3 Trend
Copper 383.9 375.8 362.3 389.3 397.4 402.8 416.3
Aluminum 117.6 116.9 115.6 118.2 118.9 119.5 120.8
Lead 155.1 152.6 147.7 157.5 160.0 162.4 167.3
Nickel 760.2 753.1 737.7 768.5 775.6 783.9 799.3
Zinc 186.0 181.6 174.1 189.1 193.5 196.6 204.1
Natural Gas 228.2 223.0 210.3 235.7 240.9 248.4 261.1
Fundamental News:
Gold prices tumbled to 10-month lows on Thursday after the Federal Reserve hiked interest rates and signaled it
expects to raise rates more quickly than previously anticipated in 2017.
“Our decision to raise rates should certainly be understood as a reflection of the confidence we have in the
progress the economy has made” and that it is expected to make, Fed Chair Janet Yellen said.
The U.S. dollar index, which measures the greenback’s strength against a trade-weighted basket of six major
currencies, was up 0.62% at 102.66, the most since January 2003.
Gold prices have slumped more than 17% from highs hit mid-year, as expectations of higher rates, a stronger
dollar and fading political uncertainty after the U.S. election weighed on the precious metal.
Oil steadied at lower levels Thursday as the Federal Reserve raised its target rate and pointed to three more
hikes next year.
Crude had fallen by as much as 3% Wednesday ahead of the outcome of the Federal Reserve decision.
Oil received some relief from a larger-than-expected fall in U.S. crude inventories.
Official Energy Information Administration inventories figures showed a fall of 2.56 million barrels in U.S. crude
stocks.
Oil prices stabilized on Thursday as a tighter market looms in 2017 due to planned output cuts led by OPEC and
Russia, after sharp declines earlier following Wednesday's U.S. interest rate increase that drove investors out of
commodities.
The greenback rose to close to 14-year highs against a basket of other currencies as the U.S. Federal Reserve
raised rates for the first time in a year.
Aaj Ka Trend
16th Dec’16
4. Equities I Commodities I Currencies I Mutual FundsSEBI Registered - Research Analyst Equities I Commodities I Currencies I Mutual Funds
International Market
Commodity Closing Price
Gold 1131.34
Silver 16.06
Crude Oil 51.22
Brent Crude Oil 54.30
Natural Gas 3.424
COMEX/NYMEX/ICE ( Precious Metals & Energy) Currency & Commodity Index
Currency (Spot) Current Price
USD / INR 67.8350
Dollar Index 103.05
EUR / USD 1.0429
CRB Index* 190.47
Closing as on 15.12.16 *Closing as on 15.12.16
LME (Base Metals) ( $ per tones)
Commodity Closing Price
Copper 5732
Aluminum 1735
Zinc 2818
Lead 2348
Nickel 11300
SHFE (Base Metals) (Yuan per tones)
Commodity Closing Price
Copper 46750
Aluminum 12995
Zinc 22810
Lead 20275
Closing as on 15.12.16 Closing as on 15.12.16
LME INVENTORY DATA
Aaj Ka Trend
08-Dec-16 12-Dec-16 13-Dec-16 14-Dec-16 15-Dec-16
Aluminium -4950 -5750 -22151 -22201 -2751
Copper -3575 -7800 126624 19949 17174
Lead -400 0 0 -51 -101
Nickel -60 -78 -73 1141 1669
Zinc -450 -675 -1249 -902 41
16th Dec’16
5. Equities I Commodities I Currencies I Mutual Funds
This is solely for information of clients of Choice Broking and does not construe to be an investment advice. It is also not intended as an offer or solicitation
for the purchase and sale of any financial instruments. Any action taken by you on the basis of the information contained herein is your responsibility alone
and Choice Broking its subsidiaries or its employees or associates will not be liable in any manner for the consequences of such action taken by you. We
have exercised due diligence in checking the correctness and authenticity of the information contained in this recommendation, but Choice Broking or any of
its subsidiaries or associates or employees shall not be in any way responsible for any loss or damage that may arise to any person from any inadvertent
error in the information contained in this recommendation or any action taken on basis of this information. Technical analysis studies market psychology,
price patterns and volume levels. It is used to forecast future price and market movements. Technical analysis is complementary to fundamental analysis
and news sources. The recommendations issued herewith might be contrary to recommendations issued by Choice Broking in the company research
undertaken as the recommendations stated in this report is derived purely from technical analysis. Choice Broking has based this document on information
obtained from sources it believes to be reliable but which it has not independently verified; Choice Broking makes no guarantee, representation or warranty
and accepts no responsibility or liability as to its accuracy or completeness. The opinions contained within the report are based upon publicly available
information at the time of publication and are subject to change without notice. The information and any disclosures provided herein are in summary form
and have been prepared for informational purposes. The recommendations and suggested price levels are intended purely for trading purposes. The
recommendations are valid for the day of the report however trading trends and volumes might vary substantially on an intraday basis and the
recommendations may be subject to change. The information and any disclosures provided herein may be considered confidential. Any use, distribution,
modification, copying, forwarding or disclosure by any person is strictly prohibited. The information and any disclosures provided herein do not constitute a
solicitation or offer to purchase or sell any security or other financial product or instrument. The current performance may be unaudited. Past performance
does not guarantee future returns. There can be no assurance that investments will achieve any targeted rates of return, and there is no guarantee against
the loss of your entire investment.
POTENTIAL CONFLICT OF INTEREST DISCLOSURE (as on date of report) Disclosure of interest statement – • Analyst interest of the stock
/Instrument(s): - No. • Firm interest of the stock / Instrument (s): - No.
Disclaimer
Contact Us
Amit Pathania
Research Associate
amit.pathania@choiceindia.com
www.choicebroking.incustomercare@choiceindia.com
SEBI Registered - Research Analyst Equities I Commodities I Currencies I Mutual Funds
Aaj Ka Trend
16th Dec’16
Neeraj Yadav
Research Advisor
neeraj.yadav@choiceindia.com
Anish Vyas
Senior Research Associate
anish.vyas@choiceindia.com
Anish Vyas
Digitally signed by Anish Vyas
DN: cn=Anish Vyas, o=Choice Merchandise
Broking Pvt. Ltd, ou=Sr. Research Associate,
email=anish.vyas@choiceindia.com, c=IN
Date: 2016.12.16 09:26:03 +05'30'