1. 20th Oct’14 Equity Bazaar
Nifty
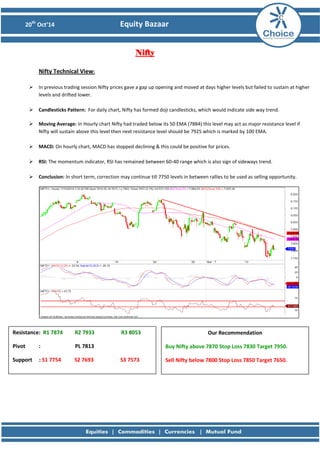
Nifty Technical View:
In previous trading session Nifty prices gave a gap up opening and moved at days higher levels but failed to sustain at higher levels and drifted lower.
Candlesticks Pattern: For daily chart, Nifty has formed doji candlesticks, which would indicate side way trend.
Moving Average: In Hourly chart Nifty had traded below its 50 EMA (7884) this level may act as major resistance level if Nifty will sustain above this level then next resistance level should be 7925 which is marked by 100 EMA.
MACD: On hourly chart, MACD has stopped declining & this could be positive for prices.
RSI: The momentum indicator, RSI has remained between 60-40 range which is also sign of sideways trend.
Conclusion: In short term, correction may continue till 7750 levels in between rallies to be used as selling opportunity.
Resistance: R1 7874 R2 7933 R3 8053
Pivot : PL 7813
Support : S1 7754 S2 7693 S3 7573
Our Recommendation
Buy Nifty above 7870 Stop Loss 7830 Target 7950.
Sell Nifty below 7800 Stop Loss 7850 Target 7650.
2. 20th Oct’14 Equity Bazaar
Bank Nifty
Bank Nifty Technical View:
Last trading session, we have seen Bank Nifty have given almost 370 points bounce within a single trading session and gave downward resistance breakout.
Moving Average: On hourly chart we have seen positive crossover of 50 SMA & 100 SMA which sign as conformation of uptrend.
ADX: ADX indicator is still below 20 levels which are unsophisticated, but today’s price action will inform us weather ADX reads for trending market or trading market.
RSI: The momentum indicator, RSI crossed the 60 levels which show that strong uptrend in Bank Nifty.
Conclusion: If Bank will sustain above it’s down trend line then we can see the pullback rally could continue till 1600 levels & 50 SMA 15647 levels may act as immediate support.
Resistance: R1 15781 R2 16020 R3 16399
Pivot : PL 15641
Support : S1 15402 S2 15262 S3 14883
Our Recommendation
Buy BNF above 15800 Stop Loss 15700 Target: 16100.
Sell BNF below 15600 Stop Loss 15700 Target: 15200.
3. 20th Oct’14 Equity Bazaar
Stock of the Day
ACC View:
After sideway correction ACC has given downward resistance breakout and close above its important support level.
Moving Average: On Hourly chart, ACC prices trades above its 50 & 100 SMA which is positive sign for stock and 50 SMA may act as immediate support.
ADX: On the hourly charts ADX is reading below 25 levels, states that the stock is in trading phase but prices staying above both averages will make ADX to read higher values for the trending phase.
RSI: The momentum indicator RSI is above 60 levels which is indicating strength in momentum & rally could be continue till 70 levels.
Conclusion: In short term, rallies may continue till 1460 levels in with buying on dips.
Resistance: R1 1423 R2 1440 R3 1481
Pivot : PL 1399
Support : S1 1382 S2 1358 S3 1317
Our Recommendation
Buy ACC above 1410 Stop Loss 1395 Target: 1435
4. 20th Oct’14 Equity Bazaar
Derivative Analysis FIIS Data: FII’s are net Rs 1430.03 Cr short on 17th October 2014 and Dll’s are the net Rs 737.31 Cr buyer on 17th October 2014. Option Data: 8000 CE has the highest OI with 68 lakhs and 8100 CE has the second highest OI with 65 lakhs and 7800 PE has the highest OI with 60 lakhs and 7700 PE has the second highest OI with 59 lakhs. Open Interest: The above options data shows that nifty has strong support at 7700 and has resistance at 8100. The change in level will take place once when NIFTY prices breaks 7900 mark. Intraday Option Strategy: (A) Buy Nifty 7700 calls and Sell Nifty 8100 puts if buy level is breached. (B) Sell Nifty 7600 calls and Buy Nifty 7800 puts if sell level is breached.
7. 20th Oct’14 Equity Bazaar
Disclaimer
This is solely for information of clients of Choice India and does not construe to be an investment advice. It is also not intended as an offer or solicitation for the purchase and sale of any financial instruments. Any action taken by you on the basis of the information contained herein is your responsibility alone and Choice India its subsidiaries or its employees or associates will not be liable in any manner for the consequences of such action taken by you. We have exercised due diligence in checking the correctness and authenticity of the information contained in this recommendation, but Choice India or any of its subsidiaries or associates or employees shall not be in any way responsible for any loss or damage that may arise to any person from any inadvertent error in the information contained in this recommendation or any action taken on basis of this information. Technical analysis studies market psychology, price patterns and volume levels. It is used to forecast future price and market movements. Technical analysis is complementary to fundamental analysis and news sources. The recommendations issued herewith might be contrary to recommendations issued by Choice India in the company research undertaken as the recommendations stated in this report is derived purely from technical analysis. Choice India has based this document on information obtained from sources it believes to be reliable but which it has not independently verified; Choice India makes no guarantee, representation or warranty and accepts no responsibility or liability as to its accuracy or completeness. The opinions contained within the report are based upon publicly available information at the time of publication and are subject to change without notice. The information and any disclosures provided herein are in summary form and have been prepared for informational purposes. The recommendations and suggested price levels are intended purely for trading purposes. The recommendations are valid for the day of the report however trading trends and volumes might vary substantially on an intraday basis and the recommendations may be subject to change. The information and any disclosures provided herein may be considered confidential. Any use, distribution, modification, copying, forwarding or disclosure by any person is strictly prohibited. The information and any disclosures provided herein do not constitute a solicitation or offer to purchase or sell any security or other financial product or instrument. The current performance may be unaudited. Past performance does not guarantee future returns. There can be no assurance that investments will achieve any targeted rates of return, and there is no guarantee against the loss of your entire investment.
POTENTIAL CONFLICT OF INTEREST DISCLOSURE (as on date of report) Disclosure of interest statement – • Analyst interest of the stock /Instrument(s): - No. • Firm interest of the stock / Instrument (s): - No.