
Recommended
More Related Content
What's hot
What's hot (20)
Similar to Aaj ka trend 27.05.16
Similar to Aaj ka trend 27.05.16 (18)
Recently uploaded
Recently uploaded (20)
Aaj ka trend 27.05.16
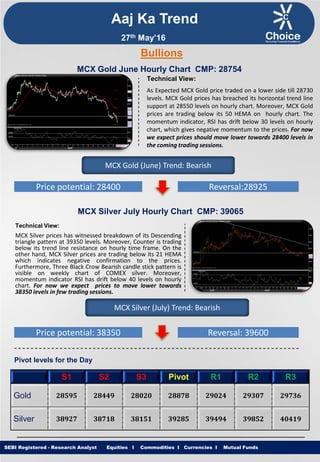
- 1. Equities I Commodities I Currencies I Mutual Funds Aaj Ka Trend Technical View: As Expected MCX Gold price traded on a lower side till 28730 levels. MCX Gold prices has breached its horizontal trend line support at 28550 levels on hourly chart. Moreover, MCX Gold prices are trading below its 50 HEMA on hourly chart. The momentum indicator, RSI has drift below 30 levels on hourly chart, which gives negative momentum to the prices. For now we expect prices should move lower towards 28400 levels in the coming trading sessions. SEBI Registered - Research Analyst Equities I Commodities I Currencies I Mutual Funds Bullions MCX Gold June Hourly Chart CMP: 28754 MCX Gold (June) Trend: Bearish Price potential: 28400 Reversal:28925 MCX Silver July Hourly Chart CMP: 39065 Technical View: MCX Silver prices has witnessed breakdown of its Descending triangle pattern at 39350 levels. Moreover, Counter is trading below its trend line resistance on hourly time frame. On the other hand, MCX Silver prices are trading below its 21 HEMA which indicates negative confirmation to the prices. Furthermore, Three Black Crow Bearish candle stick pattern is visible on weekly chart of COMEX silver. Moreover, momentum indicator RSI has drift below 40 levels on hourly chart. For now we expect prices to move lower towards 38350 levels in few trading sessions. MCX Silver (July) Trend: Bearish Price potential: 38350 Reversal: 39600 Pivot levels for the Day S1 S2 S3 Pivot R1 R2 R3 Gold 28595 28449 28020 28878 29024 29307 29736 Silver 38927 38718 38151 39285 39494 39852 40419 27th May’16
- 2. Equities I Commodities I Currencies I Mutual Funds Technical View: MCX Copper Prices have given breakout above its trend line resistance at 315.35 levels. However, MCX Copper prices has retest its trend line support on hourly chart which indicates bulls to resume its uptrend. On the other hand, momentum indicator RSI is trading above 50 levels on hourly chart. Furthermore, momentum indictor MACD has shown positive crossover on hourly chart. For now we expect prices to move higher towards 322 levels in coming trading sessions. SEBI Registered - Research Analyst Equities I Commodities I Currencies I Mutual Funds MCX Copper June hourly Chart CMP: 313.10 MCX Copper (June) Trend: Bullish Price potential: 322 Reversal: 308.30 MCX Crude Oil June. Hourly Chart CMP: 3328 Technical View: On Hourly chart MCX Crude Oil prices are trading in rising channel formation. Moreover prices has formed higher top higher bottom formation on hourly basis. On the other hand counter is trading above its 50 HEMA on MCX Crude Oil hourly chart. Furthermore momentum indicator RSI is trading above 70 levels in daily chart which indicates strength ahead. For now we expect prices to move higher towards 3415 levels in coming trading sessions. MCX Crude Oil (June) Trend: Bullish Price potential: 3415 Reversal: 3275 Pivot levels for the Day S1 S2 S3 Pivot R1 R2 R3 Copper 311.5 309.8 305.3 314.3 316.0 318.8 323.3 Crude 3302 3270 3200 3340 3372 3410 3480 Base Metal Energy Aaj Ka Trend 27th May’16
- 3. Equities I Commodities I Currencies I Mutual FundsSEBI Registered - Research Analyst Equities I Commodities I Currencies I Mutual Funds Other Base Metals & Energy S1 S2 S3 Pivot R1 R2 R3 Trend Copper 311.5 309.8 305.3 314.3 316.0 318.8 323.3 Aluminum 103.5 103.1 102.1 104.2 104.6 105.2 106.3 Lead 110.7 109.6 107.8 111.5 112.6 113.3 115.2 Nickel 554.4 550.2 538.7 561.7 565.9 573.2 584.7 Zinc 124.3 123.1 120.8 125.4 126.6 127.7 130.0 Natural Gas 142.5 140.8 136.5 145.1 146.8 149.4 153.7 Fundamental News: Gold prices eased in Asia on Thursday with the market looking ahead to comments from Fed Chair Janet Yellen and U.S. GDP data at the end of the week. Gold futures were higher in European trade on Thursday, after falling to a seven-week low overnight as investors continued to factor in an increased chance of a near-term U.S. interest rate rise. Gold futures were higher in North American trade on Thursday, on track to halt a six-day losing streak as the U.S. dollar pulled back from recent highs. Oil prices added to overnight gains in European trade on Thursday, with Brent futures climbing above the $50- level for the first time in seven months. Brent crude on Thursday sought to hold above $50 a barrel after breaking through the psychological barrier as U.S. crude stockpiles fell more than expected. Oil prices climbed above $50 a barrel on Thursday for the first time in nearly seven months as a global supply glut that plagued the market for nearly two years showed signs of easing. Oil prices added to overnight gains in North American trade on Thursday, with both West Texas Intermediate and Brent climbing above the $50-level for the first time in almost eight months as falling stockpiles in the U.S. and global supply disruptions boosted sentiment. U.S. natural gas futures extended losses in North America trade on Thursday, after data showed that natural gas supplies in storage in the U.S. rose more than expected last week. The U.S. Energy Information Administration said in its weekly report that natural gas storage in the U.S. in the week ended May 20 rose by 71 billion cubic feet, compared to expectations for a gain of 68 billion. Aaj Ka Trend 27th May’16
- 4. Equities I Commodities I Currencies I Mutual FundsSEBI Registered - Research Analyst Equities I Commodities I Currencies I Mutual Funds International Market Commodity Closing Price Gold 1221.70 Silver 16.32 Crude Oil 49.44 Brent Crude Oil 49.49 Natural Gas 2.14 COMEX/NYMEX/ICE ( Precious Metals & Energy) Currency & Commodity Index Currency (Spot) Current Price USD / INR 67.17 Dollar Index 95.14 EUR / USD 1.1191 CRB Index* 185.58 Closing as on 26.05.16 *Closing as on 26.05.16 LME (Base Metals) ( $ per tones) Commodity Closing Price Copper 4661 Aluminum 1555 Zinc 1876 Lead 1675 Nickel 8336 SHFE (Base Metals) (Yuan per tones) Commodity Closing Price Copper 35830 Aluminum 12150 Zinc 14680 Lead 12850 Closing as on 26.05.16 Closing as on 26.05.16 LME INVENTORY DATA Aaj Ka Trend 20-May-16 23-May-16 24-May-16 25-May-16 26-May-16 Aluminium -5575 -5300 -5550 -5375 -4425 Copper -2875 -725 2250 -2000 725 Lead -150 -125 5575 5575 -275 Nickel 1104 -1668 -384 -630 -978 Zinc -600 -975 -100 -600 -50 27th May’16
- 5. Equities I Commodities I Currencies I Mutual Funds This is solely for information of clients of Choice Broking and does not construe to be an investment advice. It is also not intended as an offer or solicitation for the purchase and sale of any financial instruments. Any action taken by you on the basis of the information contained herein is your responsibility alone and Choice Broking its subsidiaries or its employees or associates will not be liable in any manner for the consequences of such action taken by you. We have exercised due diligence in checking the correctness and authenticity of the information contained in this recommendation, but Choice Broking or any of its subsidiaries or associates or employees shall not be in any way responsible for any loss or damage that may arise to any person from any inadvertent error in the information contained in this recommendation or any action taken on basis of this information. Technical analysis studies market psychology, price patterns and volume levels. It is used to forecast future price and market movements. Technical analysis is complementary to fundamental analysis and news sources. The recommendations issued herewith might be contrary to recommendations issued by Choice Broking in the company research undertaken as the recommendations stated in this report is derived purely from technical analysis. Choice Broking has based this document on information obtained from sources it believes to be reliable but which it has not independently verified; Choice Broking makes no guarantee, representation or warranty and accepts no responsibility or liability as to its accuracy or completeness. The opinions contained within the report are based upon publicly available information at the time of publication and are subject to change without notice. The information and any disclosures provided herein are in summary form and have been prepared for informational purposes. The recommendations and suggested price levels are intended purely for trading purposes. The recommendations are valid for the day of the report however trading trends and volumes might vary substantially on an intraday basis and the recommendations may be subject to change. The information and any disclosures provided herein may be considered confidential. Any use, distribution, modification, copying, forwarding or disclosure by any person is strictly prohibited. The information and any disclosures provided herein do not constitute a solicitation or offer to purchase or sell any security or other financial product or instrument. The current performance may be unaudited. Past performance does not guarantee future returns. There can be no assurance that investments will achieve any targeted rates of return, and there is no guarantee against the loss of your entire investment. POTENTIAL CONFLICT OF INTEREST DISCLOSURE (as on date of report) Disclosure of interest statement – • Analyst interest of the stock /Instrument(s): - No. • Firm interest of the stock / Instrument (s): - No. Disclaimer Contact Us Amit Pathania Research Associate amit.pathania@choiceindia.com Rohan Patil Research Associate rohan.patil@choiceindia.com www.choiceindia.comcustomercare@choiceindia.com SEBI Registered - Research Analyst Equities I Commodities I Currencies I Mutual Funds Aaj Ka Trend 27th May’16 Neeraj Yadav Research Advisor neeraj.yadav@choiceindia.com Anish Vyas Senior Research Associate anish.vyas@choiceindia.com Amit Pathania Digitally signed by Amit Pathania DN: cn=Amit Pathania, o=Choice Equity Broking Pvt. ltd, ou=Research Department, email=amit.pathania@choiceindia.com, c=IN Date: 2016.05.27 08:47:34 +05'30'