1. 21st Nov’14 Aaj Ka Trend
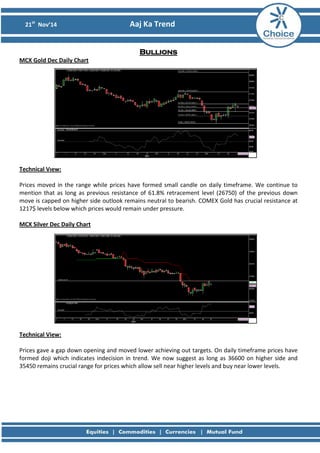
Bullions MCX Gold Dec Daily Chart
Technical View: Prices moved in the range while prices have formed small candle on daily timeframe. We continue to mention that as long as previous resistance of 61.8% retracement level (26750) of the previous down move is capped on higher side outlook remains neutral to bearish. COMEX Gold has crucial resistance at 1217$ levels below which prices would remain under pressure. MCX Silver Dec Daily Chart
Technical View: Prices gave a gap down opening and moved lower achieving out targets. On daily timeframe prices have formed doji which indicates indecision in trend. We now suggest as long as 36600 on higher side and 35450 remains crucial range for prices which allow sell near higher levels and buy near lower levels.
2. 21st Nov’14 Aaj Ka Trend
Fundamental News:
• Gold futures maintain losses after U.S. CPI, jobless claims data.
• Gold prices remained lower on Thursday, after data showed that the number of Americans filing new claims for unemployment benefits fell less than expected last week and that consumer prices were unchanged in October.
• On the Comex division of the New York Mercantile Exchange, gold futures for December delivery lost $1.60, or 0.13%, to trade at $1,192.30 a troy ounce during U.S. morning hours.
Pivot Levels for the Day:
S1
S2
S3
Pivot
R1
R2
R3
Gold
26347
26231
25980
26482
26598
26733
26984
Silver
35584
35349
34831
35867
36102
36385
36903
Recommendation:
Gold
Neutral to negative
Silver
Neutral
3. 21st Nov’14 Aaj Ka Trend
Base Metals MCX Copper Nov Hourly Chart
Technical Views: Prices gave a gap down opening and drifted lower however prices have taken support near the lower band of the consolidation and moved higher in the second half of the trading session. We now expect prices could head towards higher side in order to test higher band of the consolidation. 410 remains support for the test of 418 while break below 410 can drift prices towards 408/406 levels.
MCX Aluminum Nov Hourly Chart
MCX Lead Nov Hourly Chart
MCX Nickel Nov Daily Chart
MCX Zinc Nov Hourly Chart
4. 21st Nov’14 Aaj Ka Trend
Fundamental News:
• Copper futures lower after China factory activity stalls.
• Copper futures edged lower on Thursday, in the wake of disappointing economic signals from China, where data showed manufacturing activity hit a six-month low in November.
• On the Comex division of the New York Mercantile Exchange, copper for December delivery declined 1.5 cents, or 0.48% to trade at $3.031 a pound during European morning hours.
Pivot Levels for the Day:
S1
S2
S3
Pivot
R1
R2
R3
Copper
409.9
407.3
401.3
413.2
415.9
419.2
425.1
Aluminum
125.5
124.5
122.9
126.1
127.1
127.7
129.3
Lead
125.3
124.6
123.4
125.8
126.5
127.0
128.2
Nickel
996.1
985.7
964.9
1006.5
1016.9
1027.3
1048.1
Zinc
138.5
138.1
137.0
139.2
139.6
140.3
141.4
Recommendation:
Copper
Buy
Aluminum
Buy
Lead
Buy above 126.40
Nickel
Buy on dips
Zinc
Buy above 139.50
5. 21st Nov’14 Aaj Ka Trend
Energy MCX Crude Dec Hourly Chart:
Technical Views: Prices gave a gap up opening and inched lower but in the second half of the trading session prices moved higher. We expect 4715 remains crucial resistance level above which prices can test 4760/4800 levels while lower side remains protected at 4622 levels. MCX Natural Gas Nov Hourly Chart:
Technical Views: As expected prices have failed to breach the resistance of 278 and drifted lower and have broken the uptrend line while the momentum indicator, RSI has gone below 40 levels which suggest weakness in prices. We expect as long as 270 levels are capped on higher side prices can test 260 levels.
6. 21st Nov’14 Aaj Ka Trend
Fundamental News: .
• WTI oil futures hit session highs after Philly Fed data.
• West Texas Intermediate oil prices rose to the highest levels of the session on Thursday, after data showed that manufacturing activity in the Philadelphia-region expanded at the fastest rate since December 1993 in November.
• On the New York Mercantile Exchange, crude oil for delivery in January tacked on 67 cents, or 0.9%, to trade at $75.17 a barrel.
• Natural gas futures Slips after storage data.
• Natural gas futures rose to the highest levels of the session on Thursday, after data showed that U.S. natural gas supplies fell more than forecast last week but failed to sustain the gains
Pivot Levels for the Day:
S1
S2
S3
Pivot
R1
R2
R3
Crude
4637
4595
4519
4671
4713
4747
4823
Natural Gas
192.1
220.7
205.9
235.5
206.9
250.3
265.1
Recommendation:
Crude
Buy
Natural Gas
Sell
8. 21st Nov’14 Aaj Ka Trend
This is solely for information of clients of Choice Broking and does not construe to be an investment advice. It is also not intended as an offer or solicitation for the purchase and sale of any financial instruments. Any action taken by you on the basis of the information contained herein is your responsibility alone and Choice Broking its subsidiaries or its employees or associates will not be liable in any manner for the consequences of such action taken by you. We have exercised due diligence in checking the correctness and authenticity of the information contained in this recommendation, but Choice Broking or any of its subsidiaries or associates or employees shall not be in any way responsible for any loss or damage that may arise to any person from any inadvertent error in the information contained in this recommendation or any action taken on basis of this information. Technical analysis studies market psychology, price patterns and volume levels. It is used to forecast future price and market movements. Technical analysis is complementary to fundamental analysis and news sources. The recommendations issued herewith might be contrary to recommendations issued by Choice Broking in the company research undertaken as the recommendations stated in this report is derived purely from technical analysis. Choice Broking has based this document on information obtained from sources it believes to be reliable but which it has not independently verified; Choice Broking makes no guarantee, representation or warranty and accepts no responsibility or liability as to its accuracy or completeness. The opinions contained within the report are based upon publicly available information at the time of publication and are subject to change without notice. The information and any disclosures provided herein are in summary form and have been prepared for informational purposes. The recommendations and suggested price levels are intended purely for trading purposes. The recommendations are valid for the day of the report however trading trends and volumes might vary substantially on an intraday basis and the recommendations may be subject to change. The information and any disclosures provided herein may be considered confidential. Any use, distribution, modification, copying, forwarding or disclosure by any person is strictly prohibited. The information and any disclosures provided herein do not constitute a solicitation or offer to purchase or sell any security or other financial product or instrument. The current performance may be unaudited. Past performance does not guarantee future returns. There can be no assurance that investments will achieve any targeted rates of return, and there is no guarantee against the loss of your entire investment. POTENTIAL CONFLICT OF INTEREST DISCLOSURE (as on date of report) Disclosure of interest statement – • Analyst interest of the stock /Instrument(s): - No. • Firm interest of the stock / Instrument (s): - No.
Disclaimer