
Recommended
More Related Content
What's hot
What's hot (20)
Viewers also liked
Viewers also liked (12)
Similar to Aaj ka trend 16.09.16
Similar to Aaj ka trend 16.09.16 (20)
Recently uploaded
Recently uploaded (20)
Aaj ka trend 16.09.16
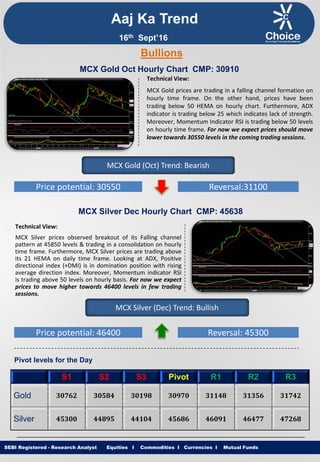
- 1. Equities I Commodities I Currencies I Mutual Funds Aaj Ka Trend Technical View: MCX Gold prices are trading in a falling channel formation on hourly time frame. On the other hand, prices have been trading below 50 HEMA on hourly chart. Furthermore, ADX indicator is trading below 25 which indicates lack of strength. Moreover, Momentum Indicator RSI is trading below 50 levels on hourly time frame. For now we expect prices should move lower towards 30550 levels in the coming trading sessions. SEBI Registered - Research Analyst Equities I Commodities I Currencies I Mutual Funds Bullions MCX Gold Oct Hourly Chart CMP: 30910 MCX Gold (Oct) Trend: Bearish Price potential: 30550 Reversal:31100 MCX Silver Dec Hourly Chart CMP: 45638 Technical View: MCX Silver prices observed breakout of its Falling channel pattern at 45850 levels & trading in a consolidation on hourly time frame. Furthermore, MCX Silver prices are trading above its 21 HEMA on daily time frame. Looking at ADX, Positive directional index (+DMI) is in domination position with rising average direction index. Moreover, Momentum indicator RSI is trading above 50 levels on hourly basis. For now we expect prices to move higher towards 46400 levels in few trading sessions. MCX Silver (Dec) Trend: Bullish Price potential: 46400 Reversal: 45300 Pivot levels for the Day S1 S2 S3 Pivot R1 R2 R3 Gold 30762 30584 30198 30970 31148 31356 31742 Silver 45300 44895 44104 45686 46091 46477 47268 16th Sept’16
- 2. Equities I Commodities I Currencies I Mutual Funds Technical View: On Daily chart, MCX Copper has completed a “Bullish Cypher Harmonic Pattern” at 305.60 levels, the co- ordinates of which are as follows. Technical Parameter: XA of the leg from 298.05 to 337.10 ,AB of the leg completed at 317.25 (i.e.50% of XA leg.),BC of the leg completed at 339.90 (i.e. 113% Fibonacci Projection of AB leg.) and CD of the leg completed at 305.60 levels (i.e. 78.60% of XA and 141.40% Fibonacci Projection of BC leg). For now we expect prices to move higher towards 330 levels in coming trading sessions. SEBI Registered - Research Analyst Equities I Commodities I Currencies I Mutual Funds MCX Copper Nov hourly Chart CMP: 323.30 MCX Copper (Nov) Trend: Bullish Price potential: 330 Reversal: 317.50 MCX Crude Oil Sept. Hourly Chart CMP: 2948 Technical View: MCX Crude Oil prices have completed Bullish AB = CD pattern at 2926 levels on hourly time frame. In addition MCX Crude oil is trading near its horizontal trend line support at 2900 levels. Furthermore, Counter is trading above its 200 DEMA on daily chart. Moreover, Momentum indicator RSI is trading near its trend line support at 40 levels on hourly basis. For now we expect prices to move higher towards 3015 levels in coming trading sessions. MCX Crude Oil (Sept) Trend: Bullish Price potential: 3015 Reversal: 2900 Pivot levels for the Day S1 S2 S3 Pivot R1 R2 R3 Copper 321.7 320.2 317.3 323.1 324.6 326.0 328.9 Crude 2911 2874 2811 2937 2974 3000 3063 Base Metal Energy Aaj Ka Trend 16th Sept’16
- 3. Equities I Commodities I Currencies I Mutual FundsSEBI Registered - Research Analyst Equities I Commodities I Currencies I Mutual Funds Other Base Metals & Energy S1 S2 S3 Pivot R1 R2 R3 Trend Copper 321.7 320.2 317.3 323.1 324.6 326.0 328.9 Aluminum 103.5 102.7 100.6 104.9 105.6 107.0 109.2 Lead 128.4 127.7 125.7 129.6 130.4 131.6 133.5 Nickel 645.3 639.7 623.8 655.6 661.2 671.5 687.4 Zinc 148.3 147.2 144.0 150.4 151.5 153.6 156.8 Natural Gas 191.2 187.6 181.5 193.7 197.3 199.8 205.9 Fundamental News: Gold held mostly steady in Asia on Thursday with central bank meetings in the U.S. and Japan next week setting a high-stakes stage for markets. Gold prices struggled near the lowest level in nearly two weeks during Europe's session on Thursday, as investors focused on the next set of U.S. data to see whether it supports expectations that the Federal Reserve will raise interest rates before the end of the year. Gold prices sank to fresh two-week lows during North America's session on Thursday, as investors digested the release of a host of U.S. economic data. Oil prices rose on Thursday after falling around 3 percent in the previous session, supported by an unexpected fall in U.S. crude inventories. Recent developments in the OPEC universe have fueled speculation that oil producers might actually be able to agree on something at the informal talks in Algiers, Algeria, set for September 26-28. Oil prices fell to a new two-week low during European hours on Thursday, adding to steep overnight losses amid mounting concerns over a global supply glut. Oil prices wobbled near a two-week low during North American hours on Thursday, as a planned resumption of oil exports by Libya and Nigeria added to concerns over a global supply glut. U.S. natural gas futures trimmed losses on Thursday morning, after data showed that natural gas supplies in storage in the U.S. rose less than forecast last week. Aaj Ka Trend 16th Sept’16
- 4. Equities I Commodities I Currencies I Mutual FundsSEBI Registered - Research Analyst Equities I Commodities I Currencies I Mutual Funds International Market Commodity Closing Price Gold 1314.24 Silver 18.92 Crude Oil 43.66 Brent Crude Oil 46.33 Natural Gas 2.908 COMEX/NYMEX/ICE ( Precious Metals & Energy) Currency & Commodity Index Currency (Spot) Current Price USD / INR 67.02 Dollar Index 95.26 EUR / USD 1.1241 CRB Index* 180.67 Closing as on 15.09.16 *Closing as on 15.09.16 LME (Base Metals) ( $ per tones) Commodity Closing Price Copper 4781 Aluminum 1572 Zinc 2231 Lead 1947 Nickel 9715 SHFE (Base Metals) (Yuan per tones) Commodity Closing Price Copper 36950 Aluminum 12100 Zinc 16950 Lead 13350 Closing as on 15.09.16 Closing as on 15.09.16 LME INVENTORY DATA Aaj Ka Trend 08-Sept-16 09-Sept-16 13-Sept-16 14-Sept-16 15-Sept-16 Aluminium -6700 -7052 -6300 -9250 -625 Copper -1375 12378 3602 -1875 -2275 Lead 200 1148 0 0 0 Nickel 105 80 -182 84 -6 Zinc -175 -1001 -801 -1125 -1100 16th Sept’16
- 5. Equities I Commodities I Currencies I Mutual Funds This is solely for information of clients of Choice Broking and does not construe to be an investment advice. It is also not intended as an offer or solicitation for the purchase and sale of any financial instruments. Any action taken by you on the basis of the information contained herein is your responsibility alone and Choice Broking its subsidiaries or its employees or associates will not be liable in any manner for the consequences of such action taken by you. We have exercised due diligence in checking the correctness and authenticity of the information contained in this recommendation, but Choice Broking or any of its subsidiaries or associates or employees shall not be in any way responsible for any loss or damage that may arise to any person from any inadvertent error in the information contained in this recommendation or any action taken on basis of this information. Technical analysis studies market psychology, price patterns and volume levels. It is used to forecast future price and market movements. Technical analysis is complementary to fundamental analysis and news sources. The recommendations issued herewith might be contrary to recommendations issued by Choice Broking in the company research undertaken as the recommendations stated in this report is derived purely from technical analysis. Choice Broking has based this document on information obtained from sources it believes to be reliable but which it has not independently verified; Choice Broking makes no guarantee, representation or warranty and accepts no responsibility or liability as to its accuracy or completeness. The opinions contained within the report are based upon publicly available information at the time of publication and are subject to change without notice. The information and any disclosures provided herein are in summary form and have been prepared for informational purposes. The recommendations and suggested price levels are intended purely for trading purposes. The recommendations are valid for the day of the report however trading trends and volumes might vary substantially on an intraday basis and the recommendations may be subject to change. The information and any disclosures provided herein may be considered confidential. Any use, distribution, modification, copying, forwarding or disclosure by any person is strictly prohibited. The information and any disclosures provided herein do not constitute a solicitation or offer to purchase or sell any security or other financial product or instrument. The current performance may be unaudited. Past performance does not guarantee future returns. There can be no assurance that investments will achieve any targeted rates of return, and there is no guarantee against the loss of your entire investment. POTENTIAL CONFLICT OF INTEREST DISCLOSURE (as on date of report) Disclosure of interest statement – • Analyst interest of the stock /Instrument(s): - No. • Firm interest of the stock / Instrument (s): - No. Disclaimer Contact Us Amit Pathania Research Associate amit.pathania@choiceindia.com Rohan Patil Research Associate rohan.patil@choiceindia.com www.choicebroking.incustomercare@choiceindia.com SEBI Registered - Research Analyst Equities I Commodities I Currencies I Mutual Funds Aaj Ka Trend 16th Sept’16 Neeraj Yadav Research Advisor neeraj.yadav@choiceindia.com Anish Vyas Senior Research Associate anish.vyas@choiceindia.com Anish Vyas Digitally signed by Anish Vyas DN: cn=Anish Vyas, o=Choice Merchandise Broking Pvt. Ltd, ou=Sr. Research Associate, email=anish.vyas@choiceindia.com, c=IN Date: 2016.09.16 09:21:18 +05'30'