
Recommended
More Related Content
What's hot
What's hot (20)
Similar to Aaj ka trend 22.08.16
Similar to Aaj ka trend 22.08.16 (17)
Recently uploaded
Recently uploaded (20)
Aaj ka trend 22.08.16
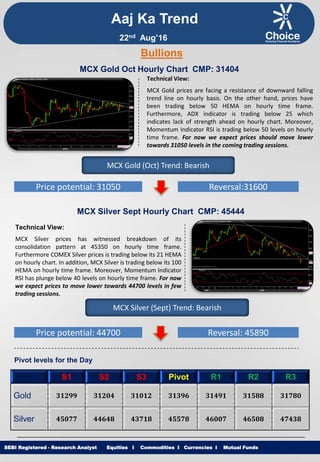
- 1. Equities I Commodities I Currencies I Mutual Funds Aaj Ka Trend Technical View: MCX Gold prices are facing a resistance of downward falling trend line on hourly basis. On the other hand, prices have been trading below 50 HEMA on hourly time frame. Furthermore, ADX indicator is trading below 25 which indicates lack of strength ahead on hourly chart. Moreover, Momentum Indicator RSI is trading below 50 levels on hourly time frame. For now we expect prices should move lower towards 31050 levels in the coming trading sessions. SEBI Registered - Research Analyst Equities I Commodities I Currencies I Mutual Funds Bullions MCX Gold Oct Hourly Chart CMP: 31404 MCX Gold (Oct) Trend: Bearish Price potential: 31050 Reversal:31600 MCX Silver Sept Hourly Chart CMP: 45444 Technical View: MCX Silver prices has witnessed breakdown of its consolidation pattern at 45350 on hourly time frame. Furthermore COMEX Silver prices is trading below its 21 HEMA on hourly chart. In addition, MCX Silver is trading below its 100 HEMA on hourly time frame. Moreover, Momentum Indicator RSI has plunge below 40 levels on hourly time frame. For now we expect prices to move lower towards 44700 levels in few trading sessions. MCX Silver (Sept) Trend: Bearish Price potential: 44700 Reversal: 45890 Pivot levels for the Day S1 S2 S3 Pivot R1 R2 R3 Gold 31299 31204 31012 31396 31491 31588 31780 Silver 45077 44648 43718 45578 46007 46508 47438 22nd Aug’16
- 2. Equities I Commodities I Currencies I Mutual Funds Technical View: MCX Copper prices have witnessed breakout of its Falling Channel formation at 322 levels on hourly chart. Furthermore, counter is trading above its super trend indicator on hourly time frame. Moreover, MCX Copper is trading above its 50 HEMA on hourly chart. On the other hand, momentum indicator RSI is trading near 60 levels on hourly chart. For now we expect prices to move higher towards 330 levels in coming trading sessions. SEBI Registered - Research Analyst Equities I Commodities I Currencies I Mutual Funds MCX Copper Aug hourly Chart CMP: 322.15 MCX Copper (Aug) Trend: Bullish Price potential: 330 Reversal: 317 MCX Crude Oil Sept. Hourly Chart CMP: 3292 Technical View: MCX Crude Oil prices have completed bearish Anti – Cypher pattern at 3287 on hourly time frame. On the other hand prices have been witnessed breakdown of its Rising Wedge pattern on hourly chart. Furthermore, NYMEX WTI Crude Oil has observed breakdown of its falling channel pattern on hourly basis. Moreover, Momentum indicator RSI has faced resistance at 60 levels on hourly chart. For now we expect prices to move lower towards 3215 levels in coming trading sessions. MCX Crude Oil (Sept) Trend: Bearish Price potential: 3215 Reversal: 3340 Pivot levels for the Day S1 S2 S3 Pivot R1 R2 R3 Copper 320.3 318.7 316.1 321.4 323.0 324.0 326.7 Crude 3264 3239 3188 3290 3315 3341 3392 Base Metal Energy Aaj Ka Trend 22nd Aug’16
- 3. Equities I Commodities I Currencies I Mutual FundsSEBI Registered - Research Analyst Equities I Commodities I Currencies I Mutual Funds Other Base Metals & Energy S1 S2 S3 Pivot R1 R2 R3 Trend Copper 320.3 318.7 316.1 321.4 323.0 324.0 326.7 Aluminum 110.7 109.9 108.3 111.5 112.3 113.1 114.7 Lead 125.3 124.6 123.3 126.0 126.7 127.3 128.7 Nickel 688.5 681.6 670.1 693.1 700.0 704.6 716.1 Zinc 152.6 151.7 150.2 153.2 154.1 154.7 156.2 Natural Gas 171.8 169.6 163.5 175.7 177.9 181.8 187.9 Fundamental News: Gold inched up as the dollar fell to a seven-week low against its main rivals, while investors digested minutes from the Federal Reserve and the European Central Bank for further indications on the scope and duration of a host of low interest rate policies from major central banks throughout the world. Gold prices dipped in Asia on Friday with a cautious eye on the Federal Reserve as debate grows on the need for a rate hike by the end of the year. Gold prices slipped lower on Friday, but still remained close to a two-week high as the minutes of the Federal Reserve’s latest policy meeting continued to weigh on the greenback. Crude oil gained in early Asia on Friday as an output freeze by key producers was said to be gaining traction, though vast global oversupply continues to hang over the market. Crude oil held gains in Asia on Friday with Brent comfortably above $50 a barrel as an output freeze by key producers was said to be gaining traction, though vast global oversupply continues to hang over the market. Oil was lower Friday on profit-taking on the back of a strong rally on output freeze hopes. U.S. oil futures slipped lower but remained close to seven-week highs on Friday, as a decline U.S. stockpiles and hopes for an agreement between exporting countries on a potential production freeze continued to support. Oil prices fell as much as 1 percent on Friday, retreating from eight-week highs, as market participants took profits from one of this year's strongest rallies in crude, which analysts called fundamentally unjustified. Aaj Ka Trend 22nd Aug’16
- 4. Equities I Commodities I Currencies I Mutual FundsSEBI Registered - Research Analyst Equities I Commodities I Currencies I Mutual Funds International Market Commodity Closing Price Gold 1345.30 Silver 19.28 Crude Oil 48.50 Brent Crude Oil 50.80 Natural Gas 2.575 COMEX/NYMEX/ICE ( Precious Metals & Energy) Currency & Commodity Index Currency (Spot) Current Price USD / INR 67.13 Dollar Index 94.48 EUR / USD 1.13 CRB Index* 188.77 Closing as on 19.08.16 *Closing as on 19.08.16 LME (Base Metals) ( $ per tones) Commodity Closing Price Copper 4798 Aluminum 1667 Zinc 2286 Lead 1883 Nickel 10355 SHFE (Base Metals) (Yuan per tones) Commodity Closing Price Copper 37290 Aluminum 12585 Zinc 17480 Lead 13800 Closing as on 19.08.16 Closing as on 19.08.16 LME INVENTORY DATA Aaj Ka Trend 12-Aug-16 16-Aug-16 17-Aug-16 18-Aug-16 19-Aug-16 Aluminium -8000 -2250 18300 18300 -7100 Copper -1550 -1175 7925 7925 -2800 Lead -150 -50 -175 -125 -100 Nickel -270 4944 -414 -414 -60 Zinc -175 -275 -375 -375 -1175 22nd Aug’16
- 5. Equities I Commodities I Currencies I Mutual Funds This is solely for information of clients of Choice Broking and does not construe to be an investment advice. It is also not intended as an offer or solicitation for the purchase and sale of any financial instruments. Any action taken by you on the basis of the information contained herein is your responsibility alone and Choice Broking its subsidiaries or its employees or associates will not be liable in any manner for the consequences of such action taken by you. We have exercised due diligence in checking the correctness and authenticity of the information contained in this recommendation, but Choice Broking or any of its subsidiaries or associates or employees shall not be in any way responsible for any loss or damage that may arise to any person from any inadvertent error in the information contained in this recommendation or any action taken on basis of this information. Technical analysis studies market psychology, price patterns and volume levels. It is used to forecast future price and market movements. Technical analysis is complementary to fundamental analysis and news sources. The recommendations issued herewith might be contrary to recommendations issued by Choice Broking in the company research undertaken as the recommendations stated in this report is derived purely from technical analysis. Choice Broking has based this document on information obtained from sources it believes to be reliable but which it has not independently verified; Choice Broking makes no guarantee, representation or warranty and accepts no responsibility or liability as to its accuracy or completeness. The opinions contained within the report are based upon publicly available information at the time of publication and are subject to change without notice. The information and any disclosures provided herein are in summary form and have been prepared for informational purposes. The recommendations and suggested price levels are intended purely for trading purposes. The recommendations are valid for the day of the report however trading trends and volumes might vary substantially on an intraday basis and the recommendations may be subject to change. The information and any disclosures provided herein may be considered confidential. Any use, distribution, modification, copying, forwarding or disclosure by any person is strictly prohibited. The information and any disclosures provided herein do not constitute a solicitation or offer to purchase or sell any security or other financial product or instrument. The current performance may be unaudited. Past performance does not guarantee future returns. There can be no assurance that investments will achieve any targeted rates of return, and there is no guarantee against the loss of your entire investment. POTENTIAL CONFLICT OF INTEREST DISCLOSURE (as on date of report) Disclosure of interest statement – • Analyst interest of the stock /Instrument(s): - No. • Firm interest of the stock / Instrument (s): - No. Disclaimer Contact Us Amit Pathania Research Associate amit.pathania@choiceindia.com Rohan Patil Research Associate rohan.patil@choiceindia.com www.choiceindia.comcustomercare@choiceindia.com SEBI Registered - Research Analyst Equities I Commodities I Currencies I Mutual Funds Aaj Ka Trend 22nd Aug’16 Neeraj Yadav Research Advisor neeraj.yadav@choiceindia.com Anish Vyas Senior Research Associate anish.vyas@choiceindia.com Amit Pathania Digitally signed by Amit Pathania DN: cn=Amit Pathania, o=Choice Equity Broking Pvt. ltd, ou=Research Department, email=amit.pathania@choiceindia.com, c=IN Date: 2016.08.20 14:16:08 +05'30'