Download to read offline
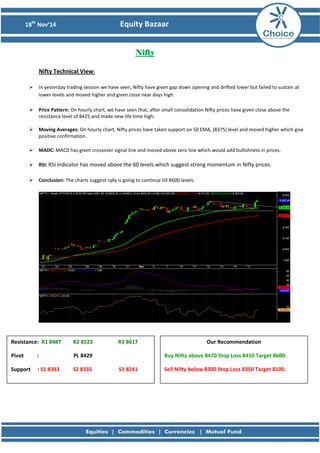
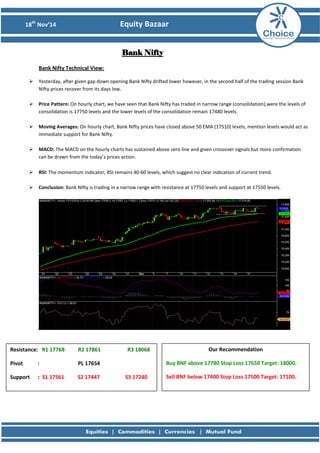
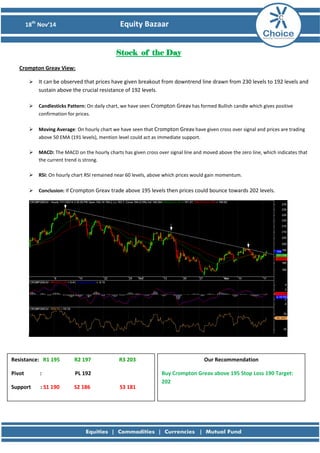
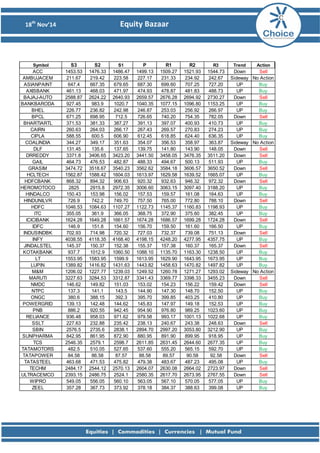

The document provides a technical analysis of the Nifty, Bank Nifty, and Crompton Greav stock. For Nifty, it notes that prices closed near the day's high after an initial drop and broke resistance. It recommends buying above 8470 with a target of 8600. For Bank Nifty, it observes consolidation between 17750 and 17480 and recommends buying above 17780 with a target of 18000. For Crompton Greav, it recommends buying above 195 based on a breakout from a downtrend and bullish candlestick pattern, with a target of 202.


