
Recommended
More Related Content
What's hot
What's hot (20)
Viewers also liked
Viewers also liked (9)
Similar to Aaj ka trend 17.03.17
Similar to Aaj ka trend 17.03.17 (20)
Recently uploaded
Recently uploaded (20)
Aaj ka trend 17.03.17
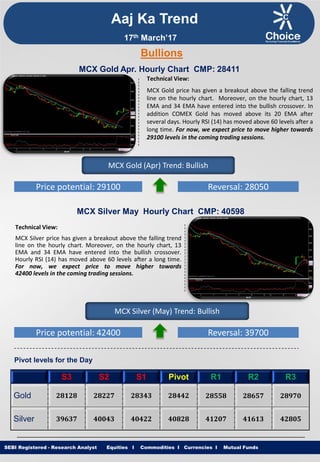
- 1. Equities I Commodities I Currencies I Mutual Funds Aaj Ka Trend Technical View: MCX Gold price has given a breakout above the falling trend line on the hourly chart. Moreover, on the hourly chart, 13 EMA and 34 EMA have entered into the bullish crossover. In addition COMEX Gold has moved above its 20 EMA after several days. Hourly RSI (14) has moved above 60 levels after a long time. For now, we expect price to move higher towards 29100 levels in the coming trading sessions. SEBI Registered - Research Analyst Equities I Commodities I Currencies I Mutual Funds Bullions MCX Gold Apr. Hourly Chart CMP: 28411 MCX Gold (Apr) Trend: Bullish Price potential: 29100 Reversal: 28050 MCX Silver May Hourly Chart CMP: 40598 Technical View: MCX Silver price has given a breakout above the falling trend line on the hourly chart. Moreover, on the hourly chart, 13 EMA and 34 EMA have entered into the bullish crossover. Hourly RSI (14) has moved above 60 levels after a long time. For now, we expect price to move higher towards 42400 levels in the coming trading sessions. MCX Silver (May) Trend: Bullish Price potential: 42400 Reversal: 39700 Pivot levels for the Day S3 S2 S1 Pivot R1 R2 R3 Gold 28128 28227 28343 28442 28558 28657 28970 Silver 39637 40043 40422 40828 41207 41613 42805 17th March’17
- 2. Equities I Commodities I Currencies I Mutual Funds Technical View: MCX Copper price has found support at the falling trend line and moved up higher. Moreover, on the hourly chart, price has taken support above 200 DEMA. In addition, on the hourly chart, 13 EMA and 34 EMA have entered into the bullish crossover. Moreover, momentum indicator RSI on the daily time frame has entered into bullish crossover, which suggests further upside momentum in the price. For now, we expect prices to move higher towards 403 levels in coming trading sessions. SEBI Registered - Research Analyst Equities I Commodities I Currencies I Mutual Funds MCX Copper Apr. Hourly Chart CMP: 387.75 MCX Copper (Apr) Trend: Bullish Price potential: 403 Reversal: 379 MCX Crude Oil March. Daily Chart CMP: 3192 Technical View: MCX Crude Oil price has found support at the lower band of the rising channel on the daily chart. In addition, proximity to the lower Bollinger band has induced a small pullback towards higher levels. Moreover, daily RSI has reversed from 22 levels and moving out of the oversold zone. For now, we expect prices to move higher towards 3350 levels in the few trading session. MCX Crude Oil (March) Trend: Bullish Price potential: 3350 Reversal: 3090 Pivot levels for the Day S3 S2 S1 Pivot R1 R2 R3 Copper 382.3 384.7 386.3 389 390 393 399 Crude 3087 3118 3148 3199 3225 3272 3391 Base Metal Energy Aaj Ka Trend 17th March’17
- 3. Equities I Commodities I Currencies I Mutual FundsSEBI Registered - Research Analyst Equities I Commodities I Currencies I Mutual Funds Other Base Metals & Energy S3 S2 S1 Pivot R1 R2 R3 Trend Copper 382.3 384.7 386.3 389 390 393 399 Aluminum 121.6 122.4 123.2 124.0 124.8 125.6 128.0 Lead 143.9 145.4 146.3 147.8 148.7 150.2 154.1 Nickel 648.5 656.2 661.6 669.3 674.7 682.4 703.2 Zinc 180.2 181.8 183.2 184.8 186.2 187.8 192.4 Natural Gas 184.5 186.9 190.0 192.4 195.5 197.9 205.8 Fundamental News: The dollar was little changed near one-month lows against other major currencies on Thursday, after the release of mostly positive U.S. data as the more dovish tone of the Federal Reserve’s latest policy statement continued to weigh. U.S. natural gas storage fell less-than-expected last month, official data showed on Thursday. In a report, Energy Information Administration said that U.S. Natural Gas Storage fell to a seasonally adjusted annual rate of -53B, from -68B in the preceding month. U.S. 30-year mortgage rates rose for a second straight week to their highest levels since late December in step with a jump in Treasury yields, according to mortgage finance agency Freddie Mac (PK:FMCC) on Thursday. U.S. natural gas futures were lower on Thursday, adding to losses after data showed that natural gas supplies in storage in the U.S. fell less than expected last week. Manufacturing activity in Philadelphia in February expanded more than expected, official data showed Thursday. Gold prices rallied to a more than one-week high during European morning hours on Thursday, after the Federal Reserve sounded more dovish than anticipated on future rate hikes. Oil extended gains Thursday after official figures showed a draw in U.S. crude stocks. US crude was up 41 cents, or 0.84%, at $49.27 at 08:15 ET. Brent crude added 49 cents, or 0.95%, to $52.30. Aaj Ka Trend 17th March’17
- 4. Equities I Commodities I Currencies I Mutual FundsSEBI Registered - Research Analyst Equities I Commodities I Currencies I Mutual Funds International Market Commodity Closing Price Gold 1226.70 Silver 17.30 Crude Oil 48.85 Brent Crude Oil 51.79 Natural Gas 2.914 COMEX/NYMEX/ICE ( Precious Metals & Energy) Currency & Commodity Index Currency (Spot) Current Price USD / INR 65.41 Dollar Index 100.25 EUR / USD 1.0774 CRB Index* 184.04 Closing as on 16.03.17 *Closing as on 16.03.17 LME (Base Metals) ( $ per tones) Commodity Closing Price Copper 5909 Aluminum 1900 Zinc 2829 Lead 2243 Nickel 10220 SHFE (Base Metals) (Yuan per tones) Commodity Closing Price Copper 47920 Aluminum 13830 Zinc 23395 Lead 18370 Closing as on 16.03.17 Closing as on 16.03.17 LME INVENTORY DATA Aaj Ka Trend 09-March-17 13-March-17 14-March-17 15-March-17 16-March-17 Aluminium -16750 -16275 -14100 -21425 -11475 Copper 38775 -1800 5700 850 -1500 Lead 675 675 675 600 -125 Nickel -288 -852 -1068 612 -1476 Zinc -2175 -2475 3200 -1600 -1550 17th March’17
- 5. Equities I Commodities I Currencies I Mutual Funds This is solely for information of clients of Choice Broking and does not construe to be an investment advice. It is also not intended as an offer or solicitation for the purchase and sale of any financial instruments. Any action taken by you on the basis of the information contained herein is your responsibility alone and Choice Broking its subsidiaries or its employees or associates will not be liable in any manner for the consequences of such action taken by you. We have exercised due diligence in checking the correctness and authenticity of the information contained in this recommendation, but Choice Broking or any of its subsidiaries or associates or employees shall not be in any way responsible for any loss or damage that may arise to any person from any inadvertent error in the information contained in this recommendation or any action taken on basis of this information. Technical analysis studies market psychology, price patterns and volume levels. It is used to forecast future price and market movements. Technical analysis is complementary to fundamental analysis and news sources. The recommendations issued herewith might be contrary to recommendations issued by Choice Broking in the company research undertaken as the recommendations stated in this report is derived purely from technical analysis. Choice Broking has based this document on information obtained from sources it believes to be reliable but which it has not independently verified; Choice Broking makes no guarantee, representation or warranty and accepts no responsibility or liability as to its accuracy or completeness. The opinions contained within the report are based upon publicly available information at the time of publication and are subject to change without notice. The information and any disclosures provided herein are in summary form and have been prepared for informational purposes. The recommendations and suggested price levels are intended purely for trading purposes. The recommendations are valid for the day of the report however trading trends and volumes might vary substantially on an intraday basis and the recommendations may be subject to change. The information and any disclosures provided herein may be considered confidential. Any use, distribution, modification, copying, forwarding or disclosure by any person is strictly prohibited. The information and any disclosures provided herein do not constitute a solicitation or offer to purchase or sell any security or other financial product or instrument. The current performance may be unaudited. Past performance does not guarantee future returns. There can be no assurance that investments will achieve any targeted rates of return, and there is no guarantee against the loss of your entire investment. POTENTIAL CONFLICT OF INTEREST DISCLOSURE (as on date of report) Disclosure of interest statement – • Analyst interest of the stock /Instrument(s): - No. • Firm interest of the stock / Instrument (s): - No. Disclaimer Contact Us Amit Pathania Research Associate amit.pathania@choiceindia.com www.choicebroking.incustomercare@choiceindia.com SEBI Registered - Research Analyst Equities I Commodities I Currencies I Mutual Funds Aaj Ka Trend 17th March’17 Neeraj Yadav Research Advisor neeraj.yadav@choiceindia.com Anish Vyas Senior Research Associate anish.vyas@choiceindia.com Anish Vyas Digitally signed by Anish Vyas DN: cn=Anish Vyas, o=Choice Merchandise Broking Pvt. Ltd, ou=Sr. Research Associate, email=anish.vyas@choiceindia.com, c=IN Date: 2017.03.17 08:46:50 +05'30'