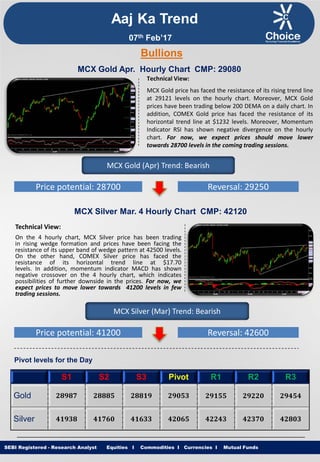
- MCX gold and silver prices are expected to move lower in the coming trading sessions due to resistance levels being reached on hourly and daily charts and momentum indicators showing negative signals. MCX gold may fall to 28700 levels and MCX silver to 41200 levels.
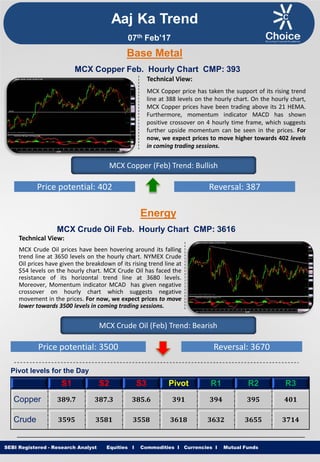
- MCX copper prices are expected to rise to 402 levels as prices are trading above the 21 HEMA and MACD has shown a positive crossover on the 4 hourly chart, suggesting further upside.
- MCX crude oil prices are expected to fall to 3500 levels as prices are hovering around a falling trend line on the hourly chart and momentum indicators have given negative signals.