1. Equities I Commodities I Currencies I Mutual Funds
Aaj Ka Trend
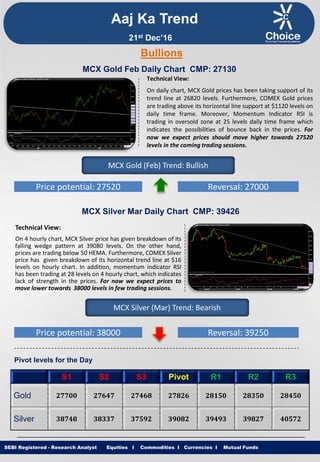
Technical View:
On daily chart, MCX Gold prices has been taking support of its
trend line at 26820 levels. Furthermore, COMEX Gold prices
are trading above its horizontal line support at $1120 levels on
daily time frame. Moreover, Momentum Indicator RSI is
trading in oversold zone at 25 levels daily time frame which
indicates the possibilities of bounce back in the prices. For
now we expect prices should move higher towards 27520
levels in the coming trading sessions.
SEBI Registered - Research Analyst Equities I Commodities I Currencies I Mutual Funds
Bullions
MCX Gold Feb Daily Chart CMP: 27130
MCX Gold (Feb) Trend: Bullish
Price potential: 27520 Reversal: 27000
MCX Silver Mar Daily Chart CMP: 39426
Technical View:
On 4 hourly chart, MCX Silver price has given breakdown of its
falling wedge pattern at 39080 levels. On the other hand,
prices are trading below 50 HEMA. Furthermore, COMEX Silver
price has given breakdown of its horizontal trend line at $16
levels on hourly chart. In addition, momentum indicator RSI
has been trading at 28 levels on 4 hourly chart, which indicates
lack of strength in the prices. For now we expect prices to
move lower towards 38000 levels in few trading sessions.
MCX Silver (Mar) Trend: Bearish
Price potential: 38000 Reversal: 39250
Pivot levels for the Day
S1 S2 S3 Pivot R1 R2 R3
Gold 27700 27647 27468 27826 28150 28350 28450
Silver 38748 38337 37592 39082 39493 39827 40572
21st Dec’16
2. Equities I Commodities I Currencies I Mutual Funds
Technical View:
MCX Copper price has shown breakdown of its ascending
triangle pattern at 383 levels on daily chart. Moreover,
COMEX Copper price has witnessed breakdown of its
ascending triangle pattern $2.62 levels on daily chart. In
addition MCX Copper prices are trading below its 21 DEMA.
Furthermore, momentum indicator MACD has shown
negative crossover on daily time frame, which suggest
further weakness in the momentum can be seen. For now
we expect prices to move lower towards 368 levels in
coming trading sessions.
SEBI Registered - Research Analyst Equities I Commodities I Currencies I Mutual Funds
MCX Copper Feb daily Chart CMP: 377.05
MCX Copper (Feb) Trend: Bearish
Price potential: 368 Reversal: 382
MCX Crude Oil Jan. Daily Chart CMP: 3641
Technical View:
MCX Crude Oil price has shown breakout of its ascending
triangle pattern 3530 levels on daily chart. MCX Crude Oil
price has been taking support of its horizontal trend line at
3356 levels on hourly chart. MCX Crude Oil is trading above
its 50 DEMA on daily chart. Moreover, Momentum indicator
RSI is trading above 60 levels on daily chart which suggest
the positive movement in the prices. For now we expect
prices to move higher towards 3730 levels in coming trading
sessions.
MCX Crude Oil (Jan) Trend: Bullish
Price potential: 3730 Reversal: 3580
Pivot levels for the Day
S1 S2 S3 Pivot R1 R2 R3
Copper 373.8 371.1 366.2 376.0 378.7 380.9 385.8
Crude 3602 3564 3491 3637 3675 3710 3783
Base Metal
Energy
Aaj Ka Trend
21st Dec’16
3. Equities I Commodities I Currencies I Mutual FundsSEBI Registered - Research Analyst Equities I Commodities I Currencies I Mutual Funds
Other Base Metals & Energy
S1 S2 S3 Pivot R1 R2 R3 Trend
Copper 373.8 371.1 366.2 376.0 378.7 380.9 385.8
Aluminum 116.3 115.3 113.5 117.0 118.1 118.8 120.5
Lead 145.0 141.9 136.4 147.3 150.5 152.8 158.2
Nickel 736.4 730.8 719.7 741.9 747.5 753.0 764.1
Zinc 175.0 171.6 166.3 176.9 180.3 182.2 187.5
Natural Gas 219.8 215.5 205.5 225.5 229.8 235.5 245.5
Fundamental News:
Gold prices edged lower on Tuesday, as the U.S. dollar bounced back toward its 14-year high against a basket of
major currencies with markets focused on the possibility of further U.S. interest rate hikes next year.
The dollar index, which measures the greenback’s strength against a trade-weighted basket of six major
currencies, was up 0.25% at 103.32 in early trade, coming within sight of its 14-year peak of 103.55 touched last
week.
A stronger U.S. dollar usually weighs on gold, as it dampens the metal's appeal as an alternative asset and
makes dollar-priced commodities more expensive for holders of other currencies.
Optimistic remarks on the U.S. labor market by Federal Reserve Chair Janet Yellen strengthened the possibility
of further rate hikes next year.
The precious metal is sensitive to moves in U.S. rates, which lift the opportunity cost of holding non-yielding
assets such as bullion, while boosting the dollar in which it is priced.
Oil turned higher Tuesday on expectations of a fall in U.S. crude stocks in the latest week.
Official Energy Information Administration figures due out Wednesday are forecast to show crude stocks falling
by 2.4 million barrels.
The future path of the market will hinge on compliance levels for agreed output cuts.
OPEC has agreed to reduce production by 1.2 million barrels a day and non-OPEC producers by 558,000 barrels.
Investors are also looking to a possible increase in North American shale activity in a higher price environment.
The number of oil rigs operating in the U.S. is now at its highest level since the start of the year.
Aaj Ka Trend
21st Dec’16
4. Equities I Commodities I Currencies I Mutual FundsSEBI Registered - Research Analyst Equities I Commodities I Currencies I Mutual Funds
International Market
Commodity Closing Price
Gold 1134.26
Silver 16.08
Crude Oil 53.56
Brent Crude Oil 55.55
Natural Gas 3.316
COMEX/NYMEX/ICE ( Precious Metals & Energy) Currency & Commodity Index
Currency (Spot) Current Price
USD / INR 68.04
Dollar Index 103.09
EUR / USD 1.0410
CRB Index* 190.56
Closing as on 20.12.16 *Closing as on 20.12.16
LME (Base Metals) ( $ per tones)
Commodity Closing Price
Copper 5502
Aluminum 1721
Zinc 2637
Lead 2195
Nickel 10925
SHFE (Base Metals) (Yuan per tones)
Commodity Closing Price
Copper 45290
Aluminum 12765
Zinc 21345
Lead 18630
Closing as on 20.12.16 Closing as on 20.12.16
LME INVENTORY DATA
Aaj Ka Trend
14-Dec-16 15-Dec-16 16-Dec-16 19-Dec-16 20-Dec-16
Aluminium -22201 -2751 -28074 -5224 -2826
Copper 19949 17174 11776 38399 -1451
Lead -51 -101 -49 -549 215
Nickel 1141 1669 -121 115 -2300
Zinc -902 41 -1826 -1301 -574
21st Dec’16
5. Equities I Commodities I Currencies I Mutual Funds
This is solely for information of clients of Choice Broking and does not construe to be an investment advice. It is also not intended as an offer or solicitation
for the purchase and sale of any financial instruments. Any action taken by you on the basis of the information contained herein is your responsibility alone
and Choice Broking its subsidiaries or its employees or associates will not be liable in any manner for the consequences of such action taken by you. We
have exercised due diligence in checking the correctness and authenticity of the information contained in this recommendation, but Choice Broking or any of
its subsidiaries or associates or employees shall not be in any way responsible for any loss or damage that may arise to any person from any inadvertent
error in the information contained in this recommendation or any action taken on basis of this information. Technical analysis studies market psychology,
price patterns and volume levels. It is used to forecast future price and market movements. Technical analysis is complementary to fundamental analysis
and news sources. The recommendations issued herewith might be contrary to recommendations issued by Choice Broking in the company research
undertaken as the recommendations stated in this report is derived purely from technical analysis. Choice Broking has based this document on information
obtained from sources it believes to be reliable but which it has not independently verified; Choice Broking makes no guarantee, representation or warranty
and accepts no responsibility or liability as to its accuracy or completeness. The opinions contained within the report are based upon publicly available
information at the time of publication and are subject to change without notice. The information and any disclosures provided herein are in summary form
and have been prepared for informational purposes. The recommendations and suggested price levels are intended purely for trading purposes. The
recommendations are valid for the day of the report however trading trends and volumes might vary substantially on an intraday basis and the
recommendations may be subject to change. The information and any disclosures provided herein may be considered confidential. Any use, distribution,
modification, copying, forwarding or disclosure by any person is strictly prohibited. The information and any disclosures provided herein do not constitute a
solicitation or offer to purchase or sell any security or other financial product or instrument. The current performance may be unaudited. Past performance
does not guarantee future returns. There can be no assurance that investments will achieve any targeted rates of return, and there is no guarantee against
the loss of your entire investment.
POTENTIAL CONFLICT OF INTEREST DISCLOSURE (as on date of report) Disclosure of interest statement – • Analyst interest of the stock
/Instrument(s): - No. • Firm interest of the stock / Instrument (s): - No.
Disclaimer
Contact Us
Amit Pathania
Research Associate
amit.pathania@choiceindia.com
www.choicebroking.incustomercare@choiceindia.com
SEBI Registered - Research Analyst Equities I Commodities I Currencies I Mutual Funds
Aaj Ka Trend
21st Dec’16
Neeraj Yadav
Research Advisor
neeraj.yadav@choiceindia.com
Anish Vyas
Senior Research Associate
anish.vyas@choiceindia.com
Anish Vyas
Digitally signed by Anish Vyas
DN: cn=Anish Vyas, o=Choice Merchandise
Broking Pvt. Ltd, ou=Sr. Research Associate,
email=anish.vyas@choiceindia.com, c=IN
Date: 2016.12.21 08:34:51 +05'30'