
Recommended
More Related Content
What's hot
What's hot (20)
Similar to Aaj ka trend 05.10.16
Similar to Aaj ka trend 05.10.16 (20)
Recently uploaded
Recently uploaded (20)
Aaj ka trend 05.10.16
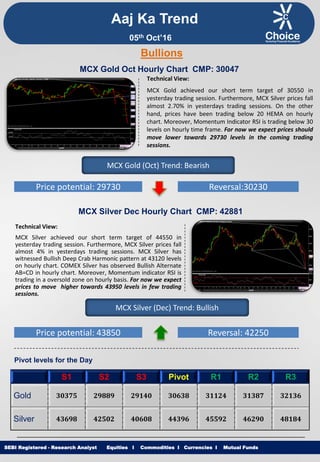
- 1. Equities I Commodities I Currencies I Mutual Funds Aaj Ka Trend Technical View: MCX Gold achieved our short term target of 30550 in yesterday trading session. Furthermore, MCX Silver prices fall almost 2.70% in yesterdays trading sessions. On the other hand, prices have been trading below 20 HEMA on hourly chart. Moreover, Momentum Indicator RSI is trading below 30 levels on hourly time frame. For now we expect prices should move lower towards 29730 levels in the coming trading sessions. SEBI Registered - Research Analyst Equities I Commodities I Currencies I Mutual Funds Bullions MCX Gold Oct Hourly Chart CMP: 30047 MCX Gold (Oct) Trend: Bearish Price potential: 29730 Reversal:30230 MCX Silver Dec Hourly Chart CMP: 42881 Technical View: MCX Silver achieved our short term target of 44550 in yesterday trading session. Furthermore, MCX Silver prices fall almost 4% in yesterdays trading sessions. MCX Silver has witnessed Bullish Deep Crab Harmonic pattern at 43120 levels on hourly chart. COMEX Silver has observed Bullish Alternate AB=CD in hourly chart. Moreover, Momentum indicator RSI is trading in a oversold zone on hourly basis. For now we expect prices to move higher towards 43950 levels in few trading sessions. MCX Silver (Dec) Trend: Bullish Price potential: 43850 Reversal: 42250 Pivot levels for the Day S1 S2 S3 Pivot R1 R2 R3 Gold 30375 29889 29140 30638 31124 31387 32136 Silver 43698 42502 40608 44396 45592 46290 48184 05th Oct’16
- 2. Equities I Commodities I Currencies I Mutual Funds Technical View: On hourly chart MCX Copper has breached its vertical trend line support at 324.40 levels. Furthermore, Counter is trading below its 100 HEMA on hourly chart. Moreover, momentum indicator MACD has observed negative crossover on hourly time frame. In addition, Momentum indicator RSI has drift below 40 levels on hourly basis. For now we expect prices to move lower towards 315 levels in coming trading sessions. SEBI Registered - Research Analyst Equities I Commodities I Currencies I Mutual Funds MCX Copper Nov hourly Chart CMP: 322.20 MCX Copper (Nov) Trend: Bearish Price potential: 315 Reversal: 327 MCX Crude Oil Oct. Hourly Chart CMP: 3259 Technical View: MCX Crude Oil prices have witnessed breakout of its Triangle pattern at 3144 levels on hourly time frame. Furthermore, Counter is trading above its 20 HEMA on hourly chart. Looking at ADX, positive directional index (+DMI) is in domination position with rising average direction index. Moreover, Momentum indicator RSI is trading above 60 levels on hourly basis. For now we expect prices to move higher towards 3335 levels in coming trading sessions. MCX Crude Oil (Oct) Trend: Bullish Price potential: 3335 Reversal: 3210 Pivot levels for the Day S1 S2 S3 Pivot R1 R2 R3 Copper 322.8 320.8 317.6 324.0 326.0 327.2 330.4 Crude 3219 3191 3136 3246 3274 3301 3356 Base Metal Energy Aaj Ka Trend 05th Oct’16
- 3. Equities I Commodities I Currencies I Mutual FundsSEBI Registered - Research Analyst Equities I Commodities I Currencies I Mutual Funds Other Base Metals & Energy S1 S2 S3 Pivot R1 R2 R3 Trend Copper 322.8 320.8 317.6 324.0 326.0 327.2 330.4 Aluminum 110.7 110.2 109.3 111.1 111.6 112.0 112.9 Lead 137.4 135.7 132.7 138.7 140.4 141.7 144.7 Nickel 674.7 661.6 639.7 683.5 696.6 705.4 727.3 Zinc 158.4 156.8 154.1 159.6 161.2 162.3 165.1 Natural Gas 192.8 191.1 188.4 193.8 195.5 196.5 199.2 Fundamental News: Gold prices gained on Tuesday in Asia in think trade with most attention squarely on U.S. jobs data at the end of the week for a better view of chances the U.S. Federal Reserve will hike rates before the end of the year. Gold prices slipped near two-week lows on Tuesday, as a stronger U.S. dollar following recent upbeat U.S. data continued to weigh on the precious metal. Hurricane Matthew bore down on Haiti on Monday, where towns and villages braced for "catastrophic" floods and mudslides that forecasters fear will be triggered by 140 mile-per-hour (220 kph) winds and up to 3 feet of rain over its denuded hills. Crude oil prices fell in Asia on Tuesday as investors looked ahead to U.S. stockpiles data. Crude priced dropped further in Asia on Tuesday as investors awaited more supply news from the key U.S. market and in thin dealing with markets in China shut for a week-long holiday. U.S. oil futures slid lower on Tuesday, weighed by a stronger U.S. dollar but the commodity remained supported as the oil production freeze deal announced last week by OPEC continued to boost investors’ confidence. Oil prices eased on Tuesday on news that Iran and Libya have continued to increase production, overshadowing an OPEC agreement struck last week to freeze output levels in a bid to stem a two-year price rout. The dollar extended gains to a two-month high against the other major currencies on Tuesday, as comments by Richmond Federal Reserve head Jeffrey Lacker and upbeat U.S. data boosted hopes for a U.S. rate hike before the end of the year. Aaj Ka Trend 05th Oct’16
- 4. Equities I Commodities I Currencies I Mutual FundsSEBI Registered - Research Analyst Equities I Commodities I Currencies I Mutual Funds International Market Commodity Closing Price Gold 1275.65 Silver 17.93 Crude Oil 49.16 Brent Crude Oil 51.31 Natural Gas 2.98 COMEX/NYMEX/ICE ( Precious Metals & Energy) Currency & Commodity Index Currency (Spot) Current Price USD / INR 66.64 Dollar Index 96 EUR / USD 1.12 CRB Index* 187.30 Closing as on 04.10.16 *Closing as on 04.10.16 LME (Base Metals) ( $ per tones) Commodity Closing Price Copper 4763 Aluminum 1659 Zinc 2374 Lead 2061 Nickel 10020 SHFE (Base Metals) (Yuan per tones) Commodity Closing Price Copper 37540 Aluminum 12280 Zinc 17550 Lead 14250 Closing as on 04.10.16 Closing as on 04.10.16 LME INVENTORY DATA Aaj Ka Trend 28-Sept-16 29-Sept-16 30-Sept-16 03-Oct-16 04-Oct-16 Aluminium 7776 -10175 -4352 30422 -6547 Copper -2402 7350 -6952 -452 -3252 Lead -251 -504 -251 -202 151 Nickel 25 -65 -655 208 -538 Zinc -827 -525 -626 -271 8872 05th Oct’16
- 5. Equities I Commodities I Currencies I Mutual Funds This is solely for information of clients of Choice Broking and does not construe to be an investment advice. It is also not intended as an offer or solicitation for the purchase and sale of any financial instruments. Any action taken by you on the basis of the information contained herein is your responsibility alone and Choice Broking its subsidiaries or its employees or associates will not be liable in any manner for the consequences of such action taken by you. We have exercised due diligence in checking the correctness and authenticity of the information contained in this recommendation, but Choice Broking or any of its subsidiaries or associates or employees shall not be in any way responsible for any loss or damage that may arise to any person from any inadvertent error in the information contained in this recommendation or any action taken on basis of this information. Technical analysis studies market psychology, price patterns and volume levels. It is used to forecast future price and market movements. Technical analysis is complementary to fundamental analysis and news sources. The recommendations issued herewith might be contrary to recommendations issued by Choice Broking in the company research undertaken as the recommendations stated in this report is derived purely from technical analysis. Choice Broking has based this document on information obtained from sources it believes to be reliable but which it has not independently verified; Choice Broking makes no guarantee, representation or warranty and accepts no responsibility or liability as to its accuracy or completeness. The opinions contained within the report are based upon publicly available information at the time of publication and are subject to change without notice. The information and any disclosures provided herein are in summary form and have been prepared for informational purposes. The recommendations and suggested price levels are intended purely for trading purposes. The recommendations are valid for the day of the report however trading trends and volumes might vary substantially on an intraday basis and the recommendations may be subject to change. The information and any disclosures provided herein may be considered confidential. Any use, distribution, modification, copying, forwarding or disclosure by any person is strictly prohibited. The information and any disclosures provided herein do not constitute a solicitation or offer to purchase or sell any security or other financial product or instrument. The current performance may be unaudited. Past performance does not guarantee future returns. There can be no assurance that investments will achieve any targeted rates of return, and there is no guarantee against the loss of your entire investment. POTENTIAL CONFLICT OF INTEREST DISCLOSURE (as on date of report) Disclosure of interest statement – • Analyst interest of the stock /Instrument(s): - No. • Firm interest of the stock / Instrument (s): - No. Disclaimer Contact Us Amit Pathania Research Associate amit.pathania@choiceindia.com Rohan Patil Research Associate rohan.patil@choiceindia.com www.choicebroking.incustomercare@choiceindia.com SEBI Registered - Research Analyst Equities I Commodities I Currencies I Mutual Funds Aaj Ka Trend 05th Oct’16 Neeraj Yadav Research Advisor neeraj.yadav@choiceindia.com Anish Vyas Senior Research Associate anish.vyas@choiceindia.com Amit Pathania Digitally signed by Amit Pathania DN: cn=Amit Pathania, o=Choice Equity Broking Pvt. ltd, ou=Research Department, email=amit.pathania@choiceindia.com, c=IN Date: 2016.10.05 08:45:51 +05'30'